Abstract
Unlike naive T cells, effector T cells can be activated by either T cell receptor signal or costimulatory signal alone and therefore the absence of costimulatory molecules on tissue cells cannot explain the tolerance mechanism at the effector phase. Here we report that PD-L1, the ligand for the immunoinhibitory receptor PD-1, was expressed on vascular endothelium in peripheral tissues. Liver nonparenchymal cells including sinusoidal endothelial cells and Kupffer cells constitutively expressed PD-L1 and inhibited proliferation and cell division of activated T cells expressing PD-1. The absence of PD-1 induced proliferation of effector T cells in the adenovirus-infected liver and resulted in rapid clearance of the virus. These results indicate that PD-1 plays an important role in T cell tolerance at the effector phase and the blockade of the PD-1 pathway can augment antiviral immunity.
Keywords: T cell, virus, peripheral tolerance, endothelial cell, immuno-inhibition
Introduction
It is well established that activation of naive T cells requires both TCR signal and costimulatory signal (1). When naive T cells differentiate into effector cells, they change their activation requirement. Effector T cells are much less dependent on costimulation than naive T cells. Effector T cells, unlike naive T cells, can be activated by TCR signal alone (2, 3). A more perplexing and less easily understandable observation is that effector T cells can be activated by costimulatory signal in the absence of TCR signal (4, 5). As effector T cells can be easily activated, their negative regulatory system should play vital roles in the maintenance of peripheral tolerance. Nevertheless, little is known about the mechanism that prevents undesirable or excessive activation of effector T cells in the periphery.
PD-1, a member of the CD28 family, is a negative regulator of the immune system (6–8). PD-1 is induced on T cells, B cells, and myeloid cells upon activation in vitro (9), but predominantly expressed on activated T cells in vivo (10). PD-1 has two tyrosine residues in its cytoplasmic region; the NH2-terminal and COOH-terminal residues are located in the immunoreceptor tyrosine-based inhibitory motif (ITIM) and the immunoreceptor tyrosine-based switch motif (ITSM), respectively (11). Cross-linking of PD-1 with antigen receptor induces phosphorylation of the ITSM tyrosine and recruits SHP-2 to deliver a negative signal (12). PD-1 is expressed on double negative thymocytes and appears to modulate positive selection in thymus (13). PD-1–deficient (PD-1−/−) mice crossed with H-2Ld–specific 2C-TCR transgenic mice on the H-2b/d background develop chronic and systemic graft-versus-host–like disease, although the majority of 2C-expressing cells are deleted in thymus (14). PD-1 deficiency causes organ-specific autoimmune diseases depending on genetic backgrounds. C57BL/6-PD-1−/− mice develop lupus-like arthritis and glomerulonephritis (14), while BALB/c-PD-1−/− mice suffer from fatal dilated cardiomyopathy with IgG deposition in heart (15). These results indicate that PD-1 may be involved in peripheral tolerance as well as central tolerance.
Recently PD-L1 (B7-H1) and PD-L2 (B7-DC) were identified as ligands for PD-1 (16–19). mRNA for PD-L1 is constitutively expressed in nonlymphoid tissues such as heart, lung, placenta, kidney, and liver (16, 17). Eppihimer et al. suggested that the source of PD-L1 mRNA in peripheral tissues might be vascular endothelium (20). Human PD-L2 mRNA is expressed in nonlymphoid tissues as well as human PD-L1, while murine PD-L2 mRNA expression is weaker and more restricted than that of murine PD-L1 (18, 21). Cell surface PD-L1 expression is broadly induced on APCs such as DCs, macrophages, and B cells, whereas surface PD-L2 is selectively expressed on DCs and some macrophages after stimulation (22, 23). In addition, PD-L1 is expressed on the surface of hematopoietic and nonhematopoietic tumor cells, while surface PD-L2 expression has not been reported on nonhematopoietic cells (22, 23). The distinct expression of PD-L1 and PD-L2 suggests that PD-L1 may function as the major ligand for PD-1 at least in the murine immune system.
Interestingly, PD-1 ligands (PD-Ls) show different tissue distributions from those of the other B7 molecules, in spite of their structural similarity. In contrast to constitutive expression of PD-Ls in peripheral tissues, B7–1 and B7–2 expression is restricted to lymphoid organs, primarily on APCs (1, 24), suggesting that they may exhibit distinct functions at different phases of immune responses. PD-1 expression on activated T cells and constitutive expression of PD-L1 in peripheral tissues led to the hypothesis that PD-1/PD-L1 interaction might occur at the effector phase of immune responses when activated T cells migrate into sites of inflammation or infection.
It has been known that the liver often induces peripheral tolerance rather than immunity (25, 26). Allogenic liver transplantation across incompatible MHC barriers is often successful without the need for immunosuppression (27). In addition, administration of antigen via portal vein efficiently induces antigen-specific tolerance (28). Furthermore, immune responses against hepatitis viruses such as HBV and HCV are commonly ineffective and result in chronic persistence of viral infection. Liver nonparenchymal cells (LNPCs)* including Kupffer cells and liver sinusoidal endothelial cells (LSECs) constitutively expressed a series of cell-surface molecules associated with antigen presentation, such as MHC class I and II, ICAM-1 (CD54), B7–1, and B7–2, suggesting their involvement in the immune response (26, 29–31). Recent studies suggest that LNPCs such as LSECs and Kupffer cells may be involved in the hepatic tolerance induction (26, 29, 32), but its molecular mechanism remains unknown.
We found that PD-L1 was constitutively expressed on LNPCs. The regulatory function of PD-1 at the effector phase of immune responses in the liver was analyzed using an in vitro culture system and an in vivo liver injury model induced by adenovirus infection. Here, we report that constitutive expression of PD-L1 on LNPCs is essential to inhibit proliferation of activated T cells in the liver, suggesting that the PD-1/PD-L1 system may play important roles in negative regulation of immune responses in the liver.
Materials and Methods
Mice.
C57BL/6 (B6) mice were purchased from Japan SLC. PD-1−/− mice (33) were backcrossed to B6 mice for 11 generations. The animals were maintained under specific pathogen-free conditions.
Adenovirus Infection.
Type 5 adenovirus with deletions in the E1 and E3 regions and carrying the lacZ gene (Ad-lacZ) was propagated in 293 cells and purified on cesium chloride gradient as described previously (34). Mice were intravenously injected with 109–1010 PFU of Ad-lacZ.
Isolation of Heart Endothelial Cells.
Endothelial cells (ECs) were isolated from hearts as described (35) with some modifications. Briefly, heart tissue was digested with collagenase. Cells were preincubated with murine Ig to block Fc receptors and incubated with FITC-conjugated anti-CD31, CD105, and isolectin B4, followed by anti-FITC microbeads. ECs were purified by positive selection with magnetic-activated cell-sorting (MACS) separation columns (Miltenyi Biotec).
Isolation of LNPCs.
LNPCs were isolated using the pronase E method as described previously (36) with some modifications. Briefly, the liver was perfused and incubated with pronase E (Merck) solution. LNPCs were separated by density gradient centrifugation. The relative distribution of Kupffer cells (CD54+, CD11bhigh) and LSECs (CD54+, CD11blow) in the cell suspension was 20–25% and 75–80%, respectively.
Isolation of Kupffer Cells and LSECs.
Kupffer cells and LSECs were purified from LNPCs using MACS. Briefly, LNPCs were preincubated with murine Ig to block Fc receptors and incubated with anti-CD11b microbeads. Kupffer cells and LSECs were purified by positive and negative selection with MACS separation columns, respectively.
Isolation of Intrahepatic Lymphocytes.
Intrahepatic lymphocytes (IHLs) were isolated from livers as described previously (37). Briefly, liver tissue was passed through a 200-gause stainless steel mesh and mononuclear cells were purified by Percoll gradient centrifugation. RBCs contained in the mononuclear cell preparation were lysed by ammonium chloride.
Activation of T Cells.
Naive T cells (>90% purity) were purified from spleens and lymph nodes by negative selection using T cell enrichment column (Genzyme). Naive T cells (3 × 10⁵ cells/well) were incubated on anti-CD3 mAb (2C11, 10 μg/ml) coated 96-well flat-bottomed plates for 48 h. Proliferation was determined by labeling of cultures for the last 6 h with BrdU using Proliferation ELISA kit (Roche). For cytokine assays, culture supernatants were harvested at 48 h after activation. IFN-γ concentration was determined using commercial ELISA kit (Genzyme).
Culture of Activated T Cells with LNPCs.
Proliferation of LNPCs was inhibited by incubation with mitomycin C (50 μg/ml; Sigma-Aldrich) for 30 min at 37°C. Previously activated T cells (3 × 10⁴ cells/well) were cocultured with 2 × 10⁵ mitomycin C (MMC)-treated LNPCs for 60 h in the presence or absence of anti-PD-L1 mAb (1–111, 30 μg/ml) or cytotoxic T lymphocyte antigen-4 (CTLA-4)-Ig (20 μg/ml; Genzyme). In some experiments, previously activated T cells (3 × 10⁴ cells/well) were cocultured with MMC-treated purified Kupffer cells (4 × 10⁴ cells/well), LSECs (1.6 × 10⁵ cells/well), or KCs + LSECs (4 × 10⁴ cells: 1.6 × 10⁵ cells/well) for 60 h. Proliferation was determined by labeling of cultures for the last 12 h with BrdU. Supernatants were collected at 48 h after initiation of cocultures and IFN-γ was measured by ELISA as described above. In some experiments, previously activated T cells were labeled with 5 μM CFSE (5-(6)-carboxy-fluorescein diacetate succinimidyl diester; Molecular Probes) in PBS for 8 min at room temperature and washed three times before coculture with LNPCs.
In Vivo BrdU Labeling.
At day 0 or 7 of adenovirus infection, mice were intraperitoneally injected with 0.5 mg of BrdU (Sigma-Aldrich) in 0.5 ml of PBS. 1 h after BrdU injection, spleen and livers were harvested for BrdU detection by flow cytometry and immunohistochemistry.
Flow Cytometry.
The following reagents were used for surface staining: anti-CD3-APC, anti-CD4-FITC, anti-CD4-PE, anti-CD8-APC, anti-CD11b-APC, anti-CD25-PE, anti-CD31-FITC, anti-CD44-PE, anti-CD69-PE, anti-CTLA-4-PE, anti-CD54 (ICAM-1)–FITC, anti-CD54-biotin, anti-B7–1 (CD80)–biotin, anti-B7–2 (CD86)–biotin, and anti-CD105-FITC which were purchased from BD Biosciences. Streptavidin (SA)-FITC and SA-PE were purchased from DakoCytomation. Isolection B4-FITC was purchased from Vector Laboratories. Anti-PD-1 (J43), anti-PD-L1 (1–111), anti-PD-L2 (#122), and their conjugates were generated in our laboratory (9, 22). 10,000 events were analyzed on a FACSCalibur™ (Becton Dickinson) using the CELLQuest™ software (Becton Dickinson). Kupffer cells and LSECs were gated as CD54+CD11bhigh and CD54+CD11blow cells, respectively. CD4 and CD8 T cells were gated with anti-CD4-PE or FITC, and anti-CD8-APC, respectively.
BrdU staining was performed as described (38) with some modifications. Briefly, freshly isolated splenocytes and IHLs were stained for surface CD3, CD4, CD8, or CD19. The cells were then fixed and permeabilized using FIX & PERM cell permeabilization kit (Caltag). After DNA digestion, the cells were stained with FITC-conjugated anti-BrdU (BD Biosciences) and the percentage of stained cells was quantified by flow cytometry.
Histology.
To examine PD-L1 localization, mice were intravenously injected with 100 μg of biotinylated anti-PD-L1 (1–111) in 100 μl of PBS and organs were harvested 1 h later. 5-μm of cryosections were fixed with 4% paraformaldehyde (PFA) and stained with SA-FITC. Sections were counterstained with phalloidin (Molecular Probes).
For detection of ICAM-1 and PD-L1, liver cryosections (5 μm) were fixed with 3% PFA and preincubated with normal rat serum to block nonspecific binding. Sections were incubated with biotinylated anti-PD-L1 (1–111) or anti–ICAM-1 (BD Biosciences) for 1 h at room temperature. Biotinylated mAbs were visualized with tyramide signal amplification (TSA) fluorescence system (PerkinElmer).
For BrdU staining, single or double immunostaining was performed by indirect immunoalkaline phosphatase method (39). For double staining, acetone-fixed 5-μm liver cryosections were stained with anti-CD4 (RM4–5; BD Biosciences) or anti-CD8 (53–6.7; BD Biosciences) using ALP substrate kit (blue; Vector Laboratories). After further fixation with 1% glutaraldehyde in PBS for 9 min, sections were incubated with biotinylated anti-BrdU using a BrdU staining kit (Zymed Laboratories). Anti-BrdU was visualized with ALP substrate kit (red; Vector Laboratories).
For histopathological studies, liver cryosections were fixed with 10% buffered formalin and stained with hematoxylin and eosin.
For X-gal staining, liver cryosections were fixed with 0.2% glutaraldehyde and 2% formaldehyde for 10 min at room temperature and then incubated in X-gal (5-bromo-4-chloro-3-indolyl-b-D-galactopyranoside) solution for 2 h at 37°C. Sections were counterstained with nuclear fast red.
Results
PD-L1 Is Expressed on Vascular Endothelium in Nonlymphoid Tissues.
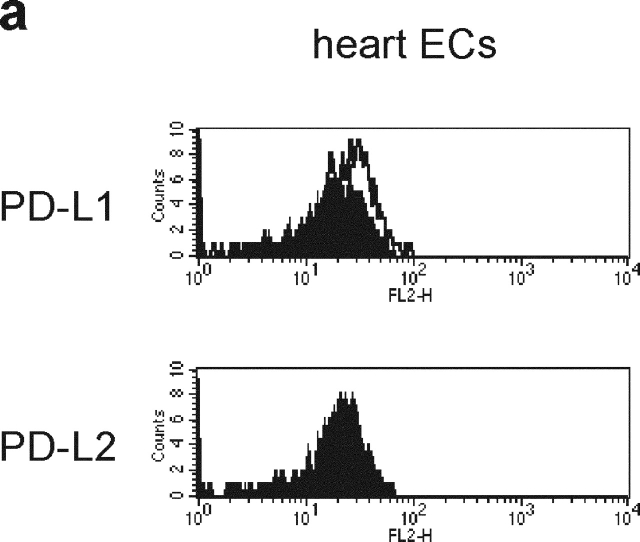
Several studies showed PD-L1 expression on human and murine ECs in culture conditions (20, 40). To determine whether ECs express the PD-L1 protein in vivo, we analyzed freshly isolated ECs from murine heart by flow cytometry using an anti-PD-L1 mAb. The primary EC isolates from heart expressed a low level of PD-L1 but not PD-L2 (Fig. 1 a). To examine PD-L1 distribution in the vascular system in a whole body, we intravenously injected mice with biotinylated F (ab′)2 fragment of anti-PD-L1 mAb or control IgG and examined the antibody staining in tissue sections (Fig. 1, b–g). PD-L1 was found on the vascular endothelium in all tissues examined such as heart, lung, kidney, salivary gland, and eye. In liver, PD-L1 was localized in the hepatic sinusoids. Control IgG had no staining.
Figure 1.
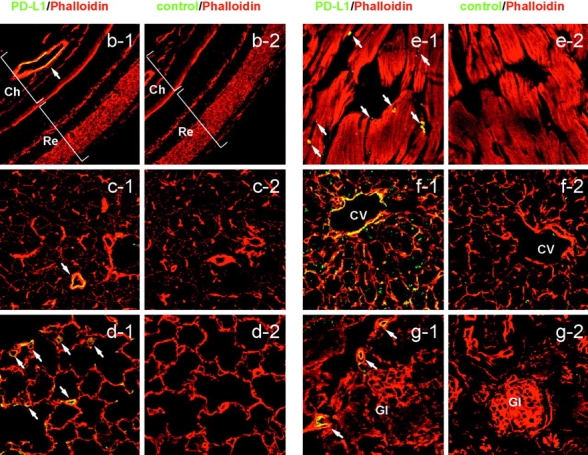
PD-L1 expression on vascular endothelium. (a) ECs were freshly isolated from murine heart and stained with anti-PD-L1 or anti-PD-L2 (open curves). The filled curves represent control IgG. (b-g) Biotinylated F(ab′)2 of anti-PD-L1 (b-g1) or control IgG (b-g2) was intravenously injected into mice and organs were harvested 1 h later. Sections were stained with streptavidin-FITC (green) and counterstained with phalloidin (red). (b) Eye, (c) submandibular gland, (d) lung, (e) heart, (f) liver, (g) kidney. Ch, choroid; CV, central vein; Gl, glomerulus; Re, retina. The arrows represent vascular endothelial cells. Original magnification, ×40.
PD-L1 Is Expressed on LNPCs.
We examined PD-L1 expression in the liver by immunohistochemistry using the anti-PD-L1 mAb (Fig. 2 a). PD-L1 staining was similar to that of ICAM-1 (CD54), which is expressed on LNPCs including Kupffer cells and LSECs (Fig. 2 a). To confirm the PD-L1 expression in the liver, LNPCs were isolated and analyzed by flow cytometry (Fig. 2 b). LNPCs consisted of CD54+CD11blow LSECs (75–80%) and CD54+CD11bhigh Kupffer cells (20–25%). Kupffer cells coexpressed PD-L1 with B7–1, B7–2, and ICAM-1. The expression of PD-L1 on LSECs was weak but significant as compared with that of B7–1 or B7–2. Neither LSECs nor Kupffer cells expressed PD-L2.
Figure 2.
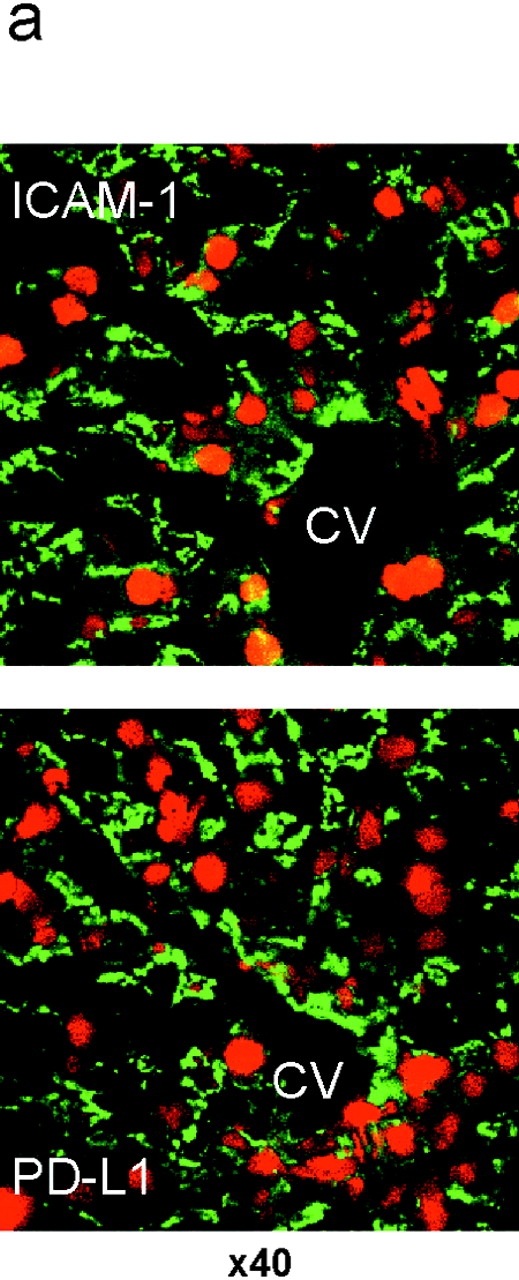
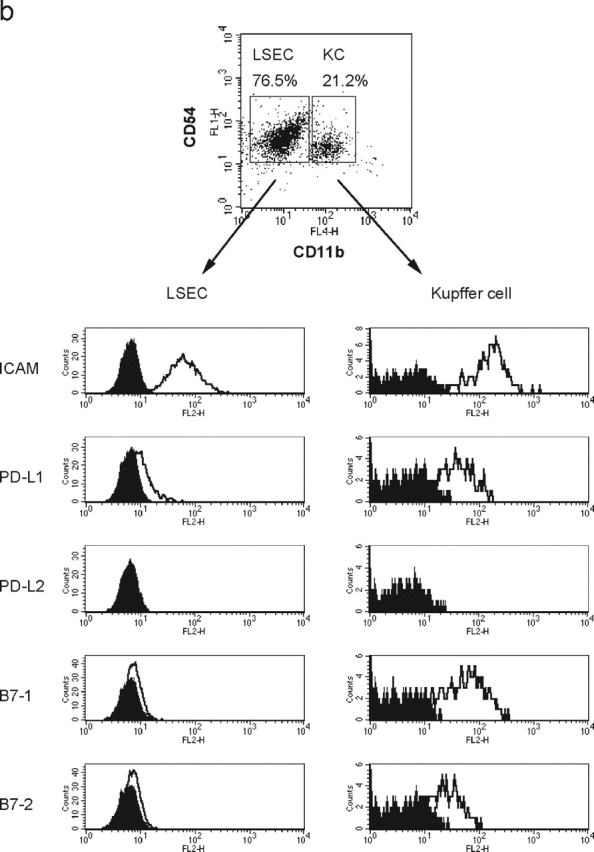
PD-L1 expression on liver nonparenchymal cells. (a) Cryosections of murine liver were stained with anti-ICAM-1 (top, green) or anti-PD-L1 (bottom, green). Nuclei were counterstained with propidium iodide (red). CV, central vein. Original magnification, ×40. (b) Surface phenotype of Kupffer cells and LSECs. LNPCs were isolated from murine livers and stained with anti-CD54 (ICAM-1)-FITC and anti-CD11b-APC, in combination with biotinylated mAb for ICAM-1, PD-L1, B7–1, or B7–2, followed by streptavidin-PE. Kupffer cells and LSECs were gated as CD54+CD11bhigh and CD54+CD11blow cells, respectively.
LNPCs Inhibit Proliferation of Activated T Cells via PD-1/PD-L1 Signal.
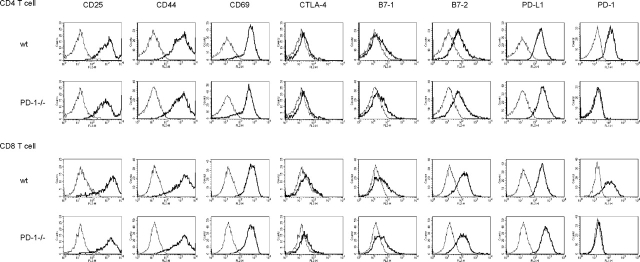
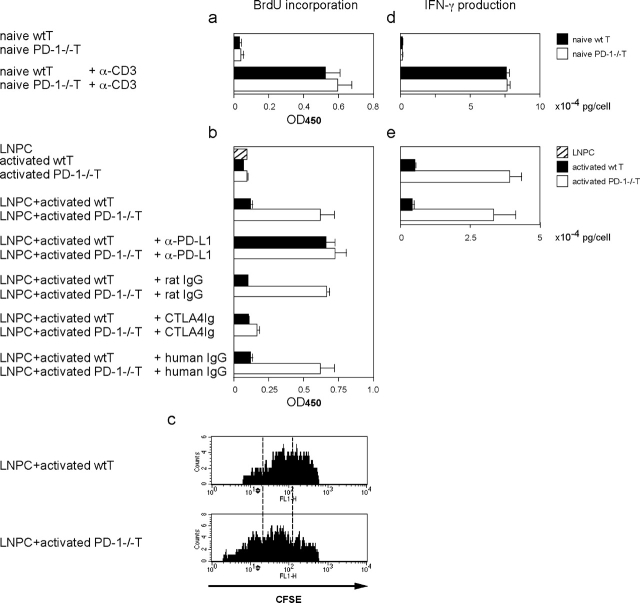
In the microanatomical environment of the liver, passenger T cells may be forced to contact with LNPCs in the narrow meshwork of the hepatic sinusoids (26). We assumed that when previously activated T cells pass through liver sinusoids, interaction between PD-1 on activated T cells and PD-L1 on LNPCs might induce suppressive signaling in activated T cells. To examine the function of PD-L1 on LNPCs, in vitro–activated T cells from PD-1−/− or WT mice were cocultured with mitomycin C–treated LNPCs from WT mice to measure T cell proliferation by BrdU incorporation. When naive T cells were stimulated with plate-bound anti-CD3 mAb, both PD-1−/− and WT T cells showed an activated phenotype (CD25high, CD44high, CD69high) (Fig. 3). Activated CD4+ and CD8+ T cells of PD-1−/− and WT mice increased expression levels of PD-L1 and B7–2, but marginally that of B7–1. PD-1 was strongly induced on WT CD4+ and CD8+ T cells. The cell density in the present system appeared to allow T cells to contact with each other and provide costimulatory signal to complement TCR signal by anti-CD3 stimulation. Proliferation of naive PD-1−/− and WT T cells activated with anti-CD3 was comparable (Fig. 4 a).
Figure 3.
Phenotypic analysis of activated T cells. In vitro–activated CD4+ or CD8+ T cells from PD-1−/− or WT mice were stained with a panel of mAbs (thick lines) and control IgG (thin lines).
Figure 4.
PD-L1 effect of LNPCs on T cell proliferation and cytokine production. (a and d) Naive T cells from PD-1−/− mice or WT mice were stimulated with or without plate-bound anti-CD3 for 48 h. T cell proliferation was measured by BrdU incorporation (a). The culture supernatants were harvested and IFN-γ production was measured by ELISA (d). (b and e) In vitro–activated PD-1−/− or WT T cells were cocultured for 48 h with or without mitomycin C–treated LNPCs from WT mice in the presence or absence of anti-PD-L1 (control rat IgG) or CTLA4-Ig (control human IgG). T cell proliferation was measured by BrdU incorporation (b). The culture supernatants were harvested and IFN-γ production was measured by ELISA (e). (c) In vitro–activated PD-1−/− or WT T cells were labeled with CFSE and cocultured with LNPCs. After 48 h of incubation, T cell division was examined by FACS® analysis of CFSE intensity.
Activated T cells were then diluted 10 folds to prevent the T–T interactions, and cocultured with LNPCs. After 48 h of coculture, activated PD-1−/− T cells showed much stronger proliferative response as compared with activated WT T cells, although activated T cells alone did not show proliferation (Fig. 4 b). Blocking of PD-1-PD-L1 interactions with the anti-PD-L1 mAb increased proliferation of WT T cells to the level equivalent to that of PD-1−/− T cells, whereas control rat IgG had no effect. Interruption of B7-CD28 interactions using the CTLA-4-Ig protein decreased proliferation of PD-1−/− T cells to the level identical to that of WT T cells, while control human IgG had no effect. Thus, we conclude that proliferation of activated T cells is inhibited by interaction between PD-1 on T cells and PD-L1 on LNPCs, although, in the absence of PD-1 signal, previously activated T cells can proliferate by interaction between CD28 on T cells and B7s on LNPCs.
To examine whether the inhibition of T cell proliferation was due to cell cycle arrest, activated T cells were labeled with CFSE, a reporter dye for cell division, and cocultured with LNPCs. PD-1−/− T cells showed lower intensity of CFSE as compared with WT T cells (Fig. 4 c), suggesting that cell division of WT T cells was suppressed by PD-1 signal.
The Absence of PD-1 Induces Prolonged Cytokine Production.
We next investigated the role of PD-1/PD-L1 signal in cytokine production. When naive CD3 T cells were stimulated with anti-CD3 for 2 d, IFN-γ production of PD-1−/− and WT T cells was comparable (Fig. 4 d). Activated T cells were then diluted 10 fold and cultured for another 2 d with or without LNPCs (Fig. 4 e). Although both WT and PD-1−/− activated T cells secreted reduced amounts of IFN-γ, activated PD-1−/− T cells showed less prominent reduction in IFN-γ production than activated WT T cells (Fig. 4 e). These data suggest that PD-1/PD-L1 signal during the activation phase quickly down-regulates cytokine production while the absence of PD-1 signal allows slower reduction, resulting in prolonged IFN-γ production.
Subsequent coculture with LNPCs did not further increase or decrease IFN-γ production from activated PD-1−/− T cells, although LNPCs had a strong proliferative effect on activated PD-1−/− T cells (Fig. 4, b and e). This observation is consistent with the reports that CD28/B7 interaction promotes Th2 but not Th1 cytokine production (41, 42). Strikingly, there was no significant reduction in IFN-γ production of activated WT T cells by coculture with LNPCs (Fig. 4 e). These results suggest that once T cells are activated, cytokine production cannot be blocked immediately by additional PD-1 signal.
Not Only Kupffer Cells but Also LSECs Inhibit Proliferation of Activated T Cells.
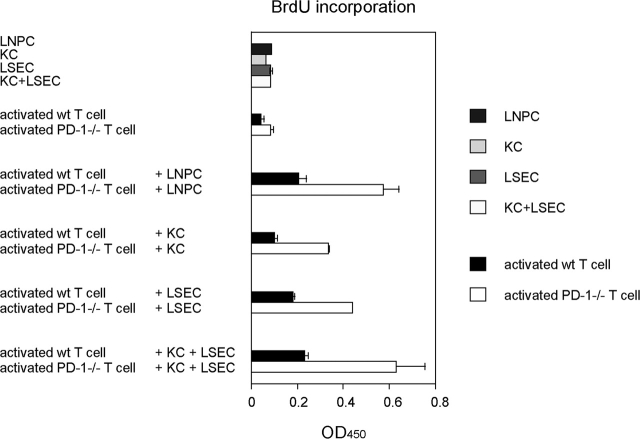
LNPCs consist of Kupffer cells and LSECs. To examine which populations, Kupffer cells, LSECs, or both, exert the inhibitory effect on proliferation of activated T cells, Kupffer cells and LSECs were purified from LNPCs by positive and negative selection, respectively, using anti-CD11b magnetic beads, and cocultured with activated PD-1−/− or WT T cells (Fig. 5). The coculture of activated PD-1−/− T cells with either Kupffer cells or LSECs alone showed higher proliferative responses than that of WT T cells. These results suggest that not only Kupffer cells but also LSECs can inhibit proliferation of activated T cells via PD-1 signal. To further confirm that the LNPC inhibitory effect on T cell proliferation was due to additive effects by Kupffer cells and LSECs, LNPCs were reconstituted by combining purified Kupffer cells and LSECs in the same ratio (1:4) as found in the original LNPCs, and cocultured with activated T cells. Activated PD-1−/− T cells cocultured with the reconstituted LNPCs showed the same level of proliferation as those cocultured with the unfractionated LNPCs. These results suggest that both Kupffer cells and LSECs contribute to proliferation inhibition of activated T cells.
Figure 5.
The effect of Kupffer cells and LSECs on proliferation of activated T cells. In vitro–activated PD-1−/− or WT T cells (3 × 10⁴ cells/well) were cocultured for 48 h with or without mitomycin C–treated LNPCs (before separation, 2 × 10⁵ cells/well, consisting of 20% Kupffer cells and 80% LSECs), purified KCs alone (4 × 10⁴ cells/well), purified LSECs alone (1.6 × 10⁵ cells/well), or mixture of purified Kupffer cells + LSECs (4 × 10⁴ cells: 1.6 × 10⁵ cells/well). T cell proliferation was measured by BrdU incorporation.
The Absence of PD-1 Signal Augments Proliferation of Effector T Cells in Inflamed Tissues and Antiviral Immune Responses.
To investigate the function of PD-1 in liver, we injected PD-1−/− or WT mice intravenously with recombinant lacZ-expressing adenovirus (Ad-lacZ). We compared T cell proliferation in the lymphoid organ (spleen) and inflamed tissue (liver) by in vivo BrdU labeling. At day 0, there were almost no proliferating cells in the liver of both PD-1−/− and WT mice (Fig. 6 a). At day 7, in the infected liver of PD-1−/− mice, infiltrating lymphocytes increased and the percentage of BrdU+CD3+ T cells was much higher than that of WT mice (Fig. 6, b and c). More than 80% of BrdU+ cells composed of CD4 and CD8 T cells in the infected liver of PD-1−/− and WT mice (Fig. 6 b). BrdU+ cells in both CD4 and CD8 T cell populations increased in the liver of PD-1−/− mice as compared with WT mice (Fig. 6, b and c). In contrast, the percentage of BrdU+CD3+ T cells in the spleen of PD-1−/− mice was similar or even less than that of WT mice (Fig. 6, b and c). These results suggest that PD-1 signal inhibits T cell proliferation in inflamed tissues rather than lymphoid organs. Consistent with the FACS analysis, immunohistochemistry showed that BrdU+ cells increased in the infected liver of PD-1−/− mice as compared with WT mice (Fig. 7, a–d). Double staining for BrdU and CD4 or CD8 also confirmed that most of BrdU+ cells were CD4 or CD8 T cells (Fig. 6 b, and Fig. 7, e and f).
Figure 6.
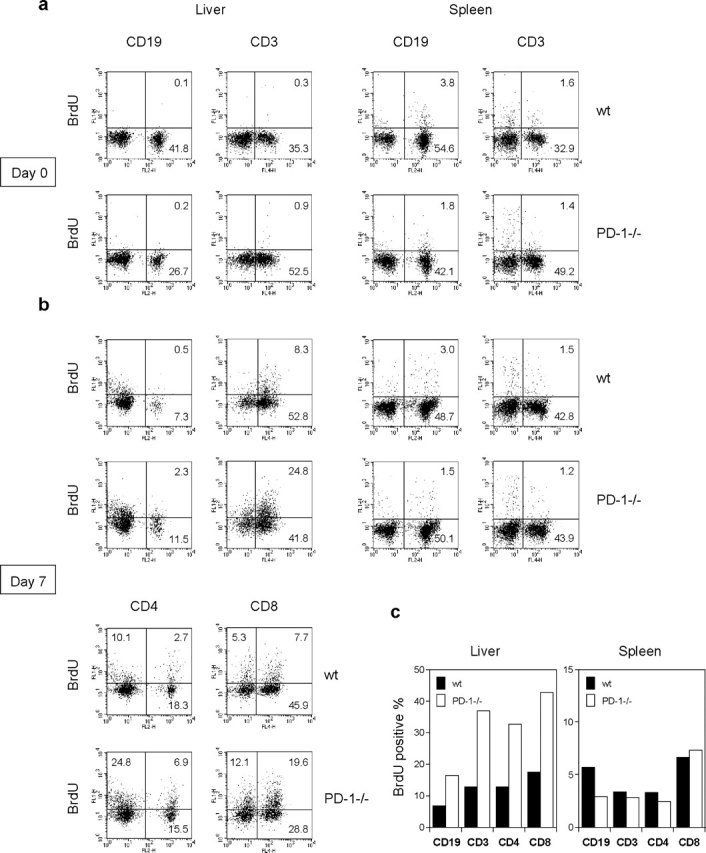
BrdU+ cells increased in the adnovirus-infected liver of PD-1−/− mice. PD-1−/− or WT mice (3 mice/group) were intravenously injected with Ad-lacZ. At day 0 (a) or day 7 (b) of infection, mice were intraperitoneally injected with BrdU 1 h before sacrifice. Splenocytes and intrahepatic lymphocytes were doubly stained for BrdU and CD19, CD3, CD4, or CD8. (c) The bars represent percentages of BrdU+ cells in the CD19, CD3, CD4, or CD8+ population at day 7 after infection. The results are representative of two separate experiments.
Figure 7.
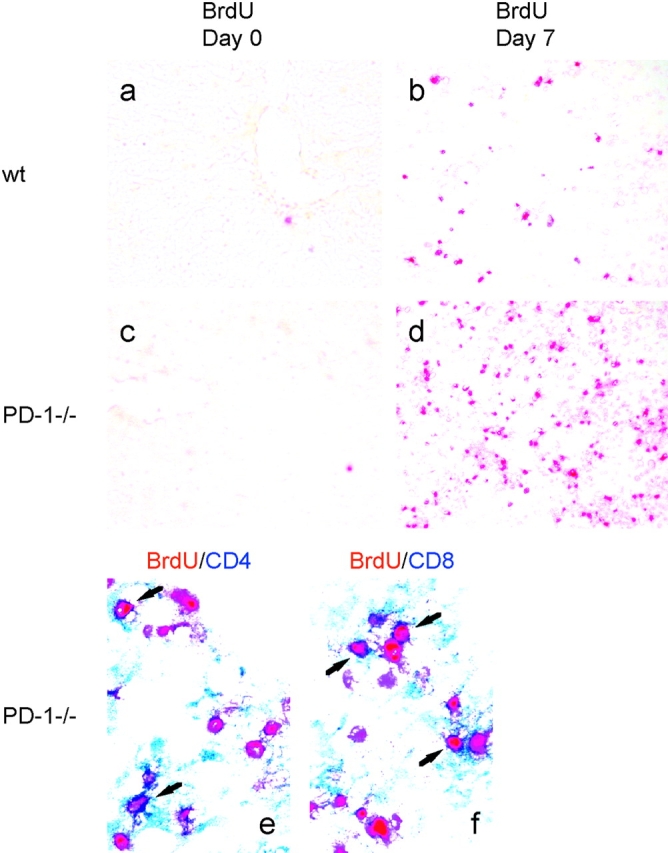
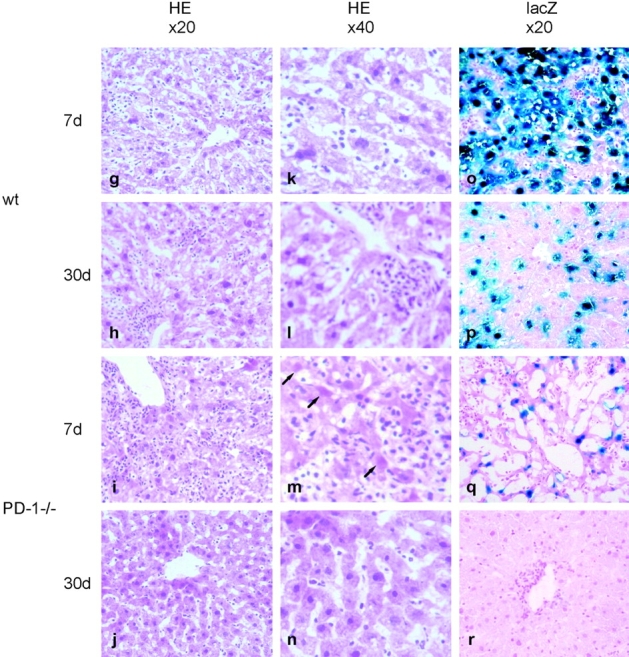
Rapid clearance of adenovirus in the liver of PD-1−/− mice. PD-1−/− or WT mice were intravenously injected with Ad-lacZ. (a–d) At day 0 or day 7 of infection, WT (top) or PD-1−/− mice (bottom) were intraperitoneally injected with BrdU 1 h before killing. Liver sections were stained with anti-BrdU (red). Original magnification, ×20. (e and f) At day 7, liver sections of PD-1−/− mice were doubly stained with anti-BrdU (red), in combination with anti-CD4 (blue, e) or anti-CD8 (blue, f). Original magnification, ×40. (g–r) At day 7 or 30, liver sections of WT mice (top) or PD-1−/− mice (bottom) were analyzed by H&E staining (g–j, ×20; k–n, ×40) and X-Gal staining (×40). The arrows represent apoptotic hepatocytes.
Histologically, adenovirus-infected PD-1−/− mice showed more severe but more transient hepatitis than WT mice (Fig. 7, g–n). At day 7, the liver of PD-1−/− mice revealed more extensive hepatocellular injury and mononuclear cell infiltration in both periportal and centrilobular areas than WT mice (Fig. 7, g and i). The liver of PD-1−/− mice contained a large number of hepatocytes showing the typical features of apoptotic cells: cell shrinkage, intensely acidophilic cytoplasm, or even an absence of nuclei (Fig. 7 m, arrows). However, at day 30, no evidence of hepatitis was found in PD-1−/− mice, while the liver of WT mice still showed mild focal cellular infiltration in sinusoids and periportal areas (Fig. 7, h and j).
To examine the effect of T cell proliferation on adenovirus infection, we analyzed liver sections for lacZ expression (Fig. 7, o–r). At day 7, remarkably rapid clearance of adenovirus was observed in the liver of PD-1−/− mice, whereas strong lacZ expression was sustained in the liver of WT mice. At day 30, the virus was completely cleared from the liver of PD-1−/− mice, while lacZ expression was still detectable in the liver of WT mice. These results demonstrate that the absence of PD-1 signal induces proliferation of effector T cells in inflamed tissues by viral infection, resulting in rapid clearance of the virus.
Discussion
Here we report the following observations: (a) PD-L1 was widely expressed on the vascular endothelium in nonlymphoid tissues; (b) LNPCs that constitutively expressed PD-L1 inhibited proliferation of activated T cells expressing PD-1; (c) the absence of PD-1 signal induced proliferation of effector T cells in the adenovirus-infected liver and resulted in rapid clearance of the virus. These results suggest that PD-L1 expressed on LNPCs may play an important role in tolerance induction in the liver. The liver is constantly exposed to innocuous nonpathogenic antigens that arrive from the circulation via the hepatic artery and from the gastrointestinal tract via the portal vein. The liver, therefore, may have evolved unique regulatory mechanisms to avoid excessive immune responses to these antigens. The PD-1/PD-L1 interaction may be involved in T cell tolerance to harmless dietary antigens and innocuous commensal organisms.
We showed that the PD-L1 protein is abundant in the liver. The liver has been a fascinating organ to transplantation immunologists. Allogenic liver organ transplants can be accepted across MHC barriers (27, 43). Moreover, other organs transplanted with the liver, which would normally be rejected promptly, can also survive for prolonged periods (27). PD-L1 on LNPCs can transduce negative signal to activated T cells and inhibit their proliferation, suggesting that PD-L1 expression on LNPCs may be one of the mechanisms by which the liver preferentially induces peripheral tolerance. Although LSECs can function as APCs, our studies have not specifically addressed the regulatory effect of PD-1/PD-L1 signal in antigen presentation by LSECs. This issue remains to be evaluated.
As PD-L1 is also expressed on vascular endothelium in other peripheral tissues, a similar regulatory system using the PD-1/PD-L1 pathway may exist in other nonlymphoid tissues to maintain peripheral tolerance. ECs play an important role in inflammatory immune responses. In addition to their role in the recruitment of T cells, ECs can also directly regulate T cell activation. Several studies have shown that ECs can induce hypo-responsiveness in T cell activation (44–46). In fact, the location of PD-L1 is well suited for their role in peripheral tolerance. ECs reside at the entrance of the organ where effector T cells migrate into the sites of inflammation. When effector T cells enter the tissues, they first contact with ECs and the interaction between PD-1 on activated T cells and PD-L1 on ECs can suppress T cell proliferation to limit the extent of the immune response at sites of inflammation. Our results showed that murine ECs and LNPCs express PD-L1 but not PD-L2 and that anti-PD-L1 mAb reversed the LNPC inhibitory effect on T cell proliferation, suggesting that PD-L1 may be a major negative regulator in the murine vascular system. However, PD-L2 mRNA expression is relatively high in human tissues and the regulatory role of PD-L2 in human may be more important (18). Although PD-L1 was reported to have a costimulatory activity (17), the PD-1/PD-L1 interaction is inhibitory and PD-L1 may require a separate receptor for its costimulatory activity. The present study showed that proliferation of activated PD-1−/− T cells was almost completely inhibited by the CTLA-4-Ig protein, suggesting that in our system B7s are the major molecules which provide costimulatory signal.
The regulation of immune responses can be achieved not only at the activation phase (in secondary lymphoid organs) but also at the effector phase (in peripheral tissues). The activation requirement of effector T cells differs from naive T cells: effector T cells can be activated by either TCR signal or costimulatory signal alone. Therefore, the absence of costimulatory molecules on nonlymphoid tissue cells cannot explain the mechanism of tolerance induction at the effector phase. Our results suggest that the PD-1/PD-L1 interaction may play a critical role in immunoregulation at the effector phase. In peripheral tissues, the signal between PD-1 on effector T cells and PD-L1 on organ-resident cells such as ECs can inhibit proliferation of effector T cells without suppression of cytokine production. Thus, the PD-1/PD-L1 signal allows effector T cells to accomplish their primary functions, but blocks their proliferation in the periphery to avoid excessive or destructive immune reactions. Our results are consistent with the observation by Harris et al. (47) that effector T cells which migrate into nonlymphoid tissues can produce cytokines but are unable to divide.
Our results that PD-L1 inhibits proliferation of effector T cells but not cytokine production apparently conflict with the observation by Mazanet et al. that PD-L1 negatively regulates cytokine synthesis (40). A possible explanation for these differences may be the phase of immune responses. Although they analyzed the PD-L1 function at the activation phase in their in vitro system where naive T cells and ECs were cocultured in the presence of PHA, we focused on the effector phase in our system where previously activated T cells were cocultured with LNPCs. Their results are consistent with our previous reports that the relative levels of inhibitory and costimulatory signals regulate T cell proliferation and cytokine production at the activation phase (16, 18).
The immunoregulation at the effector phase is important, especially in the case where naive self-reactive T cells might be fortuitously activated by cross-reactivity with viral antigens. The regulation by PD-1 at the effector phase ensures a final safeguard against such autoreactivity in peripheral tissues. On the other hand, CTLA-4 inhibitory signal is more likely to be involved in tolerance induction at the early activation phase and regulates the initiation of autoimmune diseases (48). It is therefore possible that the PD-1 agonists may be effective at the later phase to prevent progression of autoimmune diseases.
Although these safeguards are critical for the avoidance of autoimmunity, they may restrict the ability to induce strong immune responses against infectious agents. Some microorganisms thus escape from surveillance of the host immune system and cause chronic infection. The fact that the absence of PD-1 inhibitory signal can augment antiviral immunity has significant implication for not only understanding of the pathogenic mechanism but also the treatment of persistent infection in the liver. The temporary blockade of the PD-1 pathway may open new therapeutic approaches for chronic viral infections.
Acknowledgments
We thank Dr. N. Minato for helpful discussion. We thank N. Tomikawa for her technical assistance and Y. Shiraki for her secretarial help.
This work was supported by a Center of Excellence grant from the Ministry of Education, Culture, Sports, Science, and Technology of Japan.
Footnotes
Abbreviations used in this paper: CTLA-4, cytotoxic T lymphocyte antigen-4; EC, endothelial cell; LNPC, liver nonparenchymal cell; LSEC, liver sinusoidal endothelial cell.
References
- 1.Lenschow, D.J., T.L. Walunas, and J.A. Bluestone. 1996. CD28/B7 system of T cell costimulation. Annu. Rev. Immunol. 14:233–258. [DOI] [PubMed] [Google Scholar]
- 2.Swain, S.L., M. Croft, C. Dubey, L. Haynes, P. Rogers, X. Zhang, and L.M. Bradley. 1996. From naive to memory T cells. Immunol. Rev. 150:143–167. [DOI] [PubMed] [Google Scholar]
- 3.Dubey, C., M. Croft, and S.L. Swain. 1996. Naive and effector CD4 T cells differ in their requirements for T cell receptor versus costimulatory signals. J. Immunol. 157:3280–3289. [PubMed] [Google Scholar]
- 4.Mullbacher, A., and K. Flynn. 1996. Aspects of cytotoxic T cell memory. Immunol. Rev. 150:113–127. [DOI] [PubMed] [Google Scholar]
- 5.Flynn, K., and A. Mullbacher. 1997. The generation of memory antigen-specific cytotoxic T cell responses by CD28/CD80 interactions in the absence of antigen. Eur. J. Immunol. 27:456–462. [DOI] [PubMed] [Google Scholar]
- 6.Nishimura, H., and T. Honjo. 2001. PD-1: an inhibitory immunoreceptor involved in peripheral tolerance. Trends Immunol. 22:265–268. [DOI] [PubMed] [Google Scholar]
- 7.Ishida, Y., Y. Agata, K. Shibahara, and T. Honjo. 1992. Induced expression of PD-1, a novel member of the immunoglobulin gene superfamily, upon programmed cell death. EMBO J. 11:3887–3895. [DOI] [PMC free article] [PubMed] [Google Scholar]
- 8.Shinohara, T., M. Taniwaki, Y. Ishida, M. Kawaichi, and T. Honjo. 1994. Structure and chromosomal localization of the human PD-1 gene (PDCD1). Genomics. 23:704–706. [DOI] [PubMed] [Google Scholar]
- 9.Agata, Y., A. Kawasaki, H. Nishimura, Y. Ishida, T. Tsubata, H. Yagita, and T. Honjo. 1996. Expression of the PD-1 antigen on the surface of stimulated mouse T and B lymphocytes. Int. Immunol. 8:765–772. [DOI] [PubMed] [Google Scholar]
- 10.Iwai, Y., T. Okazaki, H. Nishimura, A. Kawasaki, H. Yagita, and T. Honjo. 2002. Microanatomical localization of PD-1 in human tonsils. Immunol. Lett. 83:215–220. [DOI] [PubMed] [Google Scholar]
- 11.Shlapatska, L.M., S.V. Mikhalap, A.G. Berdova, O.M. Zelensky, T.J. Yun, K.E. Nichols, E.A. Clark, and S.P. Sidorenko. 2001. CD150 association with either the SH2-containing inositol phosphatase or the SH2-containing protein tyrosine phosphatase is regulated by the adaptor protein SH2D1A. J. Immunol. 166:5480–5487. [DOI] [PubMed] [Google Scholar]
- 12.Okazaki, T., A. Maeda, H. Nishimura, T. Kurosaki, and T. Honjo. 2001. PD-1 immunoreceptor inhibits B cell receptor-mediated signaling by recruiting src homology 2-domain-containing tyrosine phosphatase 2 to phosphotyrosine. Proc. Natl. Acad. Sci. USA. 98:13866–13871. [DOI] [PMC free article] [PubMed] [Google Scholar]
- 13.Nishimura, H., T. Honjo, and N. Minato. 2000. Facilitation of beta selection and modification of positive selection in the thymus of PD-1-deficient mice. J. Exp. Med. 191:891–898. [DOI] [PMC free article] [PubMed] [Google Scholar]
- 14.Nishimura, H., M. Nose, H. Hiai, N. Minato, and T. Honjo. 1999. Development of lupus-like autoimmune diseases by disruption of the PD-1 gene encoding an ITIM motif-carrying immunoreceptor. Immunity. 11:141–151. [DOI] [PubMed] [Google Scholar]
- 15.Nishimura, H., T. Okazaki, Y. Tanaka, K. Nakatani, M. Hara, A. Matsumori, S. Sasayama, A. Mizoguchi, H. Hiai, N. Minato, and T. Honjo. 2001. Autoimmune dilated cardiomyopathy in PD-1 receptor-deficient mice. Science. 291:319–322. [DOI] [PubMed] [Google Scholar]
- 16.Freeman, G.J., A.J. Long, Y. Iwai, K. Bourque, T. Chernova, H. Nishimura, L.J. Fitz, N. Malenkovich, T. Okazaki, M.C. Byrne, et al. 2000. Engagement of the PD-1 immunoinhibitory receptor by a novel B7 family member leads to negative regulation of lymphocyte activation. J. Exp. Med. 192:1027–1034. [DOI] [PMC free article] [PubMed] [Google Scholar]
- 17.Dong, H., G. Zhu, K. Tamada, and L. Chen. 1999. B7-H1, a third member of the B7 family, co-stimulates T-cell proliferation and interleukin-10 secretion. Nat. Med. 5:1365–1369. [DOI] [PubMed] [Google Scholar]
- 18.Latchman, Y., C.R. Wood, T. Chernova, D. Chaudhary, M. Borde, I. Chernova, Y. Iwai, A.J. Long, J.A. Brown, R. Nunes, et al. 2001. PD-L2 is a second ligand for PD-1 and inhibits T cell activation. Nat. Immunol. 2:261–268. [DOI] [PubMed] [Google Scholar]
- 19.Tseng, S.Y., M. Otsuji, K. Gorski, X. Huang, J.E. Slansky, S.I. Pai, A. Shalabi, T. Shin, D.M. Pardoll, and H. Tsuchiya. 2001. B7-DC, a new dendritic cell molecule with potent costimulatory properties for T cells. J. Exp. Med. 193:839–846. [DOI] [PMC free article] [PubMed] [Google Scholar]
- 20.Eppihimer, M.J., J. Gunn, G.J. Freeman, E.A. Greenfield, T. Chernova, J. Erickson, and J.P. Leonard. 2002. Expression and regulation of the PD-L1 immunoinhibitory molecule on microvascular endothelial cells. Microcirculation. 9:133–145. [DOI] [PMC free article] [PubMed] [Google Scholar]
- 21.Ozkaynak, E., L. Wang, A. Goodearl, K. McDonald, S. Qin, T. O'Keefe, T. Duong, T. Smith, J.C. Gutierrez-Ramos, J.B. Rottman, et al. 2002. Programmed death-1 targeting can promote allograft survival. J. Immunol. 169:6546–6553. [DOI] [PubMed] [Google Scholar]
- 22.Ishida, M., Y. Iwai, Y. Tanaka, T. Okazaki, G. Freeman, N. Minato, and T. Honjo. 2002. Differential expression of PD-L1 and PD-L2, ligands for an inhibitory receptor PD-1, in the cells of lymphohematopoietic tissues. Immunol. Lett. 84:57–62. [DOI] [PubMed] [Google Scholar]
- 23.Yamazaki, T., H. Akiba, H. Iwai, H. Matsuda, M. Aoki, Y. Tanno, T. Shin, H. Tsuchiya, D.M. Pardoll, K. Okumura, et al. 2002. Expression of programmed death 1 ligands by murine T cells and APC. J. Immunol. 169:5538–5545. [DOI] [PubMed] [Google Scholar]
- 24.Freeman, G.J., G.S. Gray, C.D. Gimmi, D.B. Lombard, L.J. Zhou, M. White, J.D. Fingeroth, J.G. Gribben, and L.M. Nadler. 1991. Structure, expression, and T cell costimulatory activity of the murine homologue of the human B lymphocyte activation antigen B7. J. Exp. Med. 174:625–631. [DOI] [PMC free article] [PubMed] [Google Scholar]
- 25.Knolle, P.A., and G. Gerken. 2000. Local control of the immune response in the liver. Immunol. Rev. 174:21–34. [DOI] [PubMed] [Google Scholar]
- 26.Knolle, P.A., and A. Limmer. 2001. Neighborhood politics: the immunoregulatory function of organ-resident liver endothelial cells. Trends Immunol. 22:432–437. [DOI] [PubMed] [Google Scholar]
- 27.Calne, R.Y., R.A. Sells, J.R. Pena, D.R. Davis, P.R. Millard, B.M. Herbertson, R.M. Binns, and D.A. Davies. 1969. Induction of immunological tolerance by porcine liver allografts. Nature. 223:472–476. [DOI] [PubMed] [Google Scholar]
- 28.Cantor, H.M., and A.E. Dumont. 1967. Hepatic suppression of sensitization to antigen absorbed into the portal system. Nature. 215:744–745. [DOI] [PubMed] [Google Scholar]
- 29.Limmer, A., J. Ohl, C. Kurts, H.G. Ljunggren, Y. Reiss, M. Groettrup, F. Momburg, B. Arnold, and P.A. Knolle. 2000. Efficient presentation of exogenous antigen by liver endothelial cells to CD8+ T cells results in antigen-specific T-cell tolerance. Nat. Med. 6:1348–1354. [DOI] [PubMed] [Google Scholar]
- 30.Rubinstein, D., A.K. Roska, and P.E. Lipsky. 1986. Liver sinusoidal lining cells express class II major histocompatibility antigens but are poor stimulators of fresh allogeneic T lymphocytes. J. Immunol. 137:1803–1810. [PubMed] [Google Scholar]
- 31.Lohse, A.W., P.A. Knolle, K. Bilo, A. Uhrig, C. Waldmann, M. Ibe, E. Schmitt, G. Gerken, and K.H. Meyer Zum Buschenfelde. 1996. Antigen-presenting function and B7 expression of murine sinusoidal endothelial cells and Kupffer cells. Gastroenterology. 110:1175–1181. [DOI] [PubMed] [Google Scholar]
- 32.Chen, Y., G.J. McKenna, C. Ong, A.L. Mui, and S.W. Chung. 2002. Liver nonparenchymal cells involved in hyporesponsiveness induced by portal vein injection of alloantigen. Immunol. Lett. 81:1–11. [DOI] [PubMed] [Google Scholar]
- 33.Nishimura, H., N. Minato, T. Nakano, and T. Honjo. 1998. Immunological studies on PD-1 deficient mice: implication of PD-1 as a negative regulator for B cell responses. Int. Immunol. 10:1563–1572. [DOI] [PubMed] [Google Scholar]
- 34.Kanegae, Y., G. Lee, Y. Sato, M. Tanaka, M. Nakai, T. Sakaki, S. Sugano, and I. Saito. 1995. Efficient gene activation in mammalian cells by using recombinant adenovirus expressing site-specific Cre recombinase. Nucleic Acids Res. 23:3816–3821. [DOI] [PMC free article] [PubMed] [Google Scholar]
- 35.Marelli-Berg, F.M., E. Peek, E.A. Lidington, H.J. Stauss, and R.I. Lechler. 2000. Isolation of endothelial cells from murine tissue. J. Immunol. Methods. 244:205–215. [DOI] [PubMed] [Google Scholar]
- 36.Knook, D.L., and E.C. Sleyster. 1976. Separation of Kupffer and endothelial cells of the rat liver by centrifugal elutriation. Exp. Cell Res. 99:444–449. [DOI] [PubMed] [Google Scholar]
- 37.Watanabe, H., K. Ohtsuka, M. Kimura, Y. Ikarashi, K. Ohmori, A. Kusumi, T. Ohteki, S. Seki, and T. Abo. 1992. Details of an isolation method for hepatic lymphocytes in mice. J. Immunol. Methods. 146:145–154. [DOI] [PubMed] [Google Scholar]
- 38.Carayon, P., and A. Bord. 1992. Identification of DNA-replicating lymphocyte subsets using a new method to label the bromo-deoxyuridine incorporated into the DNA. J. Immunol. Methods. 147:225–230. [DOI] [PubMed] [Google Scholar]
- 39.Yoneyama, H., S. Narumi, Y. Zhang, M. Murai, M. Baggiolini, A. Lanzavecchia, T. Ichida, H. Asakura, and K. Matsushima. 2002. Pivotal role of dendritic cell-derived CXCL10 in the retention of T helper cell 1 lymphocytes in secondary lymph nodes. J. Exp. Med. 195:1257–1266. [DOI] [PMC free article] [PubMed] [Google Scholar]
- 40.Mazanet, M.M., and C.C. Hughes. 2002. B7-h1 is expressed by human endothelial cells and suppresses T cell cytokine synthesis. J. Immunol. 169:3581–3588. [DOI] [PubMed] [Google Scholar]
- 41.Salomon, B., and J.A. Bluestone. 2001. Complexities of CD28/B7: CTLA-4 costimulatory pathways in autoimmunity and transplantation. Annu. Rev. Immunol. 19:225–252. [DOI] [PubMed] [Google Scholar]
- 42.Rulifson, I.C., A.I. Sperling, P.E. Fields, F.W. Fitch, and J.A. Bluestone. 1997. CD28 costimulation promotes the production of Th2 cytokines. J. Immunol. 158:658–665. [PubMed] [Google Scholar]
- 43.Kamada, N., G. Brons, and H.S. Davies. 1980. Fully allogeneic liver grafting in rats induces a state of systemic nonreactivity to donor transplantation antigens. Transplantation. 29:429–431. [DOI] [PubMed] [Google Scholar]
- 44.Kawashima, H., and D.S. Gregerson. 1994. Corneal endothelial cells block T cell proliferation, but not T cell activation or responsiveness to exogenous IL-2. Curr. Eye Res. 13:575–585. [DOI] [PubMed] [Google Scholar]
- 45.Kawashima, H., S.A. Prasad, and D.S. Gregerson. 1994. Corneal endothelial cells inhibit T cell proliferation by blocking IL-2 production. J. Immunol. 153:1982–1989. [PubMed] [Google Scholar]
- 46.Marelli-Berg, F.M., D. Scott, I. Bartok, E. Peek, J. Dyson, and R.I. Lechler. 2000. Activated murine endothelial cells have reduced immunogenicity for CD8+ T cells: a mechanism of immunoregulation? J. Immunol. 165:4182–4189. [DOI] [PubMed] [Google Scholar]
- 47.Harris, N.L., V. Watt, F. Ronchese, and G. Le Gros. 2002. Differential T cell function and fate in lymph node and nonlymphoid tissues. J. Exp. Med. 195:317–326. [DOI] [PMC free article] [PubMed] [Google Scholar]
- 48.Luhder, F., P. Hoglund, J.P. Allison, C. Benoist, and D. Mathis. 1998. Cytotoxic T lymphocyte-associated antigen 4 (CTLA-4) regulates the unfolding of autoimmune diabetes. J. Exp. Med. 187:427–432. [DOI] [PMC free article] [PubMed] [Google Scholar]


