

Abstract
The airway mucosal response to allergen in asthma involves influx of activated T helper type 2 cells and eosinophils, transient airflow obstruction, and airways hyperresponsiveness (AHR). The mechanism(s) underlying transient T cell activation during this inflammatory response is unclear. We present evidence that this response is regulated via bidirectional interactions between airway mucosal dendritic cells (AMDC) and T memory cells. After aerosol challenge, resident AMDC acquire antigen and rapidly mature into potent antigen-presenting cells (APCs) after cognate interactions with T memory cells. This process is restricted to dendritic cells (DCs) in the mucosae of the conducting airways, and is not seen in peripheral lung. Within 24 h, antigen-bearing mature DCs disappear from the airway wall, leaving in their wake activated interleukin 2R+ T cells and AHR. Antigen-bearing activated DCs appear in regional lymph nodes at 24 h, suggesting onward migration from the airway. Transient up-regulation of CD86 on AMDC accompanies this process, which can be reproduced by coculture of resting AMDC with T memory cells plus antigen. The APC activity of AMDC can be partially inhibited by anti-CD86, suggesting that CD86 may play an active role in this process and/or is a surrogate for other relevant costimulators. These findings provide a plausible model for local T cell activation at the lesional site in asthma, and for the transient nature of this inflammatory response.
Keywords: dendritic cells, asthma, respiratory mucosa, T cells, activation
Introduction
Airflow obstruction during asthma exacerbations is held to be the result of chronic inflammatory changes in the mucosal tissues of the conducting airways, leading to structural alterations, in particular airway wall thickening (1, 2). Although the remodelling in the small airways makes the largest contribution to airflow obstruction during asthma attacks, it is clear that the remodelling and associated inflammation occurs throughout the small and large conducting airways (2, 3), whereas parenchymal lung tissues display minimal involvement.
A variety of evidence implicates the products of activated T cells as trigger factors in this process (4, 5). However it is not known whether activation occurs locally at site(s) of deposition of inhaled allergen in the respiratory tree, or at distal locations such as regional lymph nodes (RLN),*with ensuing homing of postactivated T cells back to sites of challenge. The resolution of this question is central to the development of more effective antiinflammatory drugs for asthma control.
A key issue in this regard concerns the functional phenotype of local APC populations within the airway mucosae. This tissue compartment represents an anatomically and functionally distinct entity within the respiratory tree, being part of the common mucosal immune system (6) and hence part of the circuit through which mucosal-homing T cells selectively recirculate. The resident APCs in this compartment comprise dense populations of DCs distributed in networks analogous to the epidermis (7, 8). In resting airway mucosa they exhibit a uniquely rapid turnover (9), providing efficient local immune surveillance of antigens impacting on the conducting airway surface. Paradoxically, they exhibit the “immature” DC phenotype, and can readily acquire inhaled allergen, but lack capacity for effective presentation to T cells (10, 11). There is thus no plausible mechanism for delivery of the allergen-specific signals that initiate local T cell activation in the airway mucosa in atopic asthma, and the resolution of this issue represented the aim of this study.
Previous studies on the role of respiratory tract DCs in control of T cell activation in experimental asthma have focused principally upon populations that are readily accessible by bronchoalveolar lavage (BAL), or the large DC population harvested from enzymatically disrupted whole lungs (12, 13), the latter being dominated by nonmucosal DCs from parenchymal lung. This study is the first to focus on the role of DCs from isolated conducting airways in experimental asthma, and we demonstrate a sequence of phenotypic and functional changes in these airway DCs after aeroallergen challenge that are unique to this tissue compartment and not reflected in DC populations from the peripheral lung in the same animals.
Materials and Methods
Animals and Allergen Exposures.
Inbred PVG rats were bred and maintained free of pathogens. Randomly selected animals of both sexes aged 8–13 wk were used. Presensitization of animals to OVA was achieved by intraperitoneal immunization with OVA in aluminum hydroxide (OVA/ALOH), which elicits Th2-polarized responses characterized by IgE antibody production, or OVA in complete Freund's adjuvant, which elicits Th1 immunity involving only IgG antibody production, using standard methods (10, 14, 15). The animals were used for aerosol challenge experiments 14–21 d later. Aerosol challenge was performed over a 1-h period as per earlier publications (15, 16).
Media and Reagents.
The tissue culture medium and isolation reagents used are as previously described (11). Details of mAbs and immunostaining reagents are as previously reported (8, 11, 16). OVA, mepyramine, and methysergide were from Sigma-Aldrich. FITC-conjugated dextran (Mr = 40 kD) for endocytosis and tracking experiments was purchased from Molecular Probes.
Cell Preparation and Culture.
Collagenase A digests of lung and trachea were prepared by standard methods and depleted of macrophages and B cells as previously described (11, 16). Dispase was added at a final concentration of 1.25 mg/ml. Peripheral segments of lung were dissected free of hilar tissue before digestion to minimize contamination with conducting airway mucosal cells. DCs were purified by dual parameter cell sorting (11). This procedure yields cell populations in which macrophages and B cells are essentially undetectable and CD3+ T cells and cytokeratin-positive epithelial cells are ≤3%, the dominant population being ≥95% MHC class II moderate-high putative DCs (see Fig. S1, available at http://www.jem.org/cgi/content/full/jem.20021328/DC1). In some experiments, CD4+ T cells were also purified from lymphoid organs using comparable methodology. DC/T cell coculture experiments used previously described methodology (10, 11). Presentation of OVA by DCs from trachea or lymph nodes of OVA aerosol–exposed animals used standard tissue culture techniques reported previously (11, 16). The generation of the OVA-responsive CD4+ T cell lines was performed according to a previously described protocol (17).
Quantitative and Qualitative Analyses of Cell Populations.
The methodology for immunohistochemical analysis and quantitation of cell types in tangential frozen sections of airway mucosal tissues is as previously described (7, 8, 11) and DC designation is based on MHC class II expression plus dendritiform morphology, in the absence of expression of T cell, B cell, or macrophage markers or intracellular endogenous peroxidase, which marks both macrophages and eosinophils in rat. Flow cytometric methodology for DC phenotyping, including details of mAbs and isotype controls, and analyses of endocytosis of FITC dextran are as previously described (11).
For confocal microscopy studies using whole mounts (see Fig. 1), rat tracheas were stored in 100% ethanol at 4°C overnight, and thereafter washed for 5 h in PBS at room temperature. The samples were incubated with a mixture of mAb Ox6 anti–rat MHC class II or Ox21 isotype control (neat culture supernatant) and rabbit antiserum to rat laminin (1/100; DakoCytomation) for 40 h, washed for 5 h, and then incubated with 0.8 μg/ml Cy3-labeled goat anti–mouse IgG (Jackson ImmunoResearch Laboratories) in combination with Cy5-labeled goat anti–rabbit IgG (1/200; Amersham Biosciences) for 24 h. The specimens were washed for 5 h and mounted in plastic slides. Fluorescent images of the immunostained whole mount preparations were obtained with a confocal laser scanning microscope (MRC-1000; Bio-Rad Laboratories). The preparations were optically sectioned by scanning at increasing focus depths (typically in steps of 1 μm) from the surface epithelial side. Identical series of optical images at increasing depths (image stacks) from one field were obtained for each wavelength. These image stacks were then merged and the three dimensional information (xyz axis) obtained were analyzed with Object-Image 2.08 software (an extended version of NIH image).
Figure 1.

In situ analysis of respiratory tract cell populations. (A–C) Tracheal epithelium stained for MHC class II. Sections were taken at (A) 0, (B) 2, and (C) 24 h after OVA aerosol challenge of primed animals. Images are projections along the z axis (“top” view) from stacks of 30 optical sections acquired at 2-μm increments at ×100 magnification. (D) Tracheal sections from primed OVA/ALOH animals after OVA aerosol exposure, stained for eosinophils, T cells, and DCs. Cells were quantitated by light (Epithelial DC, T-cells, Eos) confocal microscopy (Submucosal DC). Data are mean ± SD from three to five observations for each cell type. (E) Lung tissue was isolated at the indicated time points after challenge and single cell suspensions were prepared and immunostained. DCs were enumerated by flow cytometry and results were expressed as numbers recovered per gram wet weight (mean ± SD from three experiments).
For confocal microscopy studies using 10-μm frozen tracheal sections, postfixed samples were first incubated for 1 h with mAb R73 (IgG1) anti–rat TcRαβ, followed by 0.8 μg/ml Cy3-labeled goat anti–mouse IgG for 30 min. The sections were then incubated for 1 h with biotinylated mAb Ox6 anti–rat MHC class II (to identify DCs) mixed with 10% mouse serum to block nonspecific binding, and finally with Cy2-labeled streptavidin (Amersham Biosciences) for 30 min. Isotype control experiments performed in parallel were always negative. Analysis of resulting images was as described above.
The technique used in studies to track DC migration to RLN was developed independently here and was comparable to that used in recent murine studies (18). In brief, rats were anesthetized, and 100 μl of 10 mg/ml FITC dextran in PBS was administered via intratracheal intubation at a point immediately below the epiglottis. 24 h later parathymic lymph nodes (PTLN) were removed and single cell suspensions were prepared for analyses of FITC staining on MHC class IIhi DCs, identified via PE-conjugated mAb Ox6.
Lung Function and Methacholine (MCh) Hyperresponsiveness.
The techniques used were as previously described (19). In brief, lung function was measured by forced oscillation using a computer-controlled piston ventilator (flexivent®; Scireq), which delivers both tidal ventilation and the complex wave forms (19 components between 0.5 and 20 Hz) used to measure respiratory impedance (Zrs). Airway and lung tissue mechanics are calculated by fitting the constant phase model to Zrs (Zrs = Raw + jωIaw + (G-jH)/ωα, where Raw and Iaw are airway resistance and inertance, respectively, G and H are the coefficients of tissue damping and elastance, respectively, ω is the angular frequency, and α represents the constant phase behavior of G and H). After baseline lung function, MCh challenge was performed by delivering aerosols (2 min) of saline (control) and MCh (0.1, 0.3, 1.0, 3.0, 10.0, and 30.0 mg/ml) during tidal ventilation. Five measurements of Zrs were made after each dose and peak responses were reported.
Online Supplemental Material.
We provide a detailed description of the cytometry raw data from representative experiments that were used to compile the composite figures shown in the main text. These online supplemental figures are available at http://www.jem.org/cgi/content/full/jem.20021328/DC1.
Results
Fig. 1 illustrates quantitative analyses of bone marrow–derived cells in respiratory tract tissues using light and confocal laser microscopy, and flow cytometry. Consistent with earlier findings (8, 14), prominent populations of MHC class II+ DCs were observed in frozen sections within the epithelium and underlying lamina propria of the normal trachea and within the alveolar wall (unpublished data). OVA aerosol challenge of animals primed with OVA/ALOH to elicit Th2-polarized immunity triggered the rapid influx of DCs into the airway wall. Fig. 1, A–C, represents superimposed Z-plane confocal microscopy images providing an overview of the total DC population within the tracheal epithelium and underlying submucosa to a depth of ∼30 microns below the epithelial basement membrane at 0 (Fig. 1 A), 2 (Fig. 1 B), and 24 h (Fig. 1 C) after cessation of OVA exposure. As demonstrated in Fig. 1 D, the bulk of DC recruitment occurs within the first 2 h, and the highest numbers of influxing cells are observed within the submucosa. Parallel infiltration of T cells was also observed (predominantly CD4+; unpublished data), which was accompanied by eosinophils, with peak numbers observed at 24 h. We additionally enumerated DCs in collagenase digests of peripheral lung by flow cytometry (Fig. 1 E) and observed a parallel response in this tissue compartment. It should be noted that the figures shown here are likely to underestimate overall in vivo population sizes due to the loss of some DCs during tissue digestion.
Next, we performed lung function studies as shown in Fig. 2. Exposure of sensitized animals to a single OVA aerosol challenge induced hyperresponsiveness to MCh 24 h later, as demonstrated by the shift in the MCh dose response curve in Fig. 2 A. The technique used (19) provides independent measures of MCh responsiveness in the conducting airways (airway resistance in Fig. 2 A) versus peripheral lung tissues (tissue elastance in Fig. 2 B), and it is noteworthy that the development of MCh hyperresponsiveness was restricted to the airways. These findings, notably antigen aerosol–induced recruitment of T cells and eosinophils into airway tissues and accompanying expression of airways hyperresponsiveness (AHR), are hallmarks of the human asthmatic response to allergen challenge and indicate the general suitability of this system for modeling the human disease.
Figure 2.
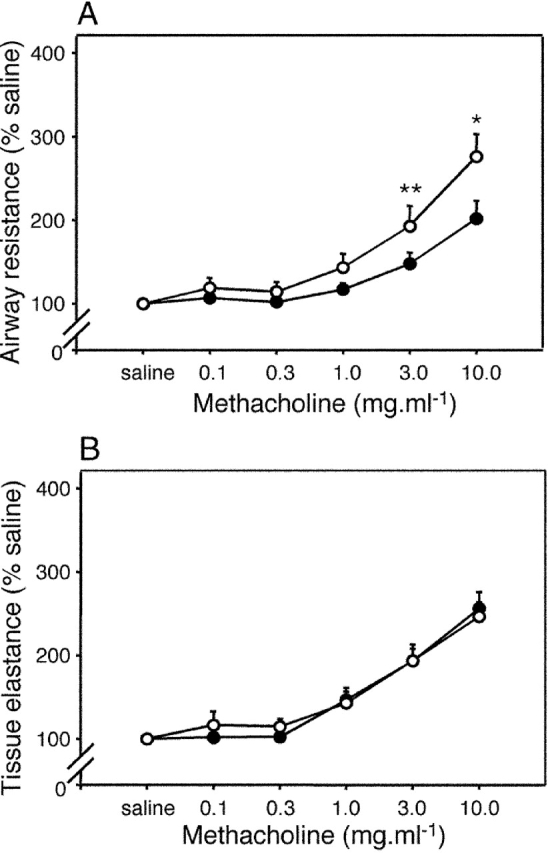
AHR after exposure to aerosolized OVA. Sensitized animals (n = 6 per group; ○) together with naive controls (•) were exposed to aerosolized OVA, and 24 h later MCh challenge was performed. The top shows a left shift in the airway dose response curve to MCh contrasted with no change in parenchymal responsiveness (bottom). Differences between test and control groups in this experiment (and in Figs. 3–6) were analyzed by Student's t test. *, P < 0.01; **, P < 0.05.
In Fig. 3 we sought initial information on the functional phenotype of respiratory tract DCs after aerosol challenge of sensitized rats, using a series of flow cytometric analyses of airway and lung-derived cell populations. The dot plot in Fig. 3 A illustrates the side scatter (SSC) and MHC class II gating strategies used to analyze these DC populations. Fig. 3 B illustrates the changes occurring in surface marker expression within the overall tracheal DC population (R1) over the 24-h period after challenge (see also Figs. S2–S4, available at http://www.jem.org/cgi/content/full/jem.20021328/DC1). All markers appeared stably expressed with the exception of CD86, which demonstrated a prominent but transient increase at 2 h after exposure. This observation suggested that a subset of local DCs may have been undergoing functional maturation in situ. We further tested this possibility by assessing endocytic activity, which is known to markedly decline in DCs undergoing cytokine-driven functional maturation (20). Fig. 3 C illustrates endocytosis within R1 DCs and clearly indicates that transient shutdown of endocytic activity accompanies up-regulation of CD86. It is additionally noteworthy that endocytic activity continues in decline to 24 h, at which time incoming immature DCs represent a prominent component of the overall population. This suggests that immature DCs recruited into airway tissues during acute inflammation may initially be weakly endocytic (i.e., monocyte-like) and may require further differentiation in situ to develop this capacity. In support of this possibility, we have observed that endocytic activity is directly associated with SSC and MHC class II expression within the resting tracheal DC population (unpublished data).
Figure 3.
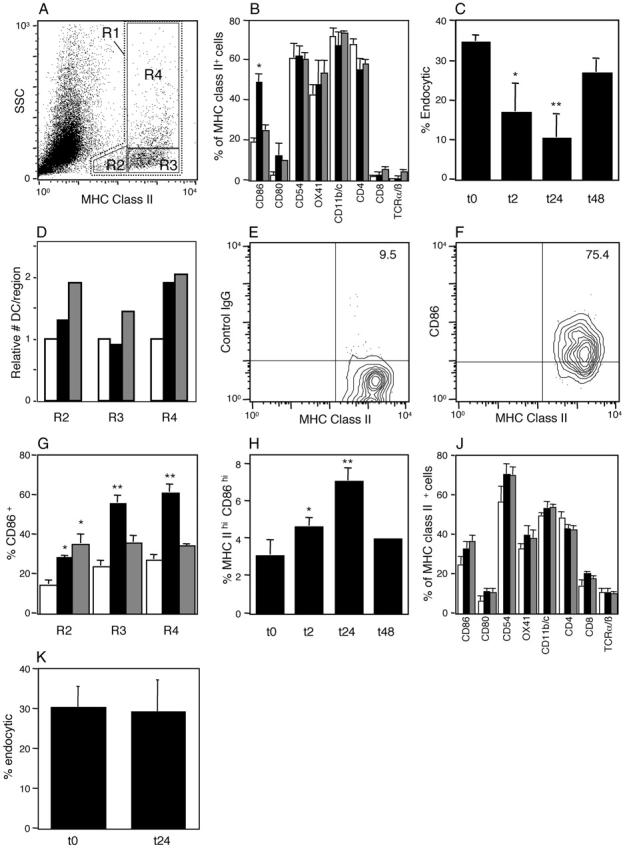
Flow cytometric analysis of DCs after OVA aerosol challenge of OVA-primed animals. Data are representative of a series (A, E, and F) or mean ± SE from three to five experiments. (A) Flow cytometric analysis of total tracheal digest cells indicating gating for total DCs (R1) and subregions (R2–R4), based on SSC and MHC class II expression profiles. (B) Surface marker expression (after correction for background staining with isotype control) in total MHC class II+ DC populations (R1) in the trachea at 0 (open bars), 2 (solid bars), and 24 h (hatched bars) after challenge (*, P < 0.01 compared with 0 and 24 h). (C) Endocytic activity of R1 tracheal DCs at 2, 24, and 48 h after challenge as determined by 10-min dextran FITC uptake with trypan blue quenching at 37°C minus uptake at 4°C. Activity was significantly reduced relative to unexposed animals (0 h). *, P < 0.04; **, P < 0.01. (D) Relative numeric changes in tracheal DCs within each gating region at 2 (solid bars) and 24 h (hatched bars) after challenge compared with control immunized, nonaerosol challenged animals (open bars). (E and F) Expression of CD86 and MHC class II by R4 tracheal DCs at 2 h after challenge. Nonspecific binding of isotype control (E) versus staining with anti-CD86 on the MHC class IIhi subset. (G) Changes in CD86 expression on tracheal DCs in subregions R2–R4 as designated in A and D. Significance of increase relative to 0 h. *, P < 0.01; **, P < 0.001. (H) Flow cytometry analysis of DCs in PTLN after aerosol challenge of sensitized animals. The gating strategy comprised initial selection of total DCs (as per R1 in A), followed sequentially by gating for high MHC class II and low isotype control binding, and the same gates applied directly to obtain percentage of CD86 expression (see Fig. S5, available at http://www.jem.org/cgi/content/full.jem.20021328/DC1). MHC class IIhi CD86hi DCs are shown as percentage of total DCs at 0 h compared with animals at 2, 24, and 48 h after challenge. >0 h: *, P < 0.01; **, P < 0.001. (J) Surface marker expressions by R1 DCs in the parenchymal lung at 0 (open bars), 2 (solid bars), and 24 h (hatched bars) after challenge. (K) Endocytic activity of R1 parenchymal lung DCs at 24 h after challenge compared to unexposed animals (t0), determined as per C.
In Fig. 3 D further analyses were performed involving segregation of the overall R1 DC population into three distinct subregions based on variable expression of MHC class II and SSC (Fig. 3 A, R2–R4). R2 defines the population of cells low in both SSC and MHC class II expression, which are likely to include the recently arrived small immature DCs (15% of resident DCs in normal resting trachea). R3 DC are also SSC low but are MHC class II high (66% of resident DCs), whereas the remainder (R4: 19%) are SSC high/MHC class II high, characteristics of mature (activated) DCs. Increases in numbers occurred within all three regions during the 24-h period after challenge, the most rapid and pronounced change being observed in R4 at 2 h.
Further examination of CD86 staining on tracheal DCs indicated that expression was most prominent amongst the DC subpopulation expressing the highest levels of MHC class II (Fig. S4, available at http://www.jem.org/cgi/content/full/jem.20021328/DC1). This is illustrated in Fig. 3, E and F, which focuses on R4 DCs and demonstrates that after correction for background staining with isotype control (Fig. 3 E), 66% of the MHC class IIhi DCs express CD86 (Fig. 3 F). It should be noted that the up-regulation of CD86 expression observed here relates to an increase in the number of cells in the positive gate. The mean intensity of expression of CD86 amongst the positive population at 2 h did not significantly increase, relative to that of the smaller number of CD86+ tracheal DCs present at 0 h.
Fig. 3 G illustrates changes in CD86 expression on MHC class II+ tracheal DCs. A distinct hierarchy is evident with the greatest increases occurring in R3 and R4 at 2 h with levels returning close to baseline by 24 h, whereas the increases in R2 are maintained. Fig. 3, D and G, collectively suggest that the DC population exhibiting the most rapid up-regulation of CD86 expression is predominantly derived from medium to large resident DCs present at the time of challenge, rather than from the smaller incoming precursors.
In Fig. 3 H we examined accompanying changes in DCs in the draining (parathymic) RLN, focusing upon “mature” DCs gated on the basis of high MHC class II expression together with minimal binding of isotype control. The same gates were applied directly for all other relevant analyses (Fig. S5, available at http://www.jem.org/cgi/content/full/jem.20021328/DC1). In resting RLN, MHC class IIhi and CD86hi cells comprise 3.2% of the overall MHC class II+ DC population (Fig. 3 H). DCs with comparable MHC class II expression characteristics have recently been implicated in translocation of antigen (FITC dextran) from the tracheal surface to RLN in unstimulated mice (18). Using comparable methodology we have observed that a high proportion of cells (40.2 ± 8.3%; n = 3) in the MHC class IIhi gate in PTLN from unstimulated rats (compared with <3% of their MHC class IIlo counterparts) are FITC positive within 24 h of administration of FITC dextran onto the tracheal surface, which is consistent with findings in the mouse. We additionally observed that cells with characteristic MHC class IIhi and CD86hi expression increase progressively in the PTLN of OVA-sensitized animals over the 24-h period after challenge, peaking at 7.1% of the overall MHC class II+ DC population by 24 h before returning to baseline at 48 h (Fig. 3 H). In contrast, analyses of control lymph nodes draining other sites (superficial cervical lymph nodes) at the peak of the PTLN response demonstrated no comparable up-regulation of CD86 expression (unpublished data).
Next, we extended analyses to peripheral lung DCs in the same animals. The immunostaining profiles of these DCs (Fig. 3 J) differed in several respects from their airway-derived counterparts, notably with higher resting levels of CD8 and lower CD4 and CD11b/c, but expression of these markers and more importantly CD86, did not change during the 24-h period after challenge (see also Figs. S6 and S7, available at http://www.jem.org/cgi/content/full/jem.20021328/CD1). Additionally, there was no evidence of changes in endocytic function in peripheral lung DCs at 24 h (Fig. 3 K).
In Fig. 4 we addressed the central issue of the APC function of these DCs, in particular the presentation of OVA acquired in vivo during aerosol challenge. In these experiments DCs were sorted to >95% purity from tracheas and PTLN of OVA-immune and naive rats before and after OVA aerosol exposure, and cocultured with OVA-responsive CD4+ T cells. The resultant T cell activation was measured as 3H-DNA synthesis. Consistent with previous findings (10), DCs from OVA aerosol–exposed naive rats induced minimal OVA-specific T cell proliferation. However, in OVA-sensitized animals, OVA-bearing DCs expressing mature APC activity were observed in the tracheal mucosa 2 h after OVA exposure (Fig. 4 A). These cells were no longer present in the mucosa at 24 h (Fig. 4 A), but MHC class IIhi DCs with correspondingly high levels of OVA-specific APC activity now appeared de novo in the draining PTLN (Fig. 4 B). Taken together with earlier observations of migration of antigen-bearing DCs to thoracic lymph nodes in rats (12) and mice (18) after airway challenge via intratracheal instillation, and the demonstration above of the sequential appearance of MHC class IIhi CD86hi DCs in the airway mucosa and subsequently the PTLN, these findings are consistent with onward migration of OVA-presenting DCs from the site of antigen deposition in the airway to the draining lymph node. Although it is likely that such migrating DCs might be responsible for the transient peak of OVA-specific APC activity observed in the PTLN (Fig. 4 B), the possibility that airway-derived DCs may pass on antigen to their lymph node counterparts (which in turn become activated) cannot be excluded. In the experiments shown in Fig. 4 C we demonstrate that the in vitro APC activity of the airway DCs sampled at 2 h after OVA exposure can be partially blocked by mAb against the costimulator CD86. The efficiency of this blockade ranged from 25 to 55%.
Figure 4.
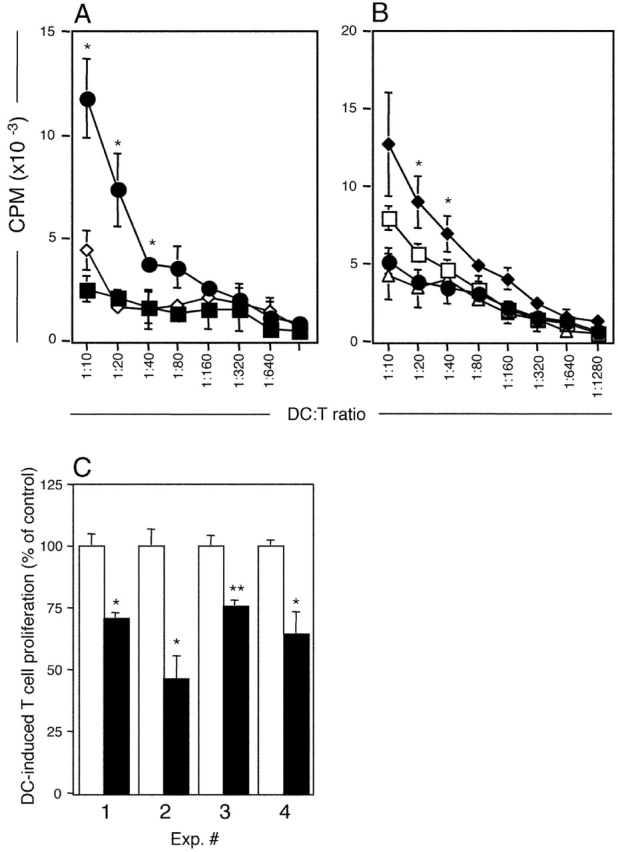
Antigen presentation by purified airway and lymph node DCs. Purified DCs from challenged animals were used to stimulate a CD4+ OVA-specific T cell line for 48 h. T cell stimulation (3H-DNA synthesis as CPM/culture) is shown as mean ± SE from three or more experiments (A and B) or from individual experiments (C). (A) OVA presentation by tracheal DCs isolated from OVA-immune animals 2 (•) and 24 h (▪) after challenge, or from naive animals 2 h (⋄) after challenge. 2 h > 0 h and 24 h: *, P < 0.05–0.01. (B) Total PTLN DCs were purified at 2 (•) or 24 h (□) after OVA aerosol challenge and additionally, sorted into MHC class IIhi (♦) or MHC class IIlow (▵) expressing cells (as per Fig. 3) at the 24-h time point. OVA presentation by PTLN DCs is maximal at 24 h after aerosol challenge and was restricted to the MHC class IIhi population of DCs. (C) Tracheal DCs isolated 2 h after challenge were used to stimulate OVA-specific T cells in the absence (□) or presence (▪) of blocking antibody to CD86. In experiments 3 and 4, control cultures contained isotype control mAb versus medium only in control cultures in experiments 1 and 2. Data are normalized against the OVA-specific T cell response (3H-DNA synthesis at 72 h) in the absence of blocking antibody. <control: *, P < 0.05; **, P < 0.01.
Next, we sought to further elucidate the mechanisms underlying T cell–induced DC maturation. The upper panels of Fig. 5 A show DC–T cell interactions in situ in the airway mucosa from an OVA-challenged rat, using confocal microscopy. Fig. 5, A–C, displays optical sections one micron apart, illustrating clustering between DCs (green) and T cells (red; contact regions are yellow). In Fig. 5 D, we scored individual T cells in randomly selected sections at each time point for contact with DCs, clearly demonstrating the continuous high level of interaction between resident DCs and transiting T cells in the resting state, which increases further after challenge. The relative number of clustered T cells was also determined by factoring in information (refer to Fig. 1) on the total number of T cells present at each time point, and it is evident that a progressive increase occurs over the 24 h after allergen challenge. We obtained comparable findings for clustering of CD2+ T cells with DCs (Fig. S8, available at http://www.jem.org/cgi/content/full/jem.20021328/DC1). We sought evidence that these DC–T cell interactions were associated with T cell activation. Analyses of IL-2R expression on isolated airway T cells from challenged animals indicated a marked increase at 24 h (Fig. 5 E). Next, we examined the potential mechanism of CD86 up-regulation by coculture of resting airway DCs with CD4+ T cells from naive or OVA-primed animals, plus soluble OVA, for 3 h, corresponding to 1 h of aerosol exposure plus 2 h of rest before sampling, as used above (Fig. 5 F). The results indicate that CD86 up-regulation required the presence of antigen-specific T memory cells plus antigen. We additionally observed up-regulation of MHC class II expression on these DCs (Fig. S9, available at http://www.jem.org/cgi/content/full/jem.20021328/DC1).
Figure 5.
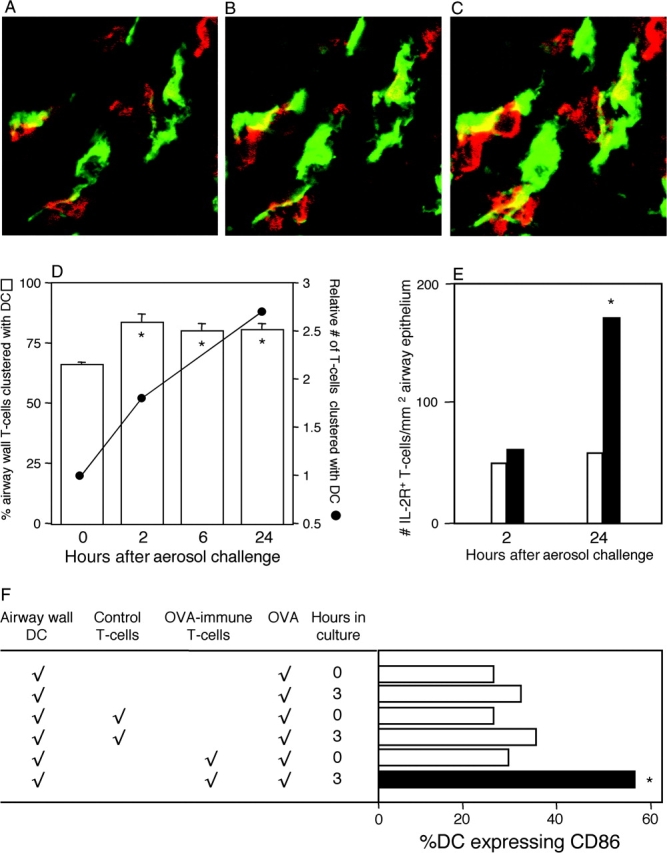
DC–T cell interactions in airway mucosa. (A–C) Confocal microscopy of tracheal sections 2 h after challenge of OVA-immune rats stained for MHC II (green, DCs) and TcRαβ (red, T cells). Dual staining contact points appear yellow. Each panel in the series represents a 1-μm optical section shown in ascending order, where individual DCs can be seen interacting with ≥1 T cells. (D) Individual T cells (n = 50–100) were scored for direct contact with DCs, and numbers in contact were expressed as a percentage of total T cells. Relative numbers of T cells at each time point were determined by factoring in data on absolute cell numbers per unit area of tissue from Fig. 1 D. *, P < 0.05 relative to 0 h, based on mean data from five experiments. (E) IL-2R+ T cells were initially enumerated as a percentage of total T cells by flow cytometric analysis of tracheal digests from exposed (solid bars) or control (open bars) animals in five experiments, and finally expressed as numbers of IL-2R+ T cells per unit area of epithelium by reference to data in Fig. 1 D, yielding five data points for each group at each time point. Data analysis used means derived from these data points. 24 h > 2 h in OVA-exposed animals: *, P < 0.05. (F) Tracheal DCs from naive animals were cultured alone or in the presence of either control or OVA-immune T cells at a density of 20:1 (T cell/DC). After the addition of 50 μg/ml soluble OVA, CD86 expression was examined (as in Fig. 3) at 0 and 3 or 4 h (data shown are for 3 h and are representative of a series of five experiments). Test culture (solid bar) > controls (open bars). *, P < 0.02 based on comparisons of means derived from five data points for each manipulation. Raw data from an exemplary experiment are illustrated in Fig. S9, available at http://www.jem.org/cgi/content/full.jem.20021328/DC1.
In view of recent findings of histamine-mediated CD86 up-regulation on human monocyte–derived DCs (21), we attempted to abrogate antigen-induced up-regulation of CD86 on airway DCs by pretreatment of animals with the H-1 receptor antagonist mepyramine in combination with the 5-HT receptor antagonist methysergide (22), and also attempted to reproduce the in vitro up-regulation shown in Fig. 5 F with 10−5 M histamine, but without success (unpublished data). Additionally, we transferred OVA-specific IgE-containing serum to naive animals before OVA exposure, but no CD86 up-regulation on airway DCs was observed in recipients (unpublished data).
Finally, we questioned whether these effects were restricted to animals primed for Th2 responses by repeating the OVA aerosol challenges in animals preprimed with OVA in complete Freund's adjuvant, which stimulates Th1-polarized immunity. The key findings from these experiments were transient up-regulation of CD86 expression at 2 h after challenge (Fig. 6 A) and subsequent expression of AHR (Fig. 6 B), analogous to Th2-primed animals. Additionally, aerosol-induced DC recruitment occurred in these animals at levels equivalent to the Th2-primed groups (unpublished data). Interestingly, there is a small but significant increase in CD80 expression at 2 h, which was not observed in Th2-primed animals.
Figure 6.
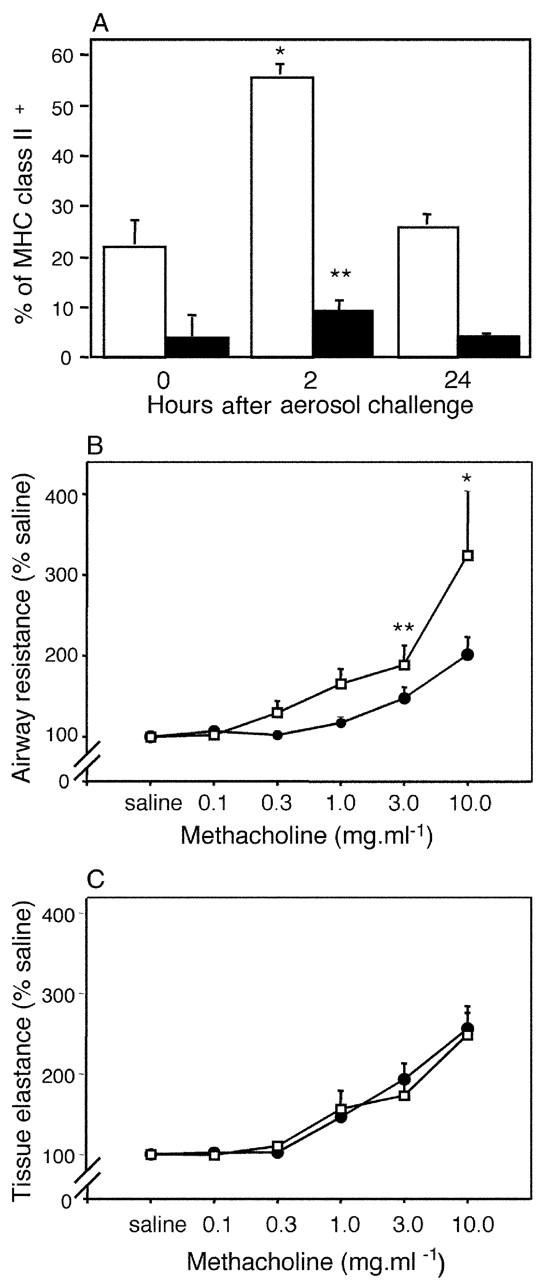
Responses to OVA aerosol challenge in rats primed for Th1 immunity with OVA/complete Freund's adjuvant. DCs from tracheal digests 2 and 24 h after challenge were immunostained as per Fig. 3. (A) illustrates time-dependent changes in CD80 (▪) and CD86 (□) expression after aerosol exposure. CD80/CD86+ DCs are shown as a percentage of total MHC class II+ DCs (mean ± SE from three experiments). Controls and gating strategies are as described in Fig. 3. MCh challenge was performed on parallel groups (n = 5) of control (•) and OVA/complete Freund's adjuvant–primed (○) animals. (B) illustrates a left shift in the MCh dose response curve, contrasting with no change in parenchymal responses shown in C. *, P < 0.01; **, P < 0.05.
Discussion
Asthma is a chronic inflammatory disease, in which the principal target tissues are the conducting airway mucosae (1, 23–25). Studies on airway mucosal biopsies from asthmatics have revealed a characteristic pattern of tissue remodelling, which is believed to be responsible for the altered mechanical properties of the airways and for their exaggerated responsiveness to bronchoconstrictor stimuli (1, 23–25). The disease process is multifactorial in origin, and one of the most important predisposing factors is allergy, as indicated by the strong association between risk for asthma and serum IgE (26). The presence of activated eosinophils and Th2 cells, characteristic of asthmatic airway biopsies (1, 24, 27), further emphasizes the importance of allergy in asthma pathogenesis.
The most informative studies on disease expression in target tissues have involved deliberate aeroallergen exposure of allergic volunteers and subsequent kinetic analysis of the sequelae. The response in chronic asthmatics is typically biphasic, comprising transient early bronchospasm within minutes of challenge that is associated with IgE-dependent mast cell degranulation (25, 28), and a subsequent wave of airway obstruction (the late phase reaction [LPR]) occurring several hours later, in association with the appearance in the airway mucosa of eosinophils and activated T cells (25, 28), together with heightened airway responsiveness to MCh.
The principal trigger for the LPR in atopic asthma is believed to be activated allergen-specific Th2 cells, with the eosinophil component of the response being stimulated by products from these Th2 cells, particularly IL-5 (29). Recent findings demonstrating induction of LPRs in cat-allergic subjects with non–IgE-binding cat-specific peptides spanning defined T cell epitopes provide support for this hypothesis (5). However, the mechanisms that regulate T cell activation at sites of tissue damage in asthmatics remain poorly understood and are the subject of increasingly intensive research in animal model systems. Of particular interest are issues related to regulation of local APC functions.
Immunohistochemical studies in a range of species have identified DCs as the sole resident population of professional APCs in respiratory tract tissues (14, 30). Reports from our group (7, 8) and others (31, 32) indicate that these DCs are distributed as dense, contiguous networks, in particular within the lining of the airways, which is the principal site of impaction of inhaled particles, wherein the DCs occur in densities up to 1,000 per mm2 epithelium (7, 8, 31, 32). The functions of these DCs are tightly controlled. As described in other organ systems (33), DCs isolated from resting respiratory tract tissues are specialized for uptake and processing of inhaled antigen, lacking capacity for effective presentation to T cells (10, 11). The eventual development of full APC competence by these DCs requires a cytokine-dependent maturation step, suggesting that they normally serve an exclusively sentinel function in the airway wall, which is restricted to antigen acquisition, subsequent presentation to the T cell system occurring only after migration to and subsequent maturation within RLN (10, 11, 34).
However, interpretation of results from these animal models in relation to asthma pathogenesis is complicated by the uncertain relationship between the respiratory tract DC populations used in these investigations, and the DCs at sites of inflammation in the airway mucosa in asthma. Published studies on DC function in experimental asthma models have focused primarily on populations on the alveolar surface that are accessible by BAL (13, 35), or on “respiratory tract–derived” DCs harvested from RLN (12, 13, 18, 35), whereas studies on tissue-derived DCs from the respiratory tract have been restricted to mixed populations obtained from enzymatic digests of whole lung (12, 13). Such whole lung DC preparations would contain a high proportion of parenchymal DCs from tissue microenvironments within the peripheral lung that are distal to the lesional site(s) in asthma. DCs in the parenchyma have previously been demonstrated to differ significantly from their counterparts in the conducting airway mucosae with respect to surface phenotype (31, 36), turnover rate (9), and kinetics of postnatal development (37). Of particular note, airway mucosal dendritic cells (AMDC) exhibit a uniquely rapid steady state half-life of <36 h, in contrast to >10 d for peripheral lung DCs (9). This difference reflects relative levels of local stimulation from inhaled irritants/antigens, which is markedly more intense in the conducting airways than at the lung periphery due to the aerodynamic characteristics of the respiratory tract (38). We hypothesized that these variations may have important functional implications with respect to responses to antigen challenge of different respiratory tract DC populations. We have addressed this important issue via a series of parallel studies on purified DCs isolated from large conducting airways (trachea), peripheral lung, and RLN draining the upper airways, in OVA-sensitized rats challenged with aerosolized OVA.
The salient findings from this study are as follows: (a) inhaled antigen is efficiently acquired by local AMDC via endocytosis (Figs. 3 C and 4 A); (b) these DCs are in continuous communication via clustering with transiting T cells (Fig. 5 D); the mechanisms underlying these interactions remain to be defined, but may involve ICAM-1 (CD54; reference 39), which is constitutively expressed by AMDC (Fig. 3 B); (c) in sensitized, but not naive, animals CD86 expression is rapidly triggered on AMDC after OVA inhalation (Figs. 3 B, G, and 5 F); the majority of airway T cells exhibit the Th memory phenotype (40–43) and we speculate that OVA-specific Th memory cells mediate the AMDC activation observed here; on the basis of previous reports it is feasible that this might be driven by T cell–derived CD40L (44, 45) in combination with cytokines such as GM-CSF (46); (d) within the same time frame, AMDC develop capacity to present antigen (Fig. 4 A); acquisition of APC activity is accompanied by CD86 up-regulation but in vitro CD86 blockade inhibits only ∼50% of this activity, thus CD86 might be a surrogate marker for other key costimulatory molecules; follow-up experiments involving in vivo blockade are required to elucidate this question; a likely candidate in this context is ICOSL, which has recently been shown to be induced on mature DCs in lung RLN in a mouse asthma model (47); (e) these interactions result in local T cell activation/IL-2R expression (Fig. 5 E), which is associated in turn with development of AHR (Fig. 2 A); based on observations from other laboratories, activation of incoming eosinophils that peak at 24 h (Fig. 1 D) might be a key element in this process (1, 23); (f) between 2 and 24 h, CD86hi DCs with APC activity decline markedly in number within the airway mucosa (Figs. 3 B, G, and 4 A), whereas reciprocally increasing in RLN (Figs. 3 H and 4 B); this might be due in part to “exhaustion” of these cells in situ (48) but we speculate on the basis of earlier tracking studies in a mouse asthma model (18) plus our present data on the sequential appearance of DCs with the relevant functional phenotype in the airway mucosa and subsequently in the RLN, that emigration of mature AMDC to the RLN also contributes to the pattern observed; and (g) during the timeframe of these changes within the resident AMDC population, a large influx of new DCs is recruited into airway tissues (Fig. 1, A–D; reference 15); on the basis of their phenotypic characteristics we speculate that these represent immature DCs recruited to replace antigen-bearing emigrants; little direct information is available concerning control of this trafficking, aside from earlier observations on responsiveness of resident lung DCs to CC chemokines (15, 16); mast cells are unlikely to be a significant source of the relevant chemokines as the DC recruitment response cannot be reproduced by adoptive transfer of serum containing OVA-specific IgE.
Two observations from this study merit specific comment. First, it is clear that transient up-regulation of the APC functions of respiratory tract DCs after antigen aerosol exposure is restricted in this model to populations in the airway mucosa, and does not occur in lung parenchymal DCs (Fig. 3, J and K), despite the fact that DC recruitment occurs in the peripheral lung (Fig. 1 E). The latter suggests that significant levels of inhaled antigen reach this part of the respiratory tract, and this is supported by our observations (49) demonstrating major changes in peripheral lung tissue elastance in rats sensitized to OVA after OVA challenge under conditions identical to those used here. The absence of activated DCs in the peripheral lungs of animals in the present experiments contrasts with findings in other studies involving analysis of homogenized whole murine lungs after local challenge of sensitized animals (12, 13). However, in the present experiments peripheral lung was initially dissected free of hilar tissue containing the bulk of the conducting airways before digestion, whereas the whole lung tissue homogenates used in these latter experiments (12, 13) would contain a mixture of DCs derived from both parenchymal lung and from airway mucosa. Our present data suggests that the bulk of the APC activity detected in these homogenates (12, 13) is therefore likely to be attributable to airway mucosal-derived DCs.
It is also relevant to note that we have recently shown that the site(s) of allergen-induced inflammation in the lung determines the site(s) at which MCh hyperresponsiveness develops (50) and the lack of hyperresponsiveness in peripheral lung tissue in the current model (Fig. 2 B) is thus consistent with the lack of local T cell–mediated inflammation (and by inference DC maturation) at this site. These observations can only be made when using physiological techniques capable of partitioning lung responses into components representing the airways and lung parenchyma separately, such as those used here. The reasons underlying this strict partitioning of DC/T cell responses are not fully clear and may reflect intrinsic differences between DC populations at respective sites (e.g., note variations in CD4, CD8, and CD11b/c; Fig. 3, B vs. J), regional differences in regulation by DC inhibitory macrophages (10), and/or variations in specific Th memory cell migration patterns in the two tissue microenvironments. In relation to the latter it should be reiterated that T cell trafficking to the airway mucosa would favor the transit of specific mucosal homing T cells that preferentially extravasate in tissues that are part of the common mucosal immune system (6), whereas extravasation from the vascular bed in peripheral lung tissues is essentially a random process (51). Additionally, our earlier immunohistochemical studies (52) indicate that T cell density within the lung parenchyma is markedly lower than that in the airway submucosa (Fig. 5 and Fig. S8, available at http://www.jem.org/cgi/content/full/jem.20021328/DC1), hence minimizing the chances for interactions between antigen-bearing DCs and antigen-specific Th memory cells in the peripheral lung.
A recent report involving a mouse asthma model detected the presence of long-lived antigen-laden APCs in BAL, but not in lung homogenates from sensitized animals, after several cycles of aerosol exposure (13). However, in our rat model we have been unable to detect comparable long-lived APCs in the airway mucosa, after up to nine cycles of aerosol exposure (unpublished data), which, taken together with the earlier findings, suggests that the distribution of these cells might be restricted to the peripheral lung. It will also be of interest to determine in future studies whether T cells activated via these long-lived antigen-laden APCs can traffic to asthma lesional sites in the airway mucosa and thus contribute to disease progression. The precise identity of these long-lived peripheral lung APCs, and their presence in species other than the mouse, also requires clarification. These cells reportedly express phenotypic characteristics typical of DCs (13), with the exception of extremely long half-life, which in this tissue compartment has previously only been described for local macrophages (53). It is also noteworthy that they manifest up-regulation of CD80 expression (13), as opposed to CD86, which is the defining feature of the AMDC response in the present model. We have previously reported that GM-CSF exposure of murine pulmonary alveolar macrophage changes their functional phenotype from markedly suppressive to supportive of T cell activation (54). Moreover, GM-CSF is produced at high levels in airway tissues of atopic asthmatics (55), along with Th2 cytokines including IL-4 (27). Given the potency of GM-CSF combined with IL-4 in promoting maturation of cells from the monocyte/macrophage lineage into antigen-presenting DCs (20), it is conceivable that the persistent APC population detected on the alveolar surface of chronically aerosol-challenged sensitized mice (13) may have arisen through a similar mechanism. Overlap between the macrophage and DC populations in murine BAL has previously been recognized via sharing of expression of markers such as NLDC-145 (56) and it is noteworthy that the long-lived DCs reported as appearing in murine BAL after allergen exposure also express F4/80 (13). Comparable sharing of phenotypic characteristics between pulmonary alveolar macrophage and DCs in this compartment has been reported in humans (57).
Finally, it is noteworthy that antigen-induced airway DC/T cell activation and associated development of AHR appears comparable in animals primed for Th1- (Fig. 6) or Th2-polarized immunity (Figs. 1–5). This finding is consistent with reports in murine models that indicate that AHR can also be induced via Th1 pathways (58) and with studies demonstrating similar T cell–associated pathology in airway biopsies from atopic and nonatopic asthmatics (59). A similar role for Th1 immunity in the pathogenesis of chronic atopic dermatitis has also been suggested, based on studies in murine models (60) and direct observation of lesional sites in humans (61).
We have recently demonstrated changes in the population dynamics of AMDC in human atopic asthmatics after aeroallergen challenge (62), which closely reflect those demonstrated in this animal model. Collectively, the findings from these studies have significant implications for drug design in asthma. They provide the first plausible mechanism for transient airway mucosal T cell activation during the timeframe of the LPR at the specific lesional site in asthma, and identify local DC–T cell interaction(s) and associated functional changes in local DCs as key steps in the response. The development of drug(s) targeted specifically at these processes offers new possibilities for asthma control.
Acknowledgments
This work was funded by the National Health & Medical Research Council of Australia, and GlaxoSmithKline, UK.
J.C. Huh and D.H. Strickland contributed equally to this work.
The online version of this article contains supplemental material.
Footnotes
Abbreviations used in this paper: AHR, airways hyperresponsiveness; AMDC, airway mucosal dendritic cells; BAL, bronchoalveolar lavage; LPR, late phase reaction; MCh, methacholine; PTLN, parathymic lymph nodes; RLN, regional lymph nodes; SSC, side scatter.
References
- 1.Holgate, S. 1998. The inflammation-repair cycle in asthma: the pivotal role of the airway epithelium. Clin. Exp. Allergy. 28:97–103. [DOI] [PubMed] [Google Scholar]
- 2.Holloway, L.J., R. Beasley, W.R. Roche, and A.L. James. 2000. The pathology of fatal asthma. Asthma & Rhinitis, Volume 1. W.W. Busse and S.T. Holgate, editors. Blackwell Science Ltd, Oxford. 193–202.
- 3.James, A.L., P.D. Paré, and J.C. Hogg. 1989. The mechanics of airway narrowing in asthma. Am. Rev. Respir. Dis. 139:242–246. [DOI] [PubMed] [Google Scholar]
- 4.Corry, D.B., and F. Kheradmand. 1999. Induction and regulation of the IgE response. Nature. 402:B18–B23. [DOI] [PubMed] [Google Scholar]
- 5.Haselden, B.M., A.B. Kay, and M. Larche. 1999. Immunoglobulin E–independent major histocompatibility complex–restricted T cell peptide epitope-induced late asthmatic reactions. J. Exp. Med. 189:1885–1894. [DOI] [PMC free article] [PubMed] [Google Scholar]
- 6.Bienenstock, J., M.R. McDermott, and R.L. Clancy. 1999. Respiratory tract defenses: role of mucosal lymphoid tissues. Mucosal Immunology. P.L. Ogra, J. Mestecky, M.E. Lamm, W. Strober, J. Bienenstock, and J.R. McGhee, editors. Academic Press, San Diego. 283–292.
- 7.Holt, P.G., M.A. Schon-Hegrad, M.J. Phillips, and P.G. McMenamin. 1989. Ia-positive dendritic cells form a tightly meshed network within the human airway epithelium. Clin. Exp. Allergy. 19:597–601. [DOI] [PubMed] [Google Scholar]
- 8.Schon-Hegrad, M.A., J. Oliver, P.G. McMenamin, and P.G. Holt. 1991. Studies on the density, distribution, and surface phenotype of intraepithelial class II major histocompatibility complex antigen (Ia)-bearing dendritic cells (DC) in the conducting airways. J. Exp. Med. 173:1345–1356. [DOI] [PMC free article] [PubMed] [Google Scholar]
- 9.Holt, P.G., S. Haining, D.J. Nelson, and J.D. Sedgwick. 1994. Origin and steady-state turnover of class II MHC-bearing dendritic cells in the epithelium of the conducting airways. J. Immunol. 153:256–261. [PubMed] [Google Scholar]
- 10.Holt, P.G., J. Oliver, N. Bilyk, C. McMenamin, P.G. McMenamin, G. Kraal, and T. Thepen. 1993. Downregulation of the antigen-presenting cell function(s) of pulmonary dendritic cells in vivo by resident alveolar macrophages. J. Exp. Med. 177:397–407. [DOI] [PMC free article] [PubMed] [Google Scholar]
- 11.Stumbles, P.A., J.A. Thomas, C.L. Pimm, P.T. Lee, T.J. Venaille, S. Proksch, and P.G. Holt. 1998. Resting respiratory tract dendritic cells preferentially stimulate Th2 responses and require obligatory cytokine signals for induction of Th1 immunity. J. Exp. Med. 188:2019–2031. [DOI] [PMC free article] [PubMed] [Google Scholar]
- 12.Xia, W., C.E. Pinto, and R.L. Kradin. 1995. The antigen-presenting activities of Ia+ dendritic cells shift dynamically from lung to lymph node after an airway challenge. J. Exp. Med. 181:1275–1283. [DOI] [PMC free article] [PubMed] [Google Scholar]
- 13.Julia, V., E.M. Hessel, L. Malherbe, N. Glaichenhaus, A. O'Garra, and R.L. Coffman. 2002. A restricted subset of dendritic cells captures airborne antigens and remains able to activate specific T cells long after antigen exposure. Immunity. 16:271–283. [DOI] [PubMed] [Google Scholar]
- 14.Holt, P.G., M.A. Schon-Hegrad, and J. Oliver. 1988. MHC class II antigen-bearing dendritic cells in pulmonary tissues of the rat. Regulation of antigen presentation activity by endogenous macrophage populations. J. Exp. Med. 167:262–274. [DOI] [PMC free article] [PubMed] [Google Scholar]
- 15.McWilliam, A.S., S. Napoli, A.M. Marsh, F.L. Pemper, D.J. Nelson, C.L. Pimm, P.A. Stumbles, T.N.C. Wells, and P.G. Holt. 1996. Dendritic Cells are recruited into the airway epithelium during the inflammatory response to a broad spectrum of stimuli. J. Exp. Med. 184:2429–2432. [DOI] [PMC free article] [PubMed] [Google Scholar]
- 16.Stumbles, P.A., D.H. Strickland, C.L. Pimm, S.F. Proksch, A.M. Marsh, A.S. McWilliam, A. Bosco, I. Tobagus, J.A. Thomas, S. Napoli, et al. 2001. Regulation of dendritic cell recruitment into resting and inflamed airway epithelium: use of alternative chemokine receptors as a function of inducing stimulus. J. Immunol. 167:228–234. [DOI] [PubMed] [Google Scholar]
- 17.Sedgwick, J.D., I.A. MacPhee, and M. Puklavec. 1989. Isolation of encephalitogenic CD4+ T cell clones in the rat. Cloning methodology and interferon-gamma section. J. Immunol. Methods. 121:185–196. [DOI] [PubMed] [Google Scholar]
- 18.Vermaelen, K.Y., I. Carro-Muino, B.N. Lambrecht, and R.A. Pauwels. 2001. Specific migratory dendritic cells rapidly transport antigen from the airways to the thoracic lymph nodes. J. Exp. Med. 193:51–60. [DOI] [PMC free article] [PubMed] [Google Scholar]
- 19.Petak, F., Z. Hantos, A. Adamicza, T. Asztalos, and P.D. Sly. 1997. Methacholine-induced bronchoconstriction in rats: effects of intravenous vs. aerosol delivery. J. Appl. Physiol. 82:1479–1487. [DOI] [PubMed] [Google Scholar]
- 20.Sallusto, F., M. Cella, C. Danieli, and A. Lanzavecchia. 1995. Dendritic cells use macropinocytosis and the mannose receptor to concentrate macromolecules in the major histocompatibility complex class II compartment: downregulation by cytokines and bacterial products. J. Exp. Med. 182:389–400. [DOI] [PMC free article] [PubMed] [Google Scholar]
- 21.Caron, G., L. Delneste, E. Roelandts, C. Duez, N. Herbault, G. Magistrelli, J.-Y. Bonnefoy, J. Pestel, and P. Jeannin. 2002. Histamine induced CD86 expression and chemokine production by human immature dendritic cells. J. Immunol. 166:6000–6006. [DOI] [PubMed] [Google Scholar]
- 22.Hele, D.J., M.A. Birrell, S.E. Webber, M.L. Foster, and M.G. Belvisi. 2001. Mediator involvement in antigen-induced bronchospasm and microvascular leakage in the airways of ovalbuminn sensitized Brown Norway rats. Br. J. Pharmacol. 132:481–488. [DOI] [PMC free article] [PubMed] [Google Scholar]
- 23.Holt, P.G., C. Macaubas, P.A. Stumbles, and P.D. Sly. 1999. The role of allergy in the development of asthma. Nature. 402:B12–B17. [DOI] [PubMed] [Google Scholar]
- 24.Busse, W.W., S. Banks-Schlegel, and S.E. Wenzel. 2000. Pathophysiology of severe asthma. J. Allergy Clin. Immunol. 106:1033–1042. [DOI] [PubMed] [Google Scholar]
- 25.Wills-Karp, M. 1999. Immunologic basis of antigen-induced airway hyperresponsiveness. Annu. Rev. Immunol. 17:255–281. [DOI] [PubMed] [Google Scholar]
- 26.Burrows, B., F. Martinez, M. Halonen, R. Barbee, and M. Cline. 1989. Association of asthma with serum IgE levels and skin-test reactivity to allergens. N. Engl. J. Med. 320:271–277. [DOI] [PubMed] [Google Scholar]
- 27.Ying, S., S.R. Durham, C.J. Corrigan, Q. Hamid, and A.B. Kay. 1995. Phenotype of cells expressing mRNA for TH2-type (interleukin 4 and interleukinn 5) and TH1-type (interleukin 2 and interferon gamma) cytokines in bronchoalveolar lavage and bronchial biospies from atopic asthmatic and normal control subjects. Am. J. Respir. Cell Mol. Biol. 12:477–487. [DOI] [PubMed] [Google Scholar]
- 28.Pauwels, R. 1989. The relationship between airway inflammation and bronchial hyperresponsiveness. Clin. Exp. Allergy. 19:395–398. [DOI] [PubMed] [Google Scholar]
- 29.Foster, P.S., S.P. Hogan, A.J. Ramsay, K.I. Matthaei, and I.G. Young. 1996. Interleukin 5 deficiency abolishes eosinophilia, airways hyperreactivity, and lung damage in a mouse asthma model. J. Exp. Med. 183:195–201. [DOI] [PMC free article] [PubMed] [Google Scholar]
- 30.Holt, P.G., A. Degebrodt, C. O'Leary, K. Krska, and T. Plozza. 1985. T cell activation by antigen-presenting cells from lung tissue digests: suppression by endogenous macrophages. Clin. Exp. Immunol. 62:586–593. [PMC free article] [PubMed] [Google Scholar]
- 31.Gong, J.L., K.M. McCarthy, J. Telford, T. Tamatani, M. Miyasaka, and E.E. Schneeberger. 1992. Intraepithelial airway dendritic cells: a distinct subset of pulmonary dendritic cells obtained by microdissection. J. Exp. Med. 175:797–807. [DOI] [PMC free article] [PubMed] [Google Scholar]
- 32.Lambrecht, B.N., B. Salomon, D. Klatzmann, and R.A. Pauwels. 1998. Dendritic cells are required for the development of chronic eosinophilic airway inflammation in response to inhaled antigen in sensitized mice. J. Immunol. 160:4090–4097. [PubMed] [Google Scholar]
- 33.Steinman, R.M. 1991. The dendritic cell system and its role in immunogenicity. Annu. Rev. Immunol. 9:271–296. [DOI] [PubMed] [Google Scholar]
- 34.Holt, P.G., and P.A. Stumbles. 2000. Regulation of immunologic homeostasis in peripheral tissues by dendritic cells: the respiratory tract as a paradigm. J. Allergy Clin. Immunol. 105:421–429. [DOI] [PubMed] [Google Scholar]
- 35.Akbari, O., R.H. DeKruyff, and D.T. Umetsu. 2001. Pulmonary dendritic cells producing IL-10 mediate tolerance induced by respiratory exposure to antigen. Nat. Immunol. 2:725–731. [DOI] [PubMed] [Google Scholar]
- 36.Holt, P.G., J. Oliver, C. McMenamin, and M.A. Schon-Hegrad. 1992. Studies on the surface phenotype and functions of dendritic cells in parenchymal lung tissue of the rat. Immunology. 75:582–587. [PMC free article] [PubMed] [Google Scholar]
- 37.Nelson, D.J., C. McMenamin, A.S. McWilliam, M. Brenan, and P.G. Holt. 1994. Development of the airway intraepithelial dendritic cell network in the rat from class II MHC (Ia)-negative precursors: differential regulation of Ia expression at different levels of the respiratory tract. J. Exp. Med. 179:203–212. [DOI] [PMC free article] [PubMed] [Google Scholar]
- 38.Everard, M.L., and P.N. Le Souëf. 1999. Aerosol therapy and delivery systems. Pediatric Respiratory Medicine. L.M. Taussig and L.I. Landau, editors. Mosby, Inc., St. Louis. 286–299.
- 39.Dustin, M.L., and T.A. Springer. 1991. Role of lymphocyte adhesion receptors in transient interactions and cell locomotion. Annu. Rev. Immunol. 9:27–66. [DOI] [PubMed] [Google Scholar]
- 40.Marathias, K.P., F.I. Preffer, C. Pinto, and R.L. Kradin. 1991. Most human pulmonary infiltrating lymphocytes display the surface immune phenotype and functional responses of sensitized T cells. Am. J. Respir. Cell Mol. Biol. 5:470–476. [DOI] [PubMed] [Google Scholar]
- 41.Upham, J.W., C. McMenamin, M.A. Schon-Hegrad, B.W. Robinson, and P.G. Holt. 1994. Functional analysis of human bronchial mucosal T cells extracted with interleukin-2. Am. J. Respir. Crit. Care Med. 149:1608–1613. [DOI] [PubMed] [Google Scholar]
- 42.Strickland, D.H., U.R. Kees, and P.G. Holt. 1996. Regulation of T-cell activation in the lung: isolated lung T-cells exhibit surface phenotypic characteristics of recent activation including downmodulated TcR, but are locked into G0/G1 phase of the cell cycle. Immunology. 87:242–249. [DOI] [PMC free article] [PubMed] [Google Scholar]
- 43.Jahnsen, F.L., I.N. Farstad, J.P. Aanesen, and P. Brandtzaeg. 1998. Phenotypic distribution of T cells in human nasal mucosa differs from that in the gut. Am. J. Respir. Cell Mol. Biol. 18:392–401. [DOI] [PubMed] [Google Scholar]
- 44.Cella, M., D. Scheidegger, K. Palmer-Lehmann, P. Lane, A. Lanzavecchia, and G. Alber. 1996. Ligation of CD40 on dendritic cells triggers production of high levels of interleukin-12 and enhances T cell stimulatory capacity: T–T help via APC activation. J. Exp. Med. 184:747–752. [DOI] [PMC free article] [PubMed] [Google Scholar]
- 45.Ridge, J.P., F. Di Rosa, and P. Matzinger. 1998. A conditioned dendritic cell can be a temporal bridge between a CD4+ T-helper and a T-killer cell. Nature. 393:474–478. [DOI] [PubMed] [Google Scholar]
- 46.Stampfli, M.R., R.E. Wiley, G.S. Neigh, B.U. Gajewska, X.F. Lei, D.P. Snider, Z. Xing, and M. Jordana. 1998. GM-CSF transgene expression in the airways allows aerosolized ovalbumin to induce allergic sensitization in mice. J. Clin. Invest. 102:1704–1714. [DOI] [PMC free article] [PubMed] [Google Scholar]
- 47.Akbari, O., G.J. Freeman, E.H. Meyer, E.A. Greenfield, T.T. Chang, A.H. Sharpe, G. Berry, R.H. DeKruyff, and D.T. Umetsu. 2002. Antigen-specific regulatory T cells develop via ICOS-ICOS-ligand pathway and inhibit allergen-induced airway hyperreactivity. Nat. Med. 8:1024–1032. [DOI] [PubMed] [Google Scholar]
- 48.Langenkamp, A., M. Messi, A. Lanzavecchia, and F. Sallusto. 2000. Kinetics of dendritic cell activation: impact on priming of Th1, Th2 and nonpolarized T cells. Nat. Immunol. 1:311–316. [DOI] [PubMed] [Google Scholar]
- 49.Hall, G.L., F. Peták, C. McMenamin, and P.D. Sly. 1999. The route of antigen delivery determines the airway and lung tissue mechanical responses in allergic rats. Clin. Exp. Allergy. 29:562–568. [DOI] [PubMed] [Google Scholar]
- 50.Sly, P.D., G.L. Hall, J. Temelkovski, Y. Ueda, D.C. Sly, and R.K. Kumar. 1999. Selective airway inflammation results in airway hyperresponsiveness in mice. Am. J. Respir. Crit. Care Med. 159:A872. [Google Scholar]
- 51.Hall, J. 1985. The study of circulating lymphocytes in vivo: a personal view of artifice and artifact. Immunol. Today. 6:149–152. [DOI] [PubMed] [Google Scholar]
- 52.Holt, P.G., and M.A. Schon-Hegrad. 1987. Localization of T cells, macrophages and dendritic cells in rat respiratory tract tissue: implications for immune function studies. Immunology. 62:349–356. [PMC free article] [PubMed] [Google Scholar]
- 53.Holt, P.G. 1993. Regulation of antigen-presenting cell function(s) in lung and airway tissues. Eur. Respir. J. 6:120–129. [PubMed] [Google Scholar]
- 54.Bilyk, N., and P.G. Holt. 1993. Inhibition of the immunosuppressive activity of resident pulmonary alveolar macrophages by granulocyte/macrophage colony-stimulating factor. J. Exp. Med. 177:1773–1777. [DOI] [PMC free article] [PubMed] [Google Scholar]
- 55.Poston, R.N., P. Chanez, J.Y. Lacoste, T. Litchfield, T.H. Lee, and J. Bousquet. 1992. Immunohistochemical characterisation of the cellular infiltration in asthmatic bronchi. Am. Rev. Respir. Dis. 145:918–921. [DOI] [PubMed] [Google Scholar]
- 56.Breel, M., M. Van der Ende, T. Sminia, and G. Kraal. 1988. Subpopulations of lymphoid and non-lymphoid cells in bronchus-associated lymphoid tissue (BALT) of the mouse. Immunology. 63:657–662. [PMC free article] [PubMed] [Google Scholar]
- 57.van Haarst, J.M.W., H.C. Hoogsteden, H.J. de Wit, G.T. Verhoeven, C.E. Havenith, and H.A. Drexhage. 1994. Dendritic cells and their precursors isolated from human bronchoalveolar lavage: immunocytologic and functional properties. Am. J. Respir. Cell Mol. Biol. 11:344–350. [DOI] [PubMed] [Google Scholar]
- 58.Hessel, E.M., A.J.M. Van Oosterhout, I. Van Ark, B. Van Esch, G. Hofman, H. Van Loveren, H.F.J. Savelkoul, and F.P. Nijkamp. 1997. Development of airway hyperresponsiveness is dependent on interferon-g and independent of eosinophil infiltration. Am. J. Respir. Cell Mol. Biol. 16:325–334. [DOI] [PubMed] [Google Scholar]
- 59.Humbert, M., G. Menz, S. Ying, C.J. Corrigan, D.S. Robinson, S.R. Durham, and A.B. Kay. 1999. The immunopathology of extrinsic (atopic) and intrinsic (non-atopic) asthma: more similarities than differences. Immunol. Today. 20:528–533. [DOI] [PubMed] [Google Scholar]
- 60.Spergel, J.M., E. Mizoguchi, H. Oettgen, A.K. Bhan, and R.S. Geha. 1999. Roles of Th1 and Th2 cytokines in a murine model of allergic dermatitis. J. Clin. Invest. 103:1103–1111. [DOI] [PMC free article] [PubMed] [Google Scholar]
- 61.Grewe, M., C.A. Bruijnzeel-Koomen, E. Schopf, T. Thepen, A.G. Langeveld-Wildschut, T. Ruzicka, and J. Krutmann. 1998. A role for Th1 and Th2 cells in the immunopathogenesis of atopic dermatitis. Immunol. Today. 19:359–361. [DOI] [PubMed] [Google Scholar]
- 62.Jahnsen, F., E.D. Moloney, T. Hogan, J.W. Upham, C.M. Burke, and P.G. Holt. 2001. Rapid dendritic cell recruitment to the bronchial mucosa of patients with atopic asthma in response to local allergen challenge. Thorax. 56:823–826. [DOI] [PMC free article] [PubMed] [Google Scholar]