

Abstract
This study examined the effect of the pro-inflammatory cytokines interferon-γ (IFN-γ) and tumor necrosis factor-α (TNF-α) on the induction of MHC class I–related genes in functionally mature brain neurons derived from cultures of dissociated rat hippocampal tissue. Patch clamp electrophysiology combined with single cell RT-PCR demonstrated that ∼50% of the untreated neurons contained mRNA for MHC class I heavy chains, while, with few exceptions, the cells failed to transcribe β2-microglobulin and TAP1/TAP2 gene transcripts. No constitutive expression of MHC class I protein was detectable by confocal laser microscopy on the surface of neurons.
All neurons transcribed the α-chain of the interferon-type II receptor (binding IFN-γ) along with the p55 receptor for TNF-α. Sustained exposure to IFN-γ resulted in transcription of β2microglobulin and TAP1/TAP2 genes and MHC class I surface expression in a minor part of the neurons, but did not alter their electrophysiological activities as assessed by whole cell electrophysiology. Suppression of neuronal electric activity by the sodium channel blocker tetrodotoxin drastically increased to almost 100% IFN-γ-mediated induction of MHC class I chains, of both TAP transporters, and of membrane expression of MHC class I protein. The effect of tetrodotoxin is at least partly reverted by the neurotransmitter glutamate.
In contrast to IFN-γ, treatment with TNF-α did neither upregulate TAP1/TAP2 nor β2microglobulin gene expression, but induced MHC class I heavy chain gene transcription in all neurons. Consequently, no MHC class I molecules were detectable on the membranes of TNF-α-treated neurons.
Proinflammatory cytokines are known to functionally connect the immune system with the central nervous system (NS)1 during development and maturity. Observations mainly in tissue culture suggest that both IFN-γ and TNF-α affect the differentiation of neurons (1–3) or their electric function (4–6). In the adult brain, proinflammatory cytokines are known to profoundly influence behavioral functions like sleep, feeding, and temperature regulation (7–9). Furthermore, cytokines participate in the development of pathological brain lesions. Both IFN-γ and TNF-α are main mediators in the pathogenesis of the inflammatory lesion in autoimmune disease like multiple sclerosis. TNF-α mediates cytotoxic damage to glia cells and possibly neurons too, while IFN-γ seems to act by inducing cell surface molecules required for interactions between immune and brain cells.
The brain's complex structure makes it difficult to identify the cellular sources of locally produced cytokines, and to follow their exact modes of action. Part of the cytokines is released by autochthonous brain cells, while another part comes from immune cells having invaded the CNS tissue, and still another part of cytokines may enter the brain from outside through the endothelial blood–brain barrier or through peripheral nerves. Once released into the brain tissue, cytokines may act on neurons either directly, or via nonneuronal brain cells.
In an attempt to better understand the action of proinflammatory cytokines on neurons, we combined patch clamp electrophysiology with PCR gene amplification to study in vitro the modulatory effect of IFN-γ and TNF-α on MHC class I gene expression in single, functionally matured neurons. Using this paradigm, we recently described that cultured hippocampal neurons are principally able to express MHC class I genes, but that their own electric activity suppresses MHC inducibility (10). We now show that MHC class I genes of neurons are differentially regulated by IFN-γ and TNF-α. IFN-γ was capable of inducing MHC class I and MHC class I assembly-related genes in electrically paralyzed neurons. In striking contrast, TNF-α upregulated only MHC class I heavy chain transcription, but did not induce TAP1/ TAP2 and β2-microglobulin gene expression, irrespective of electric membrane activity.
Materials and Methods
Hippocampal Cell Culture.
Mixed cell cultures were prepared from hippocampus tissue of 18-d-old fetal Lewis rats, as previously described (11). After removal of meninges hippocampi were dissected and dissociated by trituration through a fire-polished Pasteur pipette. Cells were plated on petri dishes which have been coated with 0.5 mg/ml poly-l-ornithine (P 3530; Sigma Chem. Co., St. Louis, MO). The culture medium was composed of basal medium (BME, 41010-26; GIBCO BRL, Gaithersburg, MD) enriched with 10% fetal calf serum (PanSystems, Nürnberg, Germany). After 5–8 d the cells were cultured under serum-free conditions in BME supplemented with bovine serum albumin 100 μg/ml (A 7638; Sigma), transferrin 100 μg/ml (T 5761; Sigma), insulin 5 μg/ml (I 6634; Sigma), progesterone 60 ng/ml (P 0130; Sigma), putrescine 16 ng/ml (P 7505; Sigma), sodium selenite 40 ng/ml (S 1382; Sigma), thyroxin 40 ng/ml (T 1775; Sigma), triiodo-l-thyronine 30 ng/ml (T 6397; Sigma). The cultures were incubated for at least 12 d before treatment with recombinant rat IFN-γ (100 U/ml; Laboserv, Gießen, Germany), recombinant human TNF-α (10 ng/ml; Laboserv), tetrodotoxin (1 μM; Sigma), or l-glutamate (2 μM; Sigma).
Immunofluorescence Labeling for Microtubulin-associated Protein 2 and Glial Fibrillary Acidic Protein.
For immunofluorescence labeling cells were fixed with −20°C cold 95% ethanol plus 5% acetic acid for 10 min. After blocking nonspecific binding sites with PBS plus 2% goat serum and 2% BSA the cells were labeled with mouse mAb specific for microtubulin-associated-protein-2 (MAP2) (10 μg/ml; Sigma) and rabbit polyclonal antibodies specific for glial fibrillary acidic protein (GFAP) (10 μg/ml; Dako Diagnostika, Hamburg, Germany) followed by secondary fluorochrome Cy3conjugated goat antibodies to mouse immunoglobulin (10 μg/ml; Dianova) and fluorochrome (dichlorotriazinyl)aminofluoresceinconjugated goat antibodies to rabbit immunoglobulin (10 μg/ml; Dianova).
Immunofluorescence Labeling for IFN-γ Receptor and MAP2.
Cells were fixed with 4% paraformaldehyde for 20 min and permeabilized with Triton X-100 for 30 min. After treatment with phosphate buffered saline plus 2% goat serum and 2% bovine serum albumin cells were labeled with rabbit polyclonal antiserum to IFN-γ receptor α-chain (binding to both rat and mouse receptors; 1 μg/ml, K-17; Santa Cruz Biotechnology, CA) followed by secondary fluorochrome Cy3-conjugated goat antibodies to rabbit immunoglobulin (10 μg/ml; Dianova). Neurons were double-labeled with mouse monoclonal antibodies specific for MAP2 (10 μg/ml; Sigma) followed by secondary fluorochrome (dichlorotriazinyl)aminofluorescein-conjugated goat antibodies to mouse immunoglobulin (10 μg/ml; Dianova). Background labeling was monitored with the synthetic peptide used as immunogen (2 μg/ml, K-17; Santa Cruz Biotechnology) plus the polyclonal antiserum to IFN-γ receptor and secondary fluorochrome Cy3conjugated goat antibodies to rabbit immunoglobulin.
Patch–Clamp Electrophysiology.
Neuronal activity was analyzed in single hippocampal cells using the whole cell recording configuration of the patch–clamp technique (12). The pipettes were pulled from borosilicate glass to wide tip openings giving resistances of 2–5 ΩM. The pipette filling solution contained: 135 mM KCl, 4 mM MgCl2, 1 mM EGTA, 5 mM Hepes (pH 7.3). During the recordings the cells were bathed in a solution containing: 135 mM NaCl, 2 mM CaCl2, 2 mM MgCl2, 5 mM KCl, 5 mM Hepes (pH 7.3). The resting potential and spontaneous action potentials were monitored in the current clamp mode. Additionally, single action potentials were elicited from −60 mV by current pulses of 200–400 pA and a duration of 2.5 ms. Membrane currents were recorded in the voltage clamp mode with ramps (0.5 mV/s) from −80 to +80 mV delivered from a holding potential of -80 mV to allow a semiquantitative estimate of sodium and potassium currents.
Single Cell RT-PCR.
A modified single cell RT-PCR was performed as described (13). To destroy RNA-degrading enzymes all glass tubes and the silver wire were baked for 4 h at 220°C. Neurons were identified on the basis of spontaneous or evoked action potentials. Cytoplasm was sampled after electrophysiological recordings by applying negative pressure to the micropipette. Samples of the extracellular fluid and pipette solution served as controls and collection was controlled visually under the microscope. After removing the pipette, positive pressure was applied to the pipette and the tip of the pipette was broken in a test tube containing dithiothreitol (10 mM; GIBCO BRL), ribonuclease inhibitor (20 U; Promega Corp., Madison WI), hexamer random primers 1 μl (Boehringer Mannheim, Mannheim, Germany) and the four deoxyribonucleotides triphosphate (0.5 mM; Pharmacia). Moloney murine leukemia virus reverse transcriptase (100 U; GIBCO BRL) was added to the test tube. The resulting 10 μl mix was incubated for 1 h at 42°C. Single stranded cDNA was then stored at −80°C. Cytoplasmic mRNA of individual CD4 pos. myelin basic protein-specific T-lymphoblasts (14) was collected through a patch–clamp pipette and was reverse transcribed similarly. Total brain and thymus RNA was isolated using RNAzol (Wak-chemie, medical GmbH, Bad Homburg, Germany) (15) and was reverse transcribed as described. Brain- and thymus-derived tissue cDNA was diluted to a concentration of 20 pg/μl.
To avoid false positive PCR amplification special precautions were taken as described (16). Oligonucleotide sequences were selected with the program PRIMER (Whitehead Institute, MIT, Cambridge). Forward and reverse primers were always chosen from two different exons to detect a possible amplification of nuclear DNA. The respective primer pairs were for rat glyceraldehyde3-phosphate dehydrogenase (GAPDH) (GenBank-EMBL accession number X02231): 5′-CCCACGGCAAGTTCAACGG-3′ (pos. 220 to 238); 5′-CTTTCCAGAGGGGCCATCCA -3′(pos. 647 to 628), for rat β2-microglobulin (accession number Y00441): 5′-CGGTGACCGTGATCTTTCTGGT-3′(pos. 18 to 39); 5′-GGTGACGGTTTTGGGCTCCTT-3′ (pos. 349 to 329), for Lewis rat MHC class I (accession number L26224): 5′-TGCAGAGAGACTCAGGGCCTACC-3′(pos. 537 to 559); 5′-TGCCAGCTCAGGGAGATGTCA-3′ (pos. 734 to 714), for TAP1/ MTP-1 (accession number X57523): 5′-CCTCCATGCAGAAGTCCGTGG-3′(pos. 1375 to 1395); 5′-CATCCAGGAGCACCTTGCCC-3′(pos. 1674 to 1655), for Lewis rat TAP2/ MTP2 (accession number X75305): 5′-TGCTGTATCAGGAGGAAGTGGGG-3′ (pos. 1274 to 1296); 5′-AAGCGGTCACCTTTCCAGGATG-3′ (pos. 1537 to 1516), for GFAP (accession number L27219): 5′-AAGCTCCAAGATGAAACCAACCTGA-3′ (pos. 459 to pos. 483); 5′-CCACGATGTTCCTCTTGAGGTGG-3′ (pos. 1227 to 1205), for MAP2 (accession number X51842): 5′-AGCCTGCAGCTCTGCCTTTAGC-3′ (pos. 415 to 436); 5′-AGGTCTGGCAGAGGTTGGTTAATGA-3′ (pos. 5077 to 5053), for mouse IFN-γ receptor (accession number M28995): 5′-GGTTGGACAAAAAGAATCTGACTATGC-3′ (pos. 339 to 366); 5′-GCACTTTTTACCACAGAGAGCAAGGAC-3′ (pos. 908 to 882), for TNF-α receptor (accession number M63122): 5′-CCCAGGACTCAGGTACTGCCGT-3′ (pos. 851 to pos. 872); 5′-CAGAGTGGGGTTGAAGCCGG-3′ (pos. 1092 to pos. 1073), for calnexin (accession number L18889): 5′-TGGGGCCTGAAGAAAGCTGCTG-3′ (pos. 1366 to 1387); 5′-CGTCCTTCACATCTGGCTGGGG-3′ (pos. 1582 to 1561). All oligonucleotides were synthesized at the Max-Planck-Institute for Biochemistry (Martinsried, Germany).
β2-microglobulin and MHC class I mRNA was amplified simultaneously with GAPDH as internal standard (multiplex PCR). All other gene transcripts were coamplified along with GAPDH in separate reaction tubes. The reaction was done in a final volume of 50 μl containing 1 μl of the transcribed cDNA probe, the four deoxyribonucleotide triphosphates (0.2 mM each, Pharmacia), 2.5 U Ampli Taq (Perkin-Elmer/Cetus, Norwalk, CT) and 1× PCR-buffer (Perkin-Elmer/Cetus) covered with two drops of mineral oil (M 3516; Sigma). PCR amplification was performed on a programmable thermocycler (MultiCycler PTC 200; MJ Research Inc., Watertown, MA). After the cDNA was denaturated at 95°C for 3 min denatured primers (final 100 pmol primers) were added to each tube at 80°C. Polymerase chain reaction was performed by 48 cycles (93°C for 1 min; ramp with 0.1°C/s from 93°C to 60°C; 60°C for 1 min; 72°C for 1 min) and followed by one final cycle at 72°C for 5 min. 10 μl of the PCR reaction was loaded in parallel with the molecular weight marker (ΦX 174, HaeIII digested; Pharmacia) on a 1.7% agarose gel containing ethidium bromide.
Restriction Site Analysis and Sequencing.
For restriction site analysis PCR products (10 μl) from multiplex PCR were digested at 37°C for one hour. BglI, BglII and ApaI (10 U; Boehringer Mannheim) were chosen to cut the PCR fragments of GAPDH, β2microglobulin and MHC class I, respectively. StuI and RsaI (10 U; Boehringer Mannheim) were chosen to cut PCR fragments of TAP1 and TAP2, respectively. The digested DNA fragments were analyzed by agarose gel electrophoresis as described above. PCR products were purified from ethidium bromide stained agarose gels using the gel extraction method (Qiax gel extraction kit; Qiagen, Chatsworth, CA) and directly sequenced with an automated sequence analyzer (Perkin Elmer/Applied Biosystems 373A).
Confocal Laser Scanning Microscopy.
Mixed hippocampal cell cultures were treated as indicated with 100 U/ml IFN-γ or 10 ng/ml TNF-α and were labeled with monoclonal anti MHC class I antibody Ox 18 by adding 10 μg/ml antibody (final; Serotec Ltd., Oxford, UK) to the cell culture for 30 min. Cells were washed with phosphate buffered saline and fixed with 4% paraformaldehyde. After blocking with 2% goat serum and 2% BSA in PBS cells were incubated with secondary fluorochrome Cy3-conjugated goat antibodies specific for mouse immunoglobulin (10 μg/ ml; Dianova). To identify neurons, cells were permeabilized with 0.1% Triton X100 and stained with mouse monoclonal antibodies specific for MAP2 (10 μg/ml; Sigma) and secondary fluorochrome (dichlorotriazinyl) aminofluorescein-conjugated goat antibodies to mouse immunoglobulin (10 μg/ml; Dianova). 10 optical sections along the z-axis were scanned with a confocal laser scanning microscope (Leica Inc., Deerfield, IL) equipped with a 63 oil objective. Baseline labeling was revealed with isotype-matched monoclonal antibodies and secondary fluorochrome Cy3-conjugated goat antibodies to mouse immunoglobulin.
Results
Identification of Electrically Active Neurons.
Cells dissociated from fetal rat hippocampal tissue (E18) were allowed to differentiate for up to 2 wk. By day 12 in culture the neuronal cells formed a network of dense processes placed on top of an astrocyte monolayer (Fig. 1, A–C). Individual neurons were selected morphologically and identified by whole cell patch–clamp recording of spontaneous or evoked fast action potential firing (Fig. 2). Immediately after electrophysiological analysis, samples of cytoplasm were drawn from the recorded cell through the micropipette. MessengerRNA of each single cell was reversely transcribed into cDNA and analyzed after PCR amplification with specific primers. Efficiency and specificity of the patch-clamp RTPCR method was verified by co-amplifying housekeeping and lineage-specific gene transcripts. These included GAPDH as housekeeping gene, along with the cytoskeleton proteins MAP2 specific for neurons, and GFAP for astrocytes, the most important non-neuronal cells present in the cultures. Fig. 1 D displays the correct transcription of the lineage specific gene markers in a series of selected neurons and astrocytes, respectively. MAP2, but not GFAP, was exclusively detected in neuron-derived material, while all samples from neighboring astrocytes yielded solely cDNA for GFAP.
Figure 1.

Neuronal cell culture and lineage specific single cell RT-PCR. Neurons from embryonic hippocampi differentiated on top of a monolayer of astrocytes (A). Double immunofluorescence labeling for cell lineage-specific cytoskeletal markers MAP2 for neurons (B) and GFAP for astrocytes (C). Gene transcripts for MAP2 and GFAP amplified by single-cell patch–clamp RT-PCR from individual neurons (lanes 1–3) and astrocytes (lanes 4–6) on ethidium bromide stained agarose-gel (D). Lane N and lane M show negative controls of PCR-amplification and molecular weight marker X174/Hae III, respectively. Bar, (A–C) 20 μm.
Figure 2.

Spontaneous bioelectric activity of hippocampal neurons with or without IFN-γ treatment. (A) Spontaneous firing of action potentials persisting over at least 10 min by an untreated neuron (upper trace). Additional suprathreshold current pulses elicited single action potentials (lower trace, left). Depolarising ramps demonstrated sodium and potassium currents, downward and upward deflections, respectively (lower trace, right). (B) Hippocampal neuron treated with IFN-γ (100 U/ml) for 3 d.
MHC Class I–related Gene Transcription in Single, Untreated Neurons.
Single cell RT-PCR was performed to examine the transcription of MHC class I heavy chain, β2-microglobulin, TAP1/TAP2 and calnexin genes in individual neurons in the absence of exogenous cytokines or modulatory agents. Transcripts of the MHC class I heavy chain binding protein calnexin gene were present in all analyzed hippocampal neurons (Fig. 4 A), while 12 out of 22 analyzed neurons contained MHC class I heavy chain mRNA (Fig. 3, Tables 1 and 2). In contrast, mRNA for β2-microglobulin was rarely detectable (2 of 22 cells) and TAP1/TAP2 transcripts were absent in all (0/22) analyzed neurons. In contrast, the same single cell RT-PCR technique, when applied to activated T-lymphocytes, detected MHC class I, β2-microglobulin and TAP1/TAP2 mRNA in all cells (Fig. 3, Table 1). In astrocytes we persistently amplified MHC class I heavy chain and β2-microglobulin genes, although TAP1 and TAP2 gene transcripts were detectable only in some, but not all astroglial cells (6/10 and 5/10, respectively).
Figure 4.

Gene transcripts for calnexin, IFN-γ-receptor α-chain and TNF-α-receptor p55 amplified from individual neurons. Hippocampal neurons (lanes 1–6) expressing gene transcripts for calnexin (A), for IFNγ-receptor α-chain (B) and for TNF-α-receptor p55 (C). Lanes N and M show negative control of PCR-amplification and molecular weight marker X174/Hae III, respectively.
Figure 3.

Gene transcripts for GAPDH, β2-microglobulin, MHC class I heavy chain, and TAP1/TAP2 amplified from individual neurons and activated T cells. Cytoplasmic mRNA samples of individual neurons (lanes 1–5) and of individual T lymphoblasts (lanes 6 and 7) collected from single cells using the patch–clamp micropipette, reversely transcribed and coamplified by multiplex PCR with specific primers for GAPDH, β2microglobulin and MHC class I heavy chain (A). Whole brain tissue cDNA (lane B) and whole thymus tissue cDNA (lane T) as positive controls. Parallel coamplification of the same cDNA samples to detect TAP1 (B) and TAP2 (C) gene transcripts. Neurons (lanes 1–4), T lymphoblasts (lanes 5 and 6) or whole brain (lane B) and thymus tissue (lane T). Lane N and lane M show negative controls of PCR amplification and molecular weight marker X174/Hae III, respectively.
Table 1.
Gene Transcripts for MHC Class I Heavy Chain, β2-Microglobulin and TAP1/TAP2 Detected in Single Cells
| Cell type | Cells expressing mRNA for | |||||||
|---|---|---|---|---|---|---|---|---|
| MHC I | β2m | TAP1 | TAP2 | |||||
| Neurons | 40% | 10% | 0% | 0% | ||||
| 4/10 | 1/10 | 0/10 | 0/10 | |||||
| T cells | 100% | 100% | 100% | 100% | ||||
| 5/5 | 5/5 | 5/5 | 5/5 | |||||
| Astrocytes | 100% | 100% | 60% | 50% | ||||
| 10/10 | 10/10 | 6/10 | 5/10 | |||||
Table 2.
Induction of MHC Class I Heavy Chain, β2-Microglobulin and TAP1/TAP2 mRNA by IFN-γ and TTX in Single Neurons (TTX 1 μM, IFN-γ 100 U/ml, Glu.2 μM Glutamate)
| Treatment | Neurons expressing mRNA for | |||||||
|---|---|---|---|---|---|---|---|---|
| MHC I | β2m | TAP1 | TAP2 | |||||
| No | 55% | 9% | 0% | 0% | ||||
| 12/22 | 2/22 | 0/22 | 0/22 | |||||
| TTX, 24 h | 75% | 13% | 0% | 0% | ||||
| 6/8 | 1/8 | 0/8 | 0/8 | |||||
| TTX, 72 h | 92% | 17% | 0% | 0% | ||||
| 11/12 | 2/12 | 0/12 | 0/12 | |||||
| IFN-γ, 24 h | 65% | 35% | 25% | 25% | ||||
| 13/20 | 7/20 | 5/20 | 5/20 | |||||
| IFN-γ, 72 h | 71% | 43% | 24% | 19% | ||||
| 15/21 | 9/21 | 5/21 | 4/21 | |||||
| IFN-γ, 24 h + | ||||||||
| TTX, 24 h | 80% | 55% | 40% | 35% | ||||
| 16/20 | 11/20 | 8/20 | 7/20 | |||||
| IFN-γ, 72 h + | ||||||||
| TTX, 72h | 100% | 100% | 95% | 90% | ||||
| 19/19 | 19/19 | 18/19 | 17/19 | |||||
| IFN-γ, 72 h + | ||||||||
| TTX, 72h + | ||||||||
| Glut., 72 h | 55% | 27% | 0% | 0% | ||||
| 6/11 | 3/11 | 0/11 | 0/11 | |||||
Expression of Receptors for IFN-γ and TNF-α in Neurons.
There is clear evidence that proinflammatory cytokines can modulate neuronal function, but it has remained open, whether the cytokines act directly on the neurons, or indirectly, via local glial cells. We examined cultured untreated neurons for expression of receptors for IFN-γ and TNF-α, prerequisites of direct cytokine effects. Transcripts for the IFN-γ receptor α-chain were detected in 8/8 neurons analyzed (Fig. 4 B). The sequence of the amplified rat IFN-γ receptor PCR-product (submitted to GenBank, accession number U 68272) was homologous (83%) to the IFN-γ receptor sequence of the mouse, and in agreement with transcripts amplified from peripheral lymph organs. To corroborate IFN-γ expression in hippocampal neurons we performed immunofluorescence labeling of the IFN-γ receptor. IFN-γ receptor α-chain immune reactivity was detectable in neurons as well as in glial cells (Fig. 5). Almost all of hippocampal neurons identified by MAP2 staining (98 ± 3%, mean ± SEM) were labeled with antibodies to the IFN-γ binding receptor.
Figure 5.

IFN-g receptor immunoreactivity in hippocampal neurons. Double immunofluorescence for IFN-γ receptor α-chain (A), MAP-2 (B) and phase contrast (C). Scale bar: 20 μm.
Further, transcripts for the rat 55 kD TNF receptor were detected in all (9/9) hippocampal neurons analyzed (Fig. 4 C).
Effect of IFN-γ on Neuronal Transcription and Surface Expression of MHC Class I Protein.
Treatment with 100 U/ml IFN-γ for 72 h did not interfere with the bioelectric activities of hippocampal neurons. We measured resting potentials to assess the functional integrity of hippocampal neurons treated with IFN-γ. Typically, the resting potential of IFN-γ-treated neurons was 67.4 ± 4.6 mV (mean ± SE, n = 28) and was not statistically different from control cells (69.3 ± 5.7 mV, n = 17). IFN-γ-treated neurons also spontaneously fired action potentials (Fig. 2 B), like control neurons (Fig. 2 A). Neurons treated with IFN-γ, displayed various types of firing patterns like bursts or periodic single action potentials, which were likewise observed in control cells.
We examined the effect of IFN-γ on the expression of MHC class I–related genes by exposing neuronal cultures for 24 to 72 h to 100 U/ml IFN-γ. This treatment did not cause profound changes. Comparable to untreated cultures, IFN-γ treatment for 24 h resulted in the transcription of MHC class I heavy chain mRNA in 13/20 neurons, while β2-microglobulin transcripts were detected in 7/20 neurons and TAP1 and TAP2 transcripts in 5 out of 20 neurons respectively (Fig. 6 A, Table 2). Remarkably, only 3 out of 20 neurons transcribed all four genes at the same time. The proportion of class I gene transcribing neurons remained essentially stable throughout a IFN-γ treatment period of 72 h.
Figure 6.
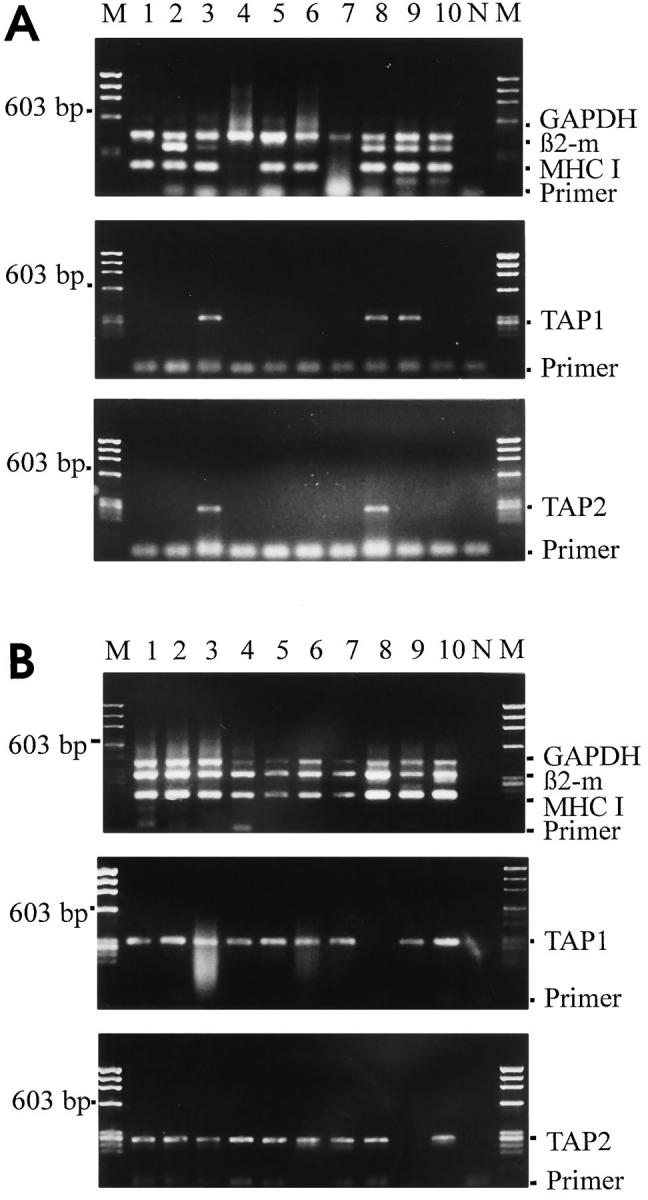
Induction of MHC class I heavy chain, β2-microglobulin and TAP1/TAP2 gene transcripts in individual neurons by IFN-γ. (A) Neurons pretreated with IFN-γ (100 U/ml) for 72 h. Gene transcripts for MHC class I heavy chain, β2-microglobulin (β2-m) and GAPDH coamplified in multiplex from individual neurons (lanes 1–10). Gene transcripts for TAP1 and TAP2 coamplified in parallel from the same neuron derived samples. Lanes N and M show negative control of PCR-amplification and molecular weight marker ΦX174/Hae III, respectively. Neurons pretreated with IFN-γ plus TTX for 72 h. Lane arrangement like in A.
IFN-γ-induced transcription of class I genes in neurons was, however, dramatically increased by the blockade of sodium channels by tetrodotoxin (TTX). After 72 h treatment with TTX plus IFN-γ all neurons expressed MHC class I heavy chain, β2-microglobulin (19/19), and almost all expressed TAP1 (18/19) and TAP2 (17/19) gene transcripts (Fig. 6 B, Table 2). Restriction fragment analysis and sequencing confirmed the identity of the amplified PCR fragments (Fig. 7 A).
Figure 7.

Restriction site analysis of amplified PCR-fragments and MHC class I heavy chain induction by TNF-α. (A) PCR-fragments amplified from IFN-γ plus TTX treated individual neurons, digested by restriction enzymes selected from the published sequence. PCR-fragments for GAPDH (428 bp) cut into 324 bp and 104 bp, for β2-microglobulin (332 bp) into 206 bp and 126 bp, for MHC class I heavy chain (198 bp) into 160 bp and 38 bp. PCR-fragments for TAP1 (300 bp) cut into 194 bp and 106 bp. PCR-fragments for TAP2 (264 bp) cut into 192 bp and 72 bp. All analyzed PCR-fragments were in agreement with the published sequences. (B) Gene transcripts for GAPDH, β2-microglobulin and MHC class I heavy chain coamplified from individual neurons (lanes 1 to 10) treated for 72 h with TNF-α. Lane N and lane M show negative control of PCR-amplification and molecular weight marker ΦX174/Hae III, respectively.
The enhancing effect of TTX treatment was neutralized by the neurotransmitter l-glutamate. Application of 2 μM glutamate to cultures treated with IFN-γ plus TTX reduced transcription of MHC class I related genes to baseline levels of untreated neurons (Table 2). In the presence of glutamate only very few neurons were induced by IFN-γ and TTX to transcribe MHC class I heavy chain or β2microglobulin and none of the neurons transcribed TAP1/ TAP2 genes, whereas expression of the housekeeping gene GAPDH was not affected by the transmitter.
Membrane expression of MHC class I protein was studied by confocal laser scanning microscopy after double immunofluorescence labeling of live neurons combining monoclonal antibodies against MHC class I molecules with neuron specific marker antibodies. There was no constitutive expression of MHC class I molecules on the surface of untreated hippocampal neurons. Treatment with 100 U/ml IFN-γ for 72 h, however, resulted in MHC class I expression on the cell surface in 34% of the hippocampal neurons (Figs. 8 and 9 A). MHC class I molecules accumulated on the cell surface by IFN-γ steadily with the duration of treatment (Fig. 9 B).
Figure 8.

MHC class I molecules on the neuronal cell surface. Confocal laser scanning microscopy of MHC class I molecules located on the cell surface. Identification of individual neurons (pretreated with IFN-γ for 72 h) by counterlabeling the neuron-specific cytoskeleton protein MAP2. MHC class I molecules labeled red (A) and MAP2 green (B). Merger of both images from one optical section with specific labeling of MHC class I molecules on the neuronal cell surface (C). D and E show one neuron with, and another one without MHC class I cell surface labeling. Scale bar: (A–C) 10 μm; (D and E) 20 μm.
Figure 9.

Inducibility of MHC class I molecules on the neuronal cell surface. Percentage of MHC class I surface expressing neurons (mean plus SEM) as identified by confocal laser scanning microscopy (MAP2 as neuronal marker). (A) Number of MHC class I expressing neurons after 72 h treatment with IFN-γ (100 U/ml), TNF-α (10 ng/ml), TTX (1 μM) and/or glutamate (Glu.; 2 μM). (B) Induction of MHC class I surface expression on neurons treated with IFN-γ with or without TTX over time (24–96 h).
After treatment with IFN-γ plus TTX, 91 % of the neurons were induced to express MHC class I protein, and this increased expression was neutralized by the additional application of glutamate. After triple treatment with IFN-γ, TTX and glutamate only 32% of the hippocampal neurons expressed MHC class I products (Fig. 9 A). To significantly enhance MHC class I expression, TTX had to be present in the cultures for a minimum of 48 h.
Effect of TNF-α on Neuronal MHC Class I Expression.
Treatment of hippocampal neurons with 10 ng/ml TNF-α for 72 h did not result in overt changes of their electrophysiological parameters. Resting potential of TNF-α-treated neurons was 68.3 ± 7.8 mV (mean ± SE, n = 19) and thus was in the range of control untreated cells (65.3 ± 7.4 mV, n = 21). Frequency and firing patterns of action potentials of TNF-α-treated cells were indistinguishable from untreated hippocampal neurons.
TNF-α affects MHC class I related gene expression in a very restricted pattern. Within 24 h of treatment, the cytokine induced MHC class I heavy chain mRNA transcription in 14/15 neurons, and within 72 h in 20/20 hippocampal neurons (Fig. 7 B, Table 3). Remarkably, however, under the same conditions there was scarcely any concomitant enhanced transcription of β2-microglobulin, or TAP1/ TAP2 genes. Even more unexpected, additional treatment of neurons with TTX completely failed to enhance TNFα-mediated induction of TAP1/TAP2 (0/11 and 0/11) and β2-microglobulin (1/11) genes (Table 3). Finally, MHC class I molecules were not detectable on neuronal cells surfaces after treatment with TNF-α alone, TTX alone or their combination (Fig. 9 A).
Table 3.
Induction of MHC Class I Heavy Chain mRNA by TNF-α in Single Neurons (TNF-α 10 ng/ml, TTX 1 μM)
| Treatment | Neurons expressing mRNA for | |||||||
|---|---|---|---|---|---|---|---|---|
| MHC I | β2m | TAP1 | TAP2 | |||||
| TNF-α, 24 h | 93% | 13% | 0% | 0% | ||||
| 14/15 | 2/15 | 0/15 | 0/15 | |||||
| TNF-α, 72 h | 100% | 15% | 0% | 0% | ||||
| 20/20 | 3/20 | 0/20 | 0/20 | |||||
| TNF-α, 24 h + | ||||||||
| TTX, 24 h | 100% | 0% | 0% | 0% | ||||
| 9/9 | 0/9 | 0/9 | 0/9 | |||||
| TNF-α, 72 h + | ||||||||
| TTX, 72 h | 100% | 9% | 0% | 0% | ||||
| 11/11 | 1/11 | 0/11 | 0/11 | |||||
Discussion
This work studied the effect of two key proinflammatory cytokines, IFN-γ and TNF-α, on induction of MHC class I molecules in functionally intact neurons grown in cultures of dissociated embryonic rat hippocampus cells. This culture system proved especially useful for our studies, because it allows embryonic neurons to differentiate to a remarkable degree of maturity, as indicated by their morphological and electrophysiological properties. However, to reach this stage of differentiation, the neurons critically depend on the presence of a supportive monolayer of astrocytes. In mixed CNS cultures, it is difficult to distinguish between neuronal and glial gene expression. Hence, many investigations of neuronal MHC class I gene transcription were performed using clonally pure transformed neuronal cells (17– 19). However, interpretation of these data must take into account possible altered MHC class I gene regulation in the transformed cells (20). To distinguish neuronal from glial gene expression in mixed primary brain cultures we applied patch clamp electrophysiology (which identified nature and state of activity of a neuron) combined with RT-PCR of single cultured cells. This method, first described by Lambolez et al. (13), allows the correlation of electrical membrane activity of a cell with its actual gene expression pattern. Because of its high sensitivity, this technology requires rigorous controls of specificity (21). Apart from standard PCR controls, we included in our studies the amplification of positive and negative cell lineage markers. Indeed, cells which were characterized electrophysiologically as neurons contained mRNA for MAP2, a cytoskeletal marker specific for neurons, while samples from astrocytes contained mRNA for GFAP, but not MAP2.
Our study of direct cytokine effects on cultured neurons rested on the assumption that these neurons indeed express functional cytokine receptors. To verify this point, we applied primers selecting for cDNA of the chain of the rat IFN-γ receptor and for the p55 chain of the TNF-α receptor. In all cytoplasmic samples we found the classic rat p55 TNF-α receptor sequence (22), which is in accord with a previous report describing TNF-α receptor p55-like immunoreactivity in cultured rat hippocampal neurons (23). In contrast, the sequences of the rat IFN-γ receptor was not found in our accessible data bases. Using specific primers derived from the known mouse sequence we amplified from all neurons a sequence sharing 83% homology with the mouse and 66% homology to the human IFN-γ receptor chains, respectively. Identical PCR products were amplified from peripheral lymphoid tissues, which are known to express the classic IFN-γ receptor. Surface expression of the IFN-γ receptor α-chain in hippocampal neurons was confirmed by immunocytochemistry.
Stable surface expression of MHC class I molecules requires correct assembly of three components, the class I heavy chain (45-kD membrane anchored glycoproteins), the β2-microglobulin, and the antigenic peptides which are embedded in a groove formed by the heavy chain (24). Most peptides are derived from cytosolic proteins, which are degraded by proteasomes. MHC-linked TAP1/TAP2 peptide transporters translocate the peptides to the endoplasmic reticulum where they displace calnexin from the nascent class I complex (25). Our study of neuronal class I expression included the genes for the class I heavy chain and the TAP transporters, which are all contained within the MHC, along with independently located β2-microglobulin and calnexin genes.
We found that neuronal expression of MHC class I genes differs significantly from gene expression in other cells. Although intact neurons fail to express MHC class I determinants on their membranes, a significant proportion of the cells transcribe class I heavy chains, but not the other class I–related genes. Thus, in contrast to other cells (26), class I protein expression in neurons is not limited by the synthesis of heavy chains, but by β2-microglobulin and TAP1/TAP2 peptide transporter genes. This is reminiscent of tumors which lack membrane MHC class I expression due to a deficit of available β2-microglobulin (27) or TAP2 transporters. IFN-γ treatment induces class I–related genes in some but not in all cultured neurons (quantification of gene transcription in individual cells was, however, not feasible using our technology). Paralysis of neurons with TTX, leads to a dramatic induction of all class I–related genes and protein expression in all neurons.
In contrast to IFN-γ, TNF-α acts exclusively on class I heavy chain transcription, and, as reported by Israel et al. (28), does not affect expression of β2-microglobulin. This is in line with previous studies showing that the two genes are separately and differentially regulated in some tissues and during development (29). In contrast, transformed human neuroblastoma lines responded to both cytokines with enhanced transcription of class I heavy chain and β2-microglobulin (18). In human endothelial cell cultures, membrane expression of MHC class I protein is readily induced both by IFN-γ and by TNF-α (30), both cytokines acting via distinct activation pathways (31). Our data indicates that TNF-α alone is not sufficient to induce TAP1/TAP2 genes despite the fact that in humans and rodents, the described TAP1 gene promoter sequence includes an NFκB binding site (32).
Of special interest is the downregulatory effect of neural electric activity on cytokine induced class I gene expression. Electric membrane activity exerts manifold effects on gene expression, as revealed by numerous studies of cultured rodent neurons. For example, neuronal activity controls production of synaptic receptor isoforms (33, 34), synthesis of neurotrophins (35), and their receptors (36) and cell adhesion molecules (37, 38), and thus contributes to neuronal plasticity, the structural basis of learning and memory.
We found that the effect of TTX on MHC inducibility is reversed by activation of glutamate receptors. This, however, does not necessarily imply neurotransmitters as sole mediators involved in activity-dependent regulation of MHC class I expression. It is not even known, whether MHC class I gene control implies cell-to-cell interactions i.e., whether exogenous signals are required for a cell to suppress class I gene transcription, or whether electric membrane activity acts on gene expression within the same cell. In neurons, activity-dependent gene induction is predominantly governed by modulation of topical calcium concentration which can be brought about through activation of calcium channels to import extracellular calcium, or by release from intracellular calcium stores. Depending on location and levels, changes of calcium levels may result in radically different effects on gene expression (39). Although not formally proven in our work, it appears reasonable to assume that calcium also has a pivotal role in connecting membrane activity depending and cytokine mediated regulation of neuronal MHC class I expression. Distinct effects of calcium on IFN-γ signaling, and on TNF-α signal transduction pathways may be responsible for the distinct and characteristic effects of both cytokines on neuronal MHC class I expression. Indeed, both signaling pathways are workable in neurons, as shown recently for JAK/Stat1 and IFN-γ (Neumann, H., unpublished results) and signs of NFκB activation (40) which can be augmented by TNF-α (41).
In their entirety, our results reveal unexpected effects of two major proinflammatory cytokines on MHC class I gene expression in electrically active CNS neurons. The findings shed light on the cellular organization of immune reactivity within the brain, and, in addition, may help to better understand the impact of electric membrane activity on cellular gene expression.
Acknowledgments
We thank Ms. Lydia Penner for expert technical assistance, Dr. G. Kääb for T cells line, Dr. K. Wonigeit for technical advice, and Dr. W. Lesslauer for critically reading the manuscript.
Footnotes
The project was supported by DFG (SFB 391) and EC Contract CHRX-CT94-0670.
1 Abbreviations used in this paper: BME, basal medium; CNS, central nervous system; GAPDH, glyceraldehyde-3-phosphate dehydrogenase; GFAP, glial fibrillary acidic protein; MAP2, microtubulin-associated-protein-2; NS, nervous system.
References
- 1.Mehler MF, Rozental R, Dougherty R, Spray DC, Kessler JA. Cytokine regulation of neuronal differentiation of hippocampal progenitor cells. Nature (Lond) 1993;362:62–65. doi: 10.1038/362062a0. [DOI] [PubMed] [Google Scholar]
- 2.Jonakait GM, Wei R, Sheng Z-L, Hart RP, Ni L. Interferon-y promotes cholinergic differentiation of embryonic septal nuclei and adjacent forebrain. Neuron. 1994;12:1149–1159. doi: 10.1016/0896-6273(94)90322-0. [DOI] [PubMed] [Google Scholar]
- 3.Toledo-Aral JJ, Brehm P, Halegoua S, Mandel G. A single pulse of nerve growth factor triggers longterm neuronal excitability through sodium channel gene induction. Neuron. 1995;14:607–611. doi: 10.1016/0896-6273(95)90317-8. [DOI] [PubMed] [Google Scholar]
- 4.Calvet M-C, Gresser I. Interferon increases the excitability of cultured neurons. Nature (Lond) 1979;278:558–560. doi: 10.1038/278558a0. [DOI] [PubMed] [Google Scholar]
- 5.Soliven B, Albert J. Tumor necrosis factor modulates Ca2+currents in cultured sympathetic neurons. J Neurosci. 1992;12:2665–2671. doi: 10.1523/JNEUROSCI.12-07-02665.1992. [DOI] [PMC free article] [PubMed] [Google Scholar]
- 6.Müller M, Fontana A, Zbinden G, Gähwiler BH. Effects of interferons and hydrogen peroxide on CA3 pyramidal cells in rat hippocampal slice cultures. Brain Res. 1993;619:157–162. doi: 10.1016/0006-8993(93)91607-t. [DOI] [PubMed] [Google Scholar]
- 7.Dinarello CA, Cannon JG, Wolff SM, Bernheim HA, Beutler B, Cerami A, Palladino MA, O'Connor JV. Tumor necrosis factor (cachectin) is an endogenous pyrogen and produces production of interleukin-1. J Exp Med. 1986;163:1433–1450. doi: 10.1084/jem.163.6.1433. [DOI] [PMC free article] [PubMed] [Google Scholar]
- 8.Plata-Salamán CR, Oomura Y, Kai Y. Tumor necrosis factor and interleukin-1: Suppression of food intake by direct action in the central nervous system. Brain Res. 1988;448:106–114. doi: 10.1016/0006-8993(88)91106-7. [DOI] [PubMed] [Google Scholar]
- 9.Krueger JM, Majde JA. Microbial products and cytokines in sleep and fever regulation. CRC Crit Rev Immunol. 1994;14:355–379. doi: 10.1615/critrevimmunol.v14.i3-4.70. [DOI] [PubMed] [Google Scholar]
- 10.Neumann H, Cavalié A, Jenne DE, Wekerle H. Induction of MHC class I genes in neurons. Science (Wash DC) 1995;269:549–552. doi: 10.1126/science.7624779. [DOI] [PubMed] [Google Scholar]
- 11.Banker GA, Cowan WM. Rat hippocampal neurons in dispersed cell culture. Brain Res. 1977;126:397–425. doi: 10.1016/0006-8993(77)90594-7. [DOI] [PubMed] [Google Scholar]
- 12.Hamill OP, Marty A, Neher E, Sakmann B, Sigworth FJ. Improved patch-clamp techniques for high-resolution current recording from cells and cell-free membrane patches. Pflügers Arch. 1981;391:85–100. doi: 10.1007/BF00656997. [DOI] [PubMed] [Google Scholar]
- 13.Lambolez B, Audinat E, Bochet P, Crépel F, Rossier J. AMPA receptor subunits expressed by single Purkinje cells. Neuron. 1992;9:247–258. doi: 10.1016/0896-6273(92)90164-9. [DOI] [PubMed] [Google Scholar]
- 14.Kääb G, Brandl G, Marx A, Wekerle H, Bradl M. The myelin basic protein specific T cell repertoire in (transgenic) Lewis rat/SCID mouse chimeras: preferential Vβ8.2 T cell receptor usage depends on an intact Lewis thymic microenvironment. Eur J Immunol. 1996;26:981–988. doi: 10.1002/eji.1830260504. [DOI] [PubMed] [Google Scholar]
- 15.Chomczynski P, Sacchi N. Single-step method of RNA isolation by acid guanidium thiocyanate-phenolchloroform extraction. Anal Biochem. 1987;162:156–159. doi: 10.1006/abio.1987.9999. [DOI] [PubMed] [Google Scholar]
- 16.Kwok S, Higuchi R. Avoiding false positives with PCR. Nature (Lond) 1989;339:237–238. doi: 10.1038/339237a0. [DOI] [PubMed] [Google Scholar]
- 17.Joly E, Oldstone MBA. Neuronal cells are deficient in loading peptides onto MHC class I molecules. Neuron. 1992;8:1185–1190. doi: 10.1016/0896-6273(92)90138-4. [DOI] [PubMed] [Google Scholar]
- 18.Drew PD, Lonergan M, Goldstein ME, Lampson LA, Ozato K, McFarlin DE. Regulation of MHC class I and β2 microglobulin gene expression in human neuronal cells. Factor binding to conserved cis-acting regulatory sequences correlates with expression of the genes. J Immunol. 1993;150:3300–3310. [PubMed] [Google Scholar]
- 19.Dhib-Jalbut SS, Xia Q, Drew PD, Swoveland PT. Differential up-regulation of HLA class I molecules on neuronal and glial cell lines by virus infection correlates with differential induction of IFN-β. J Immunol. 1995;155:2096–2108. [PubMed] [Google Scholar]
- 20.Lenardo M, Rustgi AK, Schievella R, Bernards R. Suppression of MHC class I expression by N-mycthrough enhancer inactivation. EMBO (Eur Mol Biol Organ) J. 1989;8:3351–3355. doi: 10.1002/j.1460-2075.1989.tb08497.x. [DOI] [PMC free article] [PubMed] [Google Scholar]
- 21.Monyer H, Lambolez B. Molecular biology and physiology at the single-cell level. Curr Opin Neurobiol. 1995;5:382–387. doi: 10.1016/0959-4388(95)80052-2. [DOI] [PubMed] [Google Scholar]
- 22.Himmler A, Maurer-Fogy I, Krönke M, Scheurich P, Pfizenmaier K, Lantz M, Olsson I, Hauptmann R, Stratowa C, Adolf GR. Molecular cloning and expression of human and rat tumor necrosis factor receptor chain (p60) and its soluble derivative, tumor necrosis factor binding protein. DNA Cell Biol. 1990;9:705–715. doi: 10.1089/dna.1990.9.705. [DOI] [PubMed] [Google Scholar]
- 23.Cheng B, Christakos S, Mattson MP. Tumor necrosis factors protect neurons against metabolic-excitotoxic insults and promote maintenance of calcium homeostasis. Neuron. 1994;12:139–153. doi: 10.1016/0896-6273(94)90159-7. [DOI] [PubMed] [Google Scholar]
- 24.Bjorkman PJ, Saper MA, Samraoui B, Bennett WS, Strominger JL, Wiley DC. The foreign antigen binding site and T cell recognition regions of class I histocompatibility antigens. Nature (Lond) 1987;329:512–518. doi: 10.1038/329512a0. [DOI] [PubMed] [Google Scholar]
- 25.York IA, Rock KL. Antigen processing and presentation by the class I major histocompatibility complex. Annu Rev Immunol. 1996;14:369–396. doi: 10.1146/annurev.immunol.14.1.369. [DOI] [PubMed] [Google Scholar]
- 26.Epperson DE, Arnold D, Spies T, Cresswell P, Pober JS, Johnson DR. Cytokines increase transporter in antigen processing-1 expression more rapidly than HLA class I expression in endothelial cells. J Immunol. 1992;149:3297–3301. [PubMed] [Google Scholar]
- 27.Tanaka K, Yoshioka T, Bieberich C, Jay G. Role of the major histocompatibility complex class I antigens in tumor growth and metastasis. Annu Rev Immunol. 1988;6:359–380. doi: 10.1146/annurev.iy.06.040188.002043. [DOI] [PubMed] [Google Scholar]
- 28.Israël A, Le Bail O, Hatat D, Piette J, Kieran M, Logeat F, Wallach D, Fellous M, Kourilsky P. TNF stimulates expression of mouse MHC class I genes by inducing an NFkB-like enhancer binding activity which displaces constitutive factors. EMBO (Eur Mol Biol Organ) J. 1989;12:3793–3800. doi: 10.1002/j.1460-2075.1989.tb08556.x. [DOI] [PMC free article] [PubMed] [Google Scholar]
- 29.Morello D, Duprey P, Israël A, Babinet C. Asynchronous regulation of mouse H-2D and beta-2 microglobulin. Immunogenetics. 1984;22:441–452. doi: 10.1007/BF00418090. [DOI] [PubMed] [Google Scholar]
- 30.Collins T, Lapierre LA, Fiers W, Strominger JL, Pober JS. Recombinant human tumor necrosis factor increases mRNA levels and surface expression of HLA-A,B antigens in vascular endothelial cells and dermal fibroblasts in vitro. Proc Natl Acad Sci USA. 1986;83:446–450. doi: 10.1073/pnas.83.2.446. [DOI] [PMC free article] [PubMed] [Google Scholar]
- 31.Johnson DR, Pober JS. Tumor necrosis factor and immune interferon synergistically increase transcription of HLA class I heavy chain and light chain genes in vascular endothelium. Proc Natl Acad Sci USA. 1990;87:5183–5187. doi: 10.1073/pnas.87.13.5183. [DOI] [PMC free article] [PubMed] [Google Scholar]
- 32.Wright KL, White LC, Kelly A, Beck S, Trowsdale J, Ting JP-Y. Coordinate regulation of the human TAP1 and LMP2 genes from a shared bidirectional promoter. J Exp Med. 1995;181:1459–1471. doi: 10.1084/jem.181.4.1459. [DOI] [PMC free article] [PubMed] [Google Scholar]
- 33.Mackler SA, Brooks BP, Eberwine JH. Stimulus-induced coordinate changes in mRNA abundance in single postsynaptic hippocampal CA1 neurons. Neuron. 1993;9:539–548. doi: 10.1016/0896-6273(92)90191-f. [DOI] [PubMed] [Google Scholar]
- 34.Audinat E, Lambolez B, Rossier J, Crépel F. Activity-dependent regulation of N-methyl-d-aspartate receptor subunit expression in rat cerebellar granule cells. Eur J Neurosci. 1994;6:1792–1800. doi: 10.1111/j.1460-9568.1994.tb00572.x. [DOI] [PubMed] [Google Scholar]
- 35.Thoenen H. Neurotrophins and neuronal plasticity. Science (Wash DC) 1995;270:593–598. doi: 10.1126/science.270.5236.593. [DOI] [PubMed] [Google Scholar]
- 36.Lindholm D, Castrén E, Berzaghi M, Blöchl A, Thoenen H. Activity-dependent and hormonal regulation of neutrotrophin mRNA levels in the brain—implications for neuronal plasticity. J Neurobiol. 1994;25:1362–1372. doi: 10.1002/neu.480251105. [DOI] [PubMed] [Google Scholar]
- 37.Kiss JZ, Wang C, Olive S, Rougon G, Lang J, Baetens D, Harry D, Pralong W-F. Activity-dependent mobilization of the adhesion molecule polysialic NCAM to the cell surface of neurons and endocrine cells. EMBO (Eur Mol Biol Organ) J. 1994;13:5284–5292. doi: 10.1002/j.1460-2075.1994.tb06862.x. [DOI] [PMC free article] [PubMed] [Google Scholar]
- 38.Itoh K, Stevens B, Schachner M, Fields RD. Regulated expression of the neural cell adhesion molecule L1 by specific patterns of neural impulses. Science (Wash DC) 1995;270:1369–1372. doi: 10.1126/science.270.5240.1369. [DOI] [PubMed] [Google Scholar]
- 39.Ghosh A, Greenberg ME. Calcium signalling in neurons: Molecular mechanisms and cellular consequences. Science (Wash DC) 1995;268:239–247. doi: 10.1126/science.7716515. [DOI] [PubMed] [Google Scholar]
- 40.Kaltschmidt C, Kaltschmidt B, Neumann H, Wekerle H, Baeuerle P. Constitutive NF-kB activity in neurons. Mol Cell Biol. 1994;14:3981–3992. doi: 10.1128/mcb.14.6.3981. [DOI] [PMC free article] [PubMed] [Google Scholar]
- 41.Barger SW, Hörster D, Furukawa K, Goodman Y, Krieglstein J, Mattson MP. Tumor necrosis factors α and β protect neurons against amyloid β-peptide toxicity: evidence for involvement of a kB-binding factor and attenuation of peroxide and Ca2+accumulation. Proc Natl Acad Sci USA. 1995;92:9328–9332. doi: 10.1073/pnas.92.20.9328. [DOI] [PMC free article] [PubMed] [Google Scholar]