Abstract
Calreticulin is a Ca2+-binding chaperone in the endoplasmic reticulum (ER), and calreticulin gene knockout is embryonic lethal. Here, we used calreticulin-deficient mouse embryonic fibroblasts to examine the function of calreticulin as a regulator of Ca2+ homeostasis. In cells without calreticulin, the ER has a lower capacity for Ca2+ storage, although the free ER luminal Ca2+ concentration is unchanged. Calreticulin-deficient cells show inhibited Ca2+ release in response to bradykinin, yet they release Ca2+ upon direct activation with the inositol 1,4,5-trisphosphate (InsP3). These cells fail to produce a measurable level of InsP3 upon stimulation with bradykinin, likely because the binding of bradykinin to its cell surface receptor is impaired. Bradykinin binding and bradykinin-induced Ca2+ release are both restored by expression of full-length calreticulin and the N + P domain of the protein. Expression of the P + C domain of calreticulin does not affect bradykinin-induced Ca2+ release but restores the ER Ca2+ storage capacity. Our results indicate that calreticulin may play a role in folding of the bradykinin receptor, which affects its ability to initiate InsP3-dependent Ca2+ release in calreticulin-deficient cells. We concluded that the C domain of calreticulin plays a role in Ca2+ storage and that the N domain may participate in its chaperone functions.
Keywords: calreticulin-deficient cells; calcium homeostasis; chaperone; bradykinin receptor; endoplasmic reticulum
Introduction
Calreticulin is a Ca2+-binding chaperone found in the lumen of the endoplasmic reticulum (ER)* (Michalak et al., 1999). The protein binds monoglucosylated oligosaccharides (Bergeron et al., 1994; Helenius et al., 1997) and misfolded proteins (Saito et al., 1999), and it is believed to play a critical role in quality control processes during protein synthesis and folding (Helenius et al., 1997). Several studies indicate that increased expression of calreticulin increases the Ca2+ storage capacity of the ER (Michalak et al., 1999). It also appears to modulate store-operated Ca2+ influx (Bastianutto et al., 1995; Mery et al., 1996; Fasolato et al., 1998; Xu et al., 2000) and to alter Ca2+ transport by the sarcoplasmic/endoplasmic reticulum Ca2+-ATPase, SERCA2b (John et al., 1998). Evidence now indicates that Ca2+-binding chaperones in the lumen of the ER affect luminal Ca2+ concentrations ([Ca2+]ER) (Meldolesi and Pozzan, 1998) and that agonist-induced changes in [Ca2+]ER affect ER function (Corbett and Michalak, 2000).
Mice homozygous for calreticulin gene disruption (crt − /−) showed a marked decrease in ventricular wall thickness and in deep intertrabecular recesses in the ventricular walls, indicating that calreticulin is essential for proper cardiac development (Mesaeli et al., 1999; Rauch et al., 2000). Agonist-induced Ca2+ release via the inositol 1,4,5-trisphosphate (InsP3) pathway is inhibited in crt − /− cells as is Ca2+-dependent translocation of nuclear factor in activated T cells (Mesaeli et al., 1999). These results indicate that calreticulin, in addition to being a chaperone, plays a critical role in Ca2+ homeostasis.
In these studies, we used calreticulin-deficient mouse embryonic fibroblasts to examine the in vivo function of calreticulin as a regulator of Ca2+ homeostasis. In cells without calreticulin, the ER has a lower capacity for storage of Ca2+, although the free [Ca2+]ER as measured by an ER-targeted “cameleon” reporter is not changed. Bradykinin-induced Ca2+ release is inhibited in calreticulin-deficient cells, yet they release Ca2+ in response to InsP3. Apparently, crt − /− cells fail to produce measurable levels of InsP3 in response to bradykinin, likely because of impaired binding of bradykinin to its cell surface receptor. Our findings suggest that in calreticulin-deficient cells altered folding of the bradykinin receptor adversely affects its ability to initiate InsP3-dependent Ca2+ release and that different domains of calreticulin may play distinct functions in the lumen of ER.
Results
Calreticulin-deficient mouse embryonic fibroblasts
To determine the effects of calreticulin deficiency on ER function, we isolated mouse embryonic fibroblasts from crt − /− and wild-type embryos. These cell lines were designated K41 for wild-type mouse embryonic fibroblasts and K42 for calreticulin-deficient mouse embryonic fibroblasts. Some of the calreticulin-deficient cells (K42) were also transfected with a calreticulin expression vector and were designated K42CRT. As expected, Western blot analysis revealed that the K41 and K42CRT cells contained immunoreactive calreticulin (Fig. 1 A, lanes 1 and 3), whereas the K42 crt − /− cells did not (Fig. 1 A, lane 2). The morphological appearance of the wild-type (K41) and calreticulin-deficient (K42) cells was indistinguishable and typical of fibroblasts (Fig. 1 B). The cell lines all attached firmly to plastic, and we detected no differences in the kinetics of their long-term (14 d) growth (unpublished data). Fig. 1 C shows that K41 and K42CRT cells both expressed calreticulin and that the protein was localized to an ER-like network. As expected, there was no expression of calreticulin in K42 cells. Morphologically, at a light microscope level the ER appeared intact in all cell lines as judged by staining with antibodies against protein disulfide isomerase (PDI) and Grp94 (Fig. 1 C). We observed typical nuclear morphology in all of the cell lines and the actin cytoskeleton visualized by labeling with fluorescent phalloidin also appeared normal (unpublished data).
Figure 1.
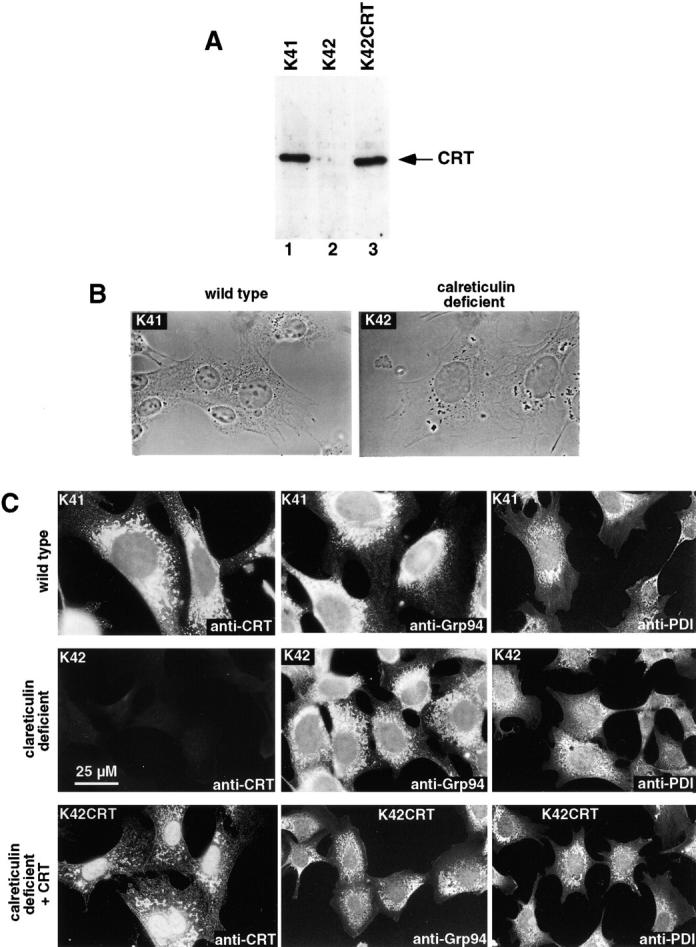
Calreticulin-deficient mouse embryonic fibroblasts. (A) Western blot analysis of calreticulin in mouse embryonic fibroblasts. Wild-type (K41) and calreticulin-deficient (K42) cells were lysed, and proteins were separated by SDS-PAGE, transferred to nitrocellulose membrane, and probed with anticalreticulin antibodies. Lane 1, wild-type K41 mouse embryonic fibroblasts; lane 2, calreticulin-deficient (crt− /−) K42 mouse embryonic fibroblasts; lane 3, calreticulin-deficient fibroblasts transfected with expression vector containing cDNA encoding calreticulin (K42CRT). (B) Phase–contrast analysis of K41 and K42 cells. (C) Immunostaining of K41, K42, and K42CRT cells with anti-CRT, anti-Grp94, and anti-PDI antibodies.
[Ca2+]ER capacity in calreticulin-deficient cells
The overexpression of calreticulin leads to an increased total Ca2+ content in the lumen of the ER (Michalak et al., 1999). This indicates that calreticulin somehow alters the Ca2+ storage capacity of the ER. Therefore, we used 45Ca2+ to estimate the Ca2+ content of the ER in calreticulin-deficient cells (Mery et al., 1996). Wild-type cells (K41) contained 44 ± 3 pmol of Ca2+/106 cells, whereas the calreticulin-deficient cells (K42) contained 24 ± 4 pmol of Ca2+/106 cells. Thus, the absence of calreticulin resulted in a >1.8-fold reduction in cellular Ca2+ content.
Next, we used thapsigargin, an inhibitor of the Ca2+-ATPase, to measure the amount of Ca2+ associated with rapidly exchangeable stores. To measure the residual amounts of Ca2+ contained within thapsigargin-insensitive stores, we added the Ca2+ ionophore ionomycin. In these experiments, cells were equilibrium loaded with 45Ca2+ and then resuspended in a nonradioactive Ca2+-free medium (Mery et al., 1996). Fig. 2 shows that in response to thapsigargin the wild-type cells (K41) released almost twice as much 45Ca2+ as the calreticulin-deficient cells (K42). When the remaining 45Ca2+ was released with ionomycin, the amount released from K41 cells was greater than from K42 cells (Fig. 2 A). Fig. 2 A also shows that there was an increase in Ca2+ release in the presence of ionomycin compared with thapsigargin alone. This is likely due to ionomycin-dependent Ca2+ release from intracellular compartments other than ER including mitochondria. To confirm that the absence of calreticulin caused the decreased Ca2+ content of the K42 cells, some K42 cells were stably transfected with a calreticulin expression vector, creating the K42CRT cell line (Fig. 1). Fig. 2 A shows that the Ca2+ content of thapsigargin-sensitive stores was indistinguishable in K42CRT and wild-type (K41) cells. We conclude that the absence of calreticulin in K42 cells causes a significant decrease in the Ca2+ content of thapsigargin-sensitive stores.
Figure 2.
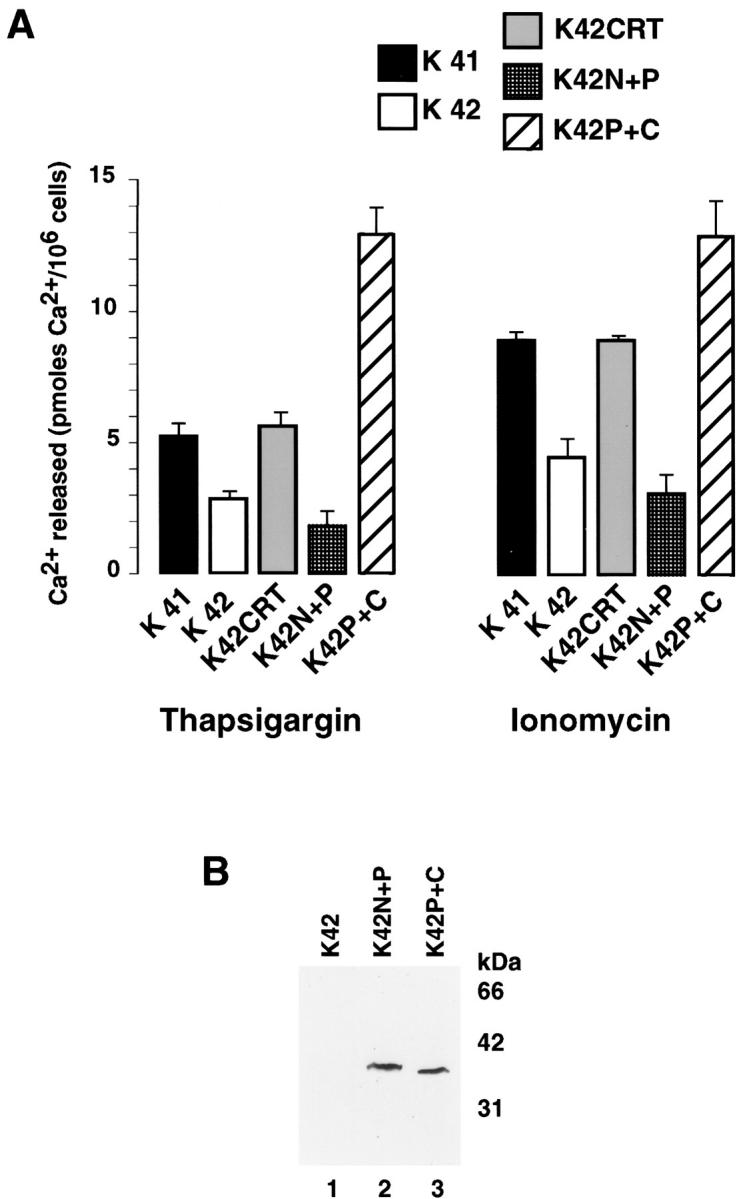
ER Ca2 + content in calreticulin-deficient cells. Calreticulin-deficient cells (K42) were transfected with expression vectors encoding calreticulin or calreticulin domains followed by measurement of a total cellular Ca2+. (A) A total cellular Ca2+ content was determined using equilibrium incubation with 45Ca2+ followed by addition of thapsigargin (estimates Ca2+ pool in thapsigargin-sensitive Ca2+ stores) or ionomycin (estimates Ca2+ pool in thapsigargin-insensitive Ca2+ stores) (Mery et al., 1996). Ca2+ content was measured in wild-type (K41), crt− /− (K42), and K42 cells transfected with expression vectors encoding either calreticulin (K42CRT), the N + P domain of calreticulin (K42N+P), or the P + C domain of the protein (K42P+C). Data shown are means ± SE (n = 3). (B) Western blot analysis with anti-HA tag antibodies of K42 calreticulin-deficient cells expressing calreticulin domains. Lane 1, calreticulin-deficient cells (K42); lane 2, K42 cells transfected with expression vectors encoding the N + P domain of calreticulin (K42N+P); lane 3, K42 transfected with expression vector encoding the P + C domain of the protein (K42P+C). Similar levels of both, the 38-kD N + P domain and the 36-kD P + C domain were expressed in transfected cells.
The C domain of calreticulin affects ER Ca2+ storage capacity in vivo
K42 (crt − /−) cells provide us with an excellent tool for investigating the role of calreticulin's different domains in determining ER Ca2+ storage capacity in vivo. Calreticulin binds Ca2+ with high capacity to its COOH-terminal domain (Michalak et al., 1999), but the effects of this binding have not been documented in vivo. To investigate the effect of calreticulin's C domain on the Ca2+ storage capacity of thapsigargin-sensitive stores, we transfected K42 (calreticulin-deficient) cells with expression vectors encoding different domains of the protein. cDNA encoding N + P and P + C domain of calreticulin contained HA epitope for immunological detection of the recombinant proteins. Using anti-HA tag antibodies, we showed that calreticulin-deficient cells transfected with expression vectors encoding N + P or P + C domain expressed similar levels of both recombinant proteins (Fig. 2 B). Despite numerous attempts, we have been unable to create a K42 (calreticulin-deficient) cell line expressing the C domain of calreticulin alone. Attempts to create other cell lines that overexpress the C domain of calreticulin (HeLa, HEK293, CHO) have also failed. This is probably because the C domain, when expressed alone, is very unstable (Corbett et al., 2000). However, we can express the C domain of calreticulin when the central P domain is also included (Fig. 2 B, lane 3). Although the P domain of calreticulin also binds Ca2+, it binds only 1 mol/mol of protein with high affinity (Michalak et al., 1999). Fig. 2 A shows that expression of the P + C domain in calreticulin-deficient K42 cells (K42P+C) dramatically increased thapsigargin-sensitive Ca2+ release compared with that seen in the parental K42 cell line. This indicates that the P + C domain of calreticulin modulates ER Ca2+ storage capacity. The reason for unusually high ER Ca2+ in the P + C domain–expressing cells is not clear at present. This may be due to an increased Ca2+ capacity of the P + C domain in the ER lumen in the absence of the N domain of calreticulin.
Next, we created K42 (calreticulin-deficient) cell lines expressing the N + P domain of calreticulin (Fig. 2 A, K42N+P). We found no significant difference in Ca2+ storage capacity in K42 and K42N+P cells (Fig. 2 A), indicating that neither the N domain nor the P domain of calreticulin modulates thapsigargin-sensitive (ER) Ca2+ storage capacity. Our results show that calreticulin via its C domain plays a role in determining the Ca2+ storage capacity of the ER.
Free [Ca2+]ER in calreticulin-deficient cells
To determine the free [Ca2+]ER in calreticulin-deficient cells, we transfected wild-type (K41) and calreticulin-deficient (K42) mouse embryonic fibroblasts with the ER-targeted cameleon YC4ER (Arnaudeau et al., 2001), a Ca2+ indicator, which relies on fluorescent proteins and calmodulin (Miyawaki et al., 1997). Fig. 3 A shows that the cameleon was expressed in both cell types and was localized in a reticular pattern consistent with labeling of the ER. Fig. 3 B shows that the free [Ca2+]ER did not differ significantly in the wild-type cells (290 ± 18 μM Ca2+; mean ± SE; n = 18) and calreticulin-deficient cells (288 ± 20 μM Ca2+; mean ± SE; n = 22). In further studies, we used thapsigargin and ionomycin to completely deplete cellular Ca2+stores. Under these conditions, free [Ca2+]ER was reduced to 27 ± 3 μM Ca2+ (mean ± SE; n = 15) in the wild-type cells and to 23 ± 3 μM Ca2+ (mean ± SE) in the calreticulin-deficient cells (Fig. 3 B). Our results indicate that although the total Ca2+ content of the ER is significantly decreased in calreticulin-deficient cells, the free [Ca2+]ER is unaltered both when Ca2+ stores are full and when they are depleted.
Figure 3.
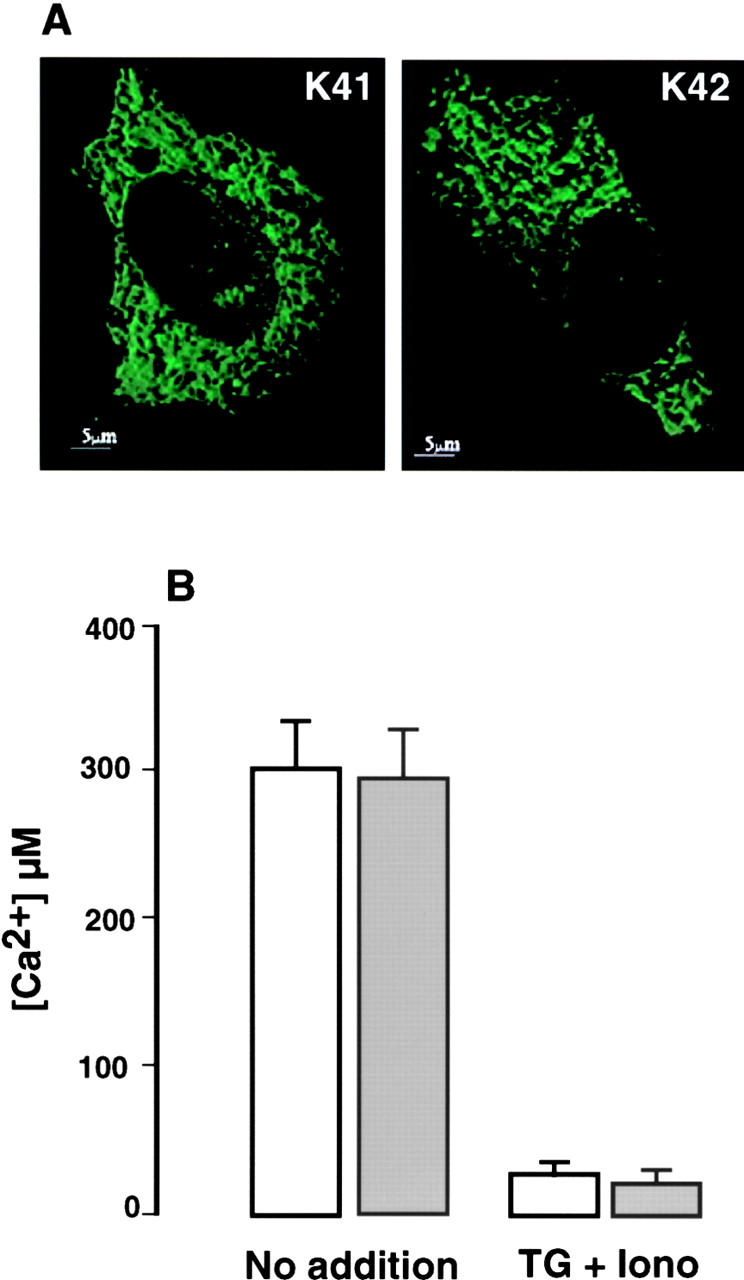
Free ER Ca2 + luminal concentration in K41 wild-type and K42 calreticulin-deficient cells. Cells were transiently transfected with YC4ER and the ratio fluorescence calibrated to [Ca2+]ER using calibration curves obtained in situ (Arnaudeau et al., 2001). (A) Intracellular distribution of ER-targeted cameleon in wild-type (K41) and calreticulin-deficient (K42) cells. (A) Single wavelength cameleon fluorescence (emission at 535 nm) imaging of transfected cells revealing reticular pattern reminiscent of the ER. (B) Free [Ca2+]ER in K41 wild-type (white bars) and K42 calreticulin-deficient (gray bars) cells was measured with ER-targeted cameleon as described under Materials and methods. TG, thapsigargin; iono, ionomycin. Data are derived from 15–22 independent experiments.
Bradykinin-induced Ca2+ release in calreticulin-deficient cells
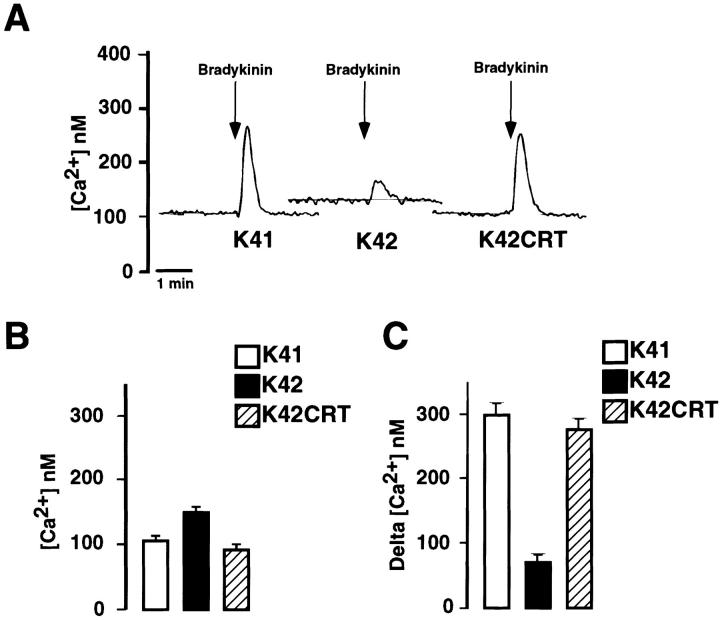
We next performed experiments with the Ca2+-sensitive fluorescent dye fura-2. Fig. 4 shows that in wild-type (K41) cells, the resting free cytoplasmic Ca2+ concentration ([Ca2+]c) was ∼100 ± 12 nM (mean ± SD; n = 3). In calreticulin-deficient fibroblasts (K42), the resting free [Ca2+]c was significantly increased (148 ± 10 nM; mean ± SD; n = 3). We also performed fura-2 analysis of [Ca2+]c in calreticulin-deficient mouse embryonic fibroblasts, which had been transfected with a calreticulin expression vector (K42CRT cells). These cells, which express recombinant calreticulin, had 108 ± 13 nM (mean ± SD; n = 3) basal [Ca2+]c, indicating that reintroduction of calreticulin to calreticulin-deficient cells lowered the basal [Ca2+]c to the levels observed in the wild-type (K41) cells (Fig. 4, A and B).
Figure 4.
Bradykinin-induced Ca2 + release in calreticulin-deficient cells. Cells were loaded with the fluorescent Ca2+ indicator fura-2 and stimulated with 200 nM bradykinin. K41, wild-type mouse embryonic fibroblasts; K42, calreticulin-deficient cells; K42CRT, K42 cells transfected with calreticulin expression vector. (A) Represents typical traces showing bradykinin (BK) stimulation of cells in a Ca2+-free medium. Arrows indicate the time of addition of bradykinin. (B) Basal [Ca2+]c in wild-type (white bar), calreticulin- deficient (black bar), and calreticulin-deficient cells transfected with calreticulin expression vector (hatched bar). The absolute values of [Ca2+]c were: 100 ± 12 nM (K41), 148 ± 10 nM (crt− /− K42), and 95 ± 8 nM (crt− /− + CRT, K42CRT). (C) Ca2+ released by bradykinin was significantly different in cell lines investigated. K41, wild-type mouse embryonic fibroblasts; K42, calreticulin-deficient cells; K42CRT, K42 cells transfected with calreticulin expression vector. Data are mean ± SE (n = 3).
Next, we compared agonist-induced Ca2+ release in wild-type (K41) and calreticulin-deficient fibroblasts (K42). In preliminary experiments, we tested the effect of 100 μM carbachol, 1 μM angiotensin II, 50 nM bombesin, 200 nM bradykinin, and 25 ng PDGF/ml on Ca2+ release from the wild-type cells. Among all these agonists, only bradykinin resulted in Ca2+ release from the K41 cells, and so it was used in our subsequent experiments. Furthermore, in full agreement with our earlier report (Mesaeli et al., 1999) bradykinin caused a rapid and transient increase in the cytoplasmic Ca2+ concentration in wild-type (K41) cells but not in crt − /− (K42) cells, indicating that Ca2+ release via InsP3-dependent pathways is impaired in calreticulin-deficient cells (Fig. 4, A and C). To show that calreticulin is involved in this impairment, we investigated bradykinin-induced Ca2+ release in K42CRT cells. Fig. 4, A and C, show that the expression of calreticulin in K42 cells restored bradykinin-stimulated Ca2+ release. Importantly, the basal [Ca2+]c was also decreased to levels observed in wild-type cells (Fig. 4, A and B).
In further experiments, we used a cameleon reporter to make time-resolved measurements of free [Ca2+]ER in wild-type and calreticulin-deficient cells. Bradykinin by itself had little effects on [Ca2+]ER (unpublished data) but caused a rapid [Ca2+]ER decrease when thapsigargin was included to prevent ER refilling (Fig. 5 A). A pronounced Ca2+ release was observed in wild-type cells, the [Ca2+]ER decreasing to 80 ± 12 μM within 150 s. (Fig. 5 C). Subsequent addition of ionomycin had little effects on the kinetics of the [Ca2+]ER response (Fig. 5 A), indicating the ER Ca2+ permeability was maximally activated by the combination of bradykinin and thapsigargin. In contrast, the addition of bradykinin and thapsigargin to calreticulin-deficient cells decreased [Ca2+]ER only to 114 ± 18 μM (Fig. 5 C), and subsequent addition of ionomycin caused a further decrease in [Ca2+]ER (Fig. 5 A). No differences were observed when thapsigargin was added alone, the [Ca2+]ER decreasing with similar kinetics and to similar levels in wild-type and calreticulin-deficient cells (Fig. 5, B and C). The higher [Ca2+]ER measured in calreticulin-deficient cells stimulated with bradykinin and thapsigargin thus likely reflects the failure of bradykinin to increase the ER Ca2+ permeability. These observations are in keeping with the fura-2 measurements presented in Fig. 4 and indicate that bradykinin-induced Ca2+ release from the ER is impaired in the calreticulin-deficient K42 cells.
Figure 5.
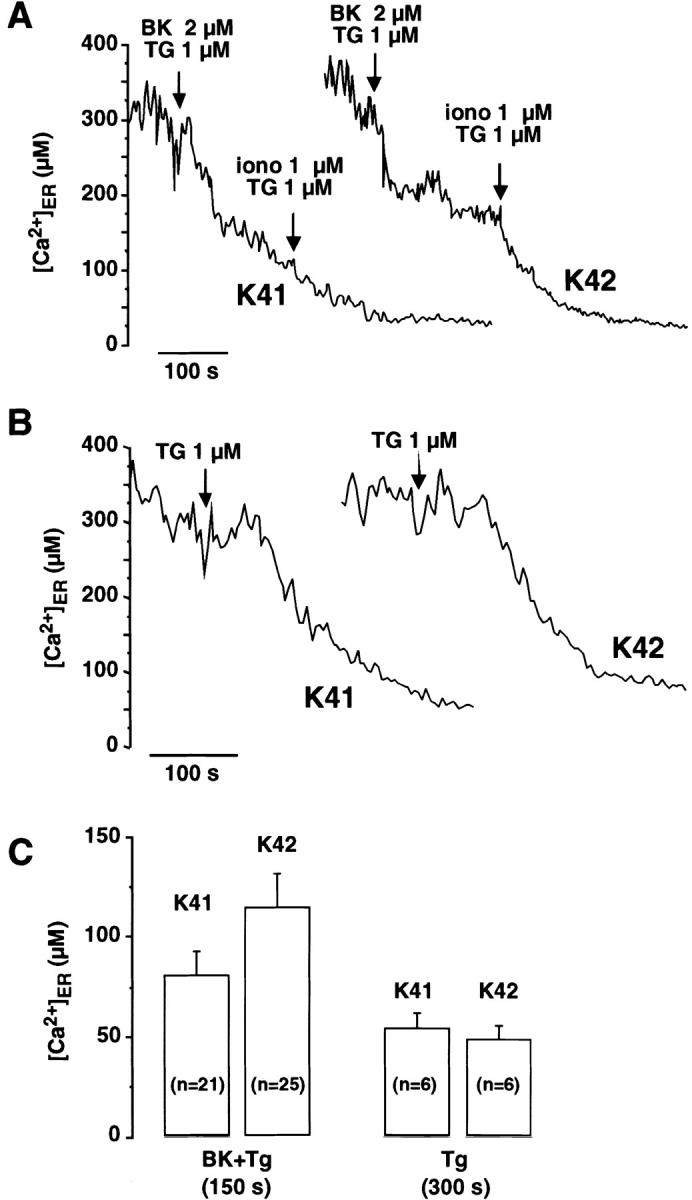
Free [Ca2 + ]ER responses in bradykinin- and thapsigargin-stimulated cells. Wild-type (K41) and calreticulin-deficient (K42) cells were transiently transfected with YC4ER expression vector. A and B show the time-course of spatially averaged [Ca2+]ER responses in cells stimulated with bradykinin and thapsigargin (BK + TG) or with thapsigargin alone. The responses were measured in Ca2+-free medium. When indicated, ionomycin (1 μM) was added to maximally deplete ER Ca2+ stores. (C) [Ca2+]ER levels measured shortly after stimulation with bradykinin/thapsigargin or after full depletion of stores with thapsigargin. The absolute values were: 80 ± 12 μM (K41) and 114 ± 18 μM (K42) for BK + TG, and 44 ± 5 μM (K41) 53 ± 7 μM (K42) for depletion with TG. BK, bradykinin; TG, thapsigargin; iono, ionomycin. Data are mean ± SE. n, number of experiments.
SERCA2, the InsP3 receptor (InsP3R) and the bradykinin receptor in calreticulin-deficient cells
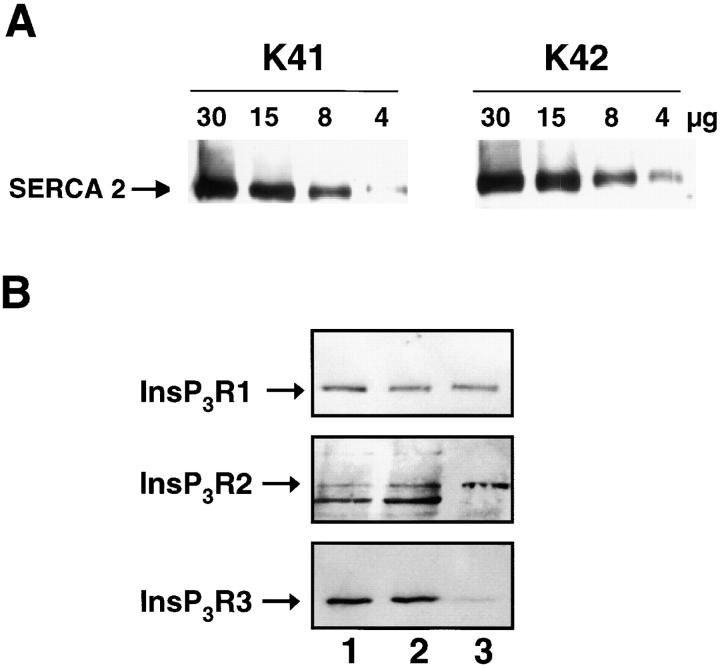
There are several potential explanations for the observation that bradykinin-induced Ca2+ release is impaired in calreticulin-deficient cells. For example, in crt − /− (K42) cells there could be changes in the expression and/or function of Ca2+ transport proteins in the ER or in the bradykinin receptor in the plasma membrane. To investigate these possibilities, we first compared expression of SERCA2 and the InsP3R in wild-type and calreticulin-deficient cells. Fig. 6 A shows that the expression of SERCA2 was not altered in calreticulin-deficient cells. Further, the level of mRNA for SERCA was the same in wild-type (K41) and calreticulin-deficient (K42) cells (unpublished data). We also used Western blot analysis (Fig. 6 B) and reverse transcriptase PCR (Table I) to compare expression of the three isoforms of the InsP3R (type 1, 2, and 3) in K41 and K42 cells. All three isoforms of the InsP3R were expressed in wild-type and crt − /− cells (Fig. 6 B and Table I). However, we found a 30–40% reduction in mRNA for the InsP3R in calreticulin-deficient cells compared with the wild-type cells (Table I). Western blot analysis of types 1, 2, and 3 of the InsP3R revealed that these cells contain all three types of InsP3R at a ratio of 10:70:20 (Fig. 6). A significant decrease of ∼20% was found in the calreticulin-deficient K42 cells for InsP3R type 1 (3.1 ± 0.4 versus 2.6 ± 0.4; n = 4; P < 0.01) and for InsP3R type 3 (9.4 ± 0.4 versus 7.5 ± 0.6; n = 4; P < 0.01). The relative level of InsP3R type 2 was approximately equal in both cell types (0.2 ± 0.1; n = 4).
Figure 6.
SERCA2 and InsP3R expression in calreticulin-deficient cells. (A) Wild-type (K41) and calreticulin-deficient (K42) mouse embryonic fibroblasts were lysed, and an increasing amount of protein (from 4 to 30 μg) was separated in SDS-PAGE, transferred to nitrocellulose membrane, and probed with anti-SERCA2. (B) Microsomal vesicles were isolated from wild-type and calreticulin-deficient cells followed by protein separation in SDS-PAGE. InsP3R type 1 (InsP3R1), InsP3R type 2 (InsP3R2), and InsP3R type 3 (InsP3R3) proteins were identified by Western blot analysis. Lane 1, K41 cells; lane 2, K42 cells; lane 3, RBL-2H3 control cells. The lower molecular mass protein band in the InsP3R2 panel is an immunoreactive protein not related to InsP3R2, and it was not included in quantitative analysis. 50 μg protein/lane was loaded except for the InsP3R2 samples (100 μg protein/lane). The position of InsP3R is indicated by the arrow.
Table I. Quantitative analysis of mRNA encoding different isoforms of InsP3Rs in calreticulin-deficient K42 cells.
| K41 wild-type cells | K42 calreticulin-deficient cells | |
|---|---|---|
| % | ||
| InsP3R type 1 | 100 | 74.6 ± 17.6 |
| InsP3R type 2 | 100 | 58.0 ± 17.8 |
| InsP3R type 3 | 100 | 66.0 ± 7.0 |
| GAPDH | 100 | 101.5 ± 4.2 |
| InsP3R 1/2/3 ratio (% of total level) | 25.0/13.7/61.2 | 28.8/13.0/58.1 |
Reverse transcriptase PCR was carried out as described in Materials and methods. GAPDH was used as an internal standard. Data are mean ± SD (n = 3).
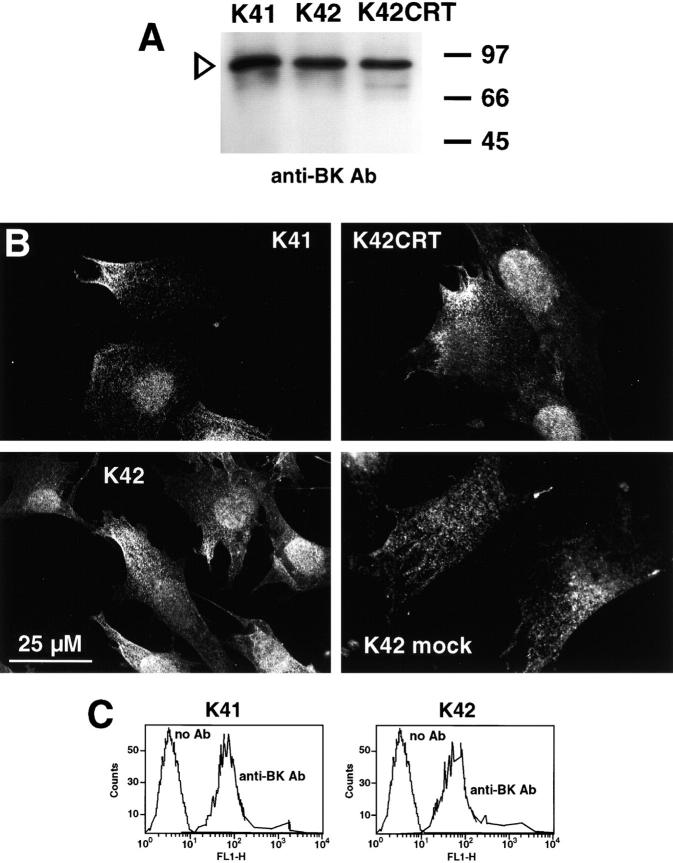
Next, we compared expression of the bradykinin receptor and its targeting to the plasma membrane in wild-type (K41) and calreticulin-deficient (K42) cells. Fig. 7 A shows that calreticulin-deficient cells had decreased level of bradykinin receptor protein. Quantitative analysis of Western blots indicated that there was ∼50% less bradykinin receptor in calreticulin-deficient cells compared with K41 wild-type cells. These results indicate that calreticulin deficiency had some effect on expression and/or turnover of the bradykinin receptor. Using confocal microscopy and antibodies against the bradykinin receptor, we found that the receptor was distributed in a “dotty” pattern across the cell surface in K41, K42, and K42CRT cells (Fig. 7 B). We noticed no difference between the cell lines in distribution of the receptor (Fig. 7 B). Cell surface localization of the receptor was further confirmed by flow cytometry assay using antibradykinin receptor antibodies. We observed no significant difference in the antibradykinin antibodies surface labeling of K41 and K42 cells (Fig. 7 C), indicating the similar number of immunoreactive receptor protein molecules was present on cell surface. We concluded that in calreticulin-deficient cells the bradykinin receptor was properly targeted to and localized in the plasma membrane.
Figure 7.
Expression of bradykinin receptor in calreticulin-deficient cells. Mouse embryonic fibroblasts were harvested, lysed, and proteins were separated in SDS-PAGE, transferred to nitrocellulose membrane, and probed with antibradykinin receptor antibodies (A). The positions of molecular markers are indicated. The open arrowhead indicates the position of bradykinin receptor. (B) Localization of bradykinin receptor in wild-type (K41), calreticulin-deficient cells (K42), and calreticulin-deficient cells transfected with calreticulin expression vector (K42CRT). K42 mock-transfected control cells are also shown. In all cell lines, bradykinin receptor localizes to cell surface. (C) Bradykinin receptor expression on cell surface. Flow cytometry analysis of mouse embryonic fibroblasts was carried out with antibradykinin receptor antibodies. Results are presented as the relative mean fluorescence intensity after subtracting fluorescent values for the secondary antibodies alone. Results shown are representative of five experiments. K41, wild type cells; K42, calreticulin-deficient cells; BK, bradykinin receptor.
InsP3-induced Ca2+ release and InsP3 synthesis in calreticulin-deficient cells
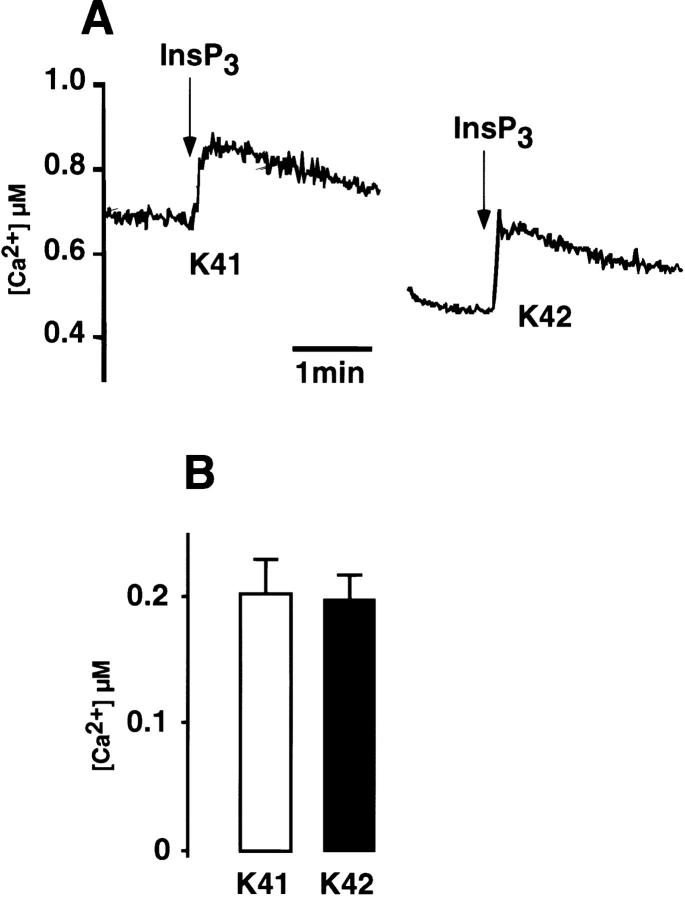
We have shown that expression of the InsP3R is reduced in calreticulin-deficient (K42) cells, whereas expression of the bradykinin receptor is not. Therefore, we wanted to determine whether the altered expression of the InsP3R was responsible for the impairment of bradykinin-induced Ca2+ release in these cells. To test this hypothesis, we loaded wild-type and calreticulin-deficient cells with fluo-3, and then we added saponin to permeabilize the plasma membrane (Favre et al., 1994). Subsequently, exogenous InsP3 was added to the digitonin-permeabilized cells, and Ca2+ release from the ER was monitored by changes in fluo-3 fluorescence. Fig. 8 shows that InsP3-induced Ca2+ release from the ER was indistinguishable in the wild-type (K41) and calreticulin-deficient (K42) cells, indicating that there is no difference in function of the InsP3Rs in the different cell types.
Figure 8.
Ca2 + release in saponin-permeabilized calreticulin-deficient cells. Wild-type (K41) and calreticulin-deficient (K42) cells were loaded with a fluorescent Ca2+ indicator fluo-3 and permeabilized with saponin. (A) InsP3 (10 μM) was added at the time indicated in the figure. (B) Basal [Ca2+]c in InsP3 incubated wild-type (white bar) and calreticulin-deficient (black bar). Data are means ± SD (n = 3).
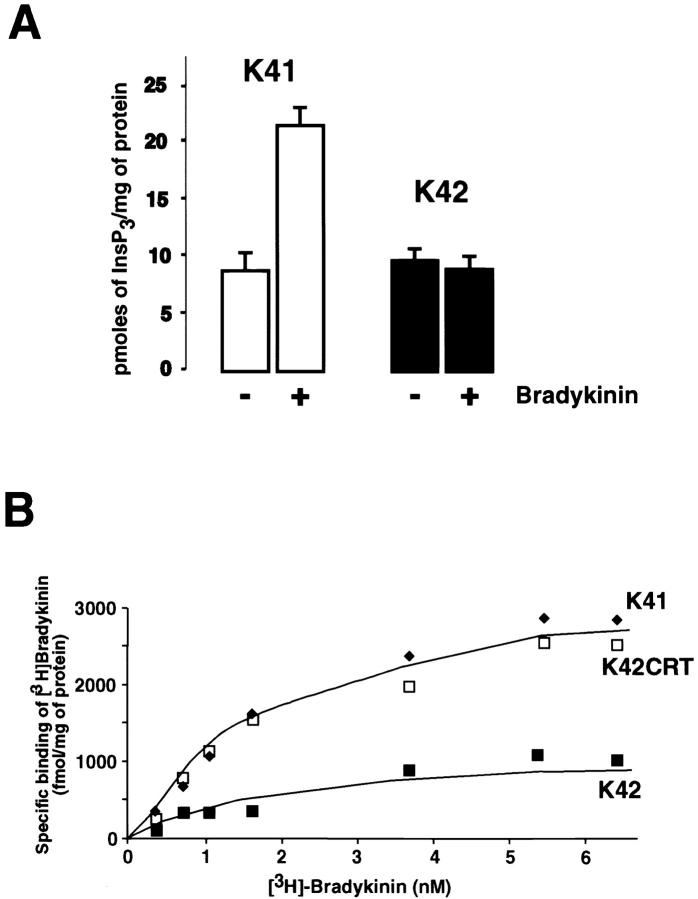
Since InsP3-induced Ca2+ release in permeabilized crt − /− cells is normal, the impaired bradykinin-induced Ca2+ release in intact cells could result from a deficiency in InsP3 synthesis. To investigate this possibility, we incubated wild-type and calreticulin-deficient cells with 200 nM bradykinin and then measured InsP3 levels. Fig. 9 A shows that the incubation with bradykinin resulted in significant synthesis of InsP3 in the K41 cells. In contrast, when calreticulin-deficient K42 cells were treated with bradykinin there was no detectable synthesis of InsP3 (Fig. 9 A). We conclude that impairment of bradykinin-induced Ca2+ release in crt − /− K42 cells likely results from a failure to synthesize InsP3.
Figure 9.
InsP3 production and [3H]bradykinin binding in calreticulin-deficient cells. (A) InsP3 synthesis was measured in wild-type (K41) and calreticulin-deficient (K42) cells incubated in the absence (−) or presence (+) of bradykinin as described in Materials and methods. Data are means ± SD (n = 3). (B) [3H]bradykinin binding to wild-type (K41), calreticulin-deficient (K42), and calreticulin-deficient cells transfected with calreticulin expression vector (K42CRT).
Bradykinin binding in calreticulin-deficient cells
Our results indicate that bradykinin-dependent signaling is impaired in calreticulin-deficient cells and that this results from impaired InsP3 synthesis. Therefore, we measured bradykinin binding to crt − /− K42 cells. Fig. 9 B shows that binding of [3H]bradykinin to wild-type K41 cells was saturable with a Bmax of ∼2.5 ± 0.3 pmol/mg of total cell protein (n = 3). Scatchard analysis of the specific binding data gave an apparent dissociation constant (K d) of 230 ± 20 pM. These values are in agreement with previously reported K d and Bmax values for bradykinin receptors (Marceau et al., 1998). In contrast, the binding of bradykinin to calreticulin-deficient cells was significantly reduced (Bmax < 0.5 ± 0.01 pmol/mg of protein; n = 3) (Fig. 9 B), which would explain why these cells show impairment of bradykinin-induced Ca2+ release (Fig. 4). K42CRT cells, which express calreticulin and exhibit normal bradykinin-induced Ca2+ release (Fig. 4), showed bradykinin binding comparable to that seen in wild-type cells (Bmax 2.7 ± 0.3 pmol/mg of total cell protein; n = 3; K d of 225 ± 25 pM) (Fig. 9 B). This was despite of a slightly lower level of expression of the bradykinin receptor in K42CRT cells (Fig. 7 A). We concluded that bradykinin binding to its receptor is inhibited in calreticulin-deficient cells.
N + P domain of calreticulin restores bradykinin-induced Ca2+ release from K42 cells
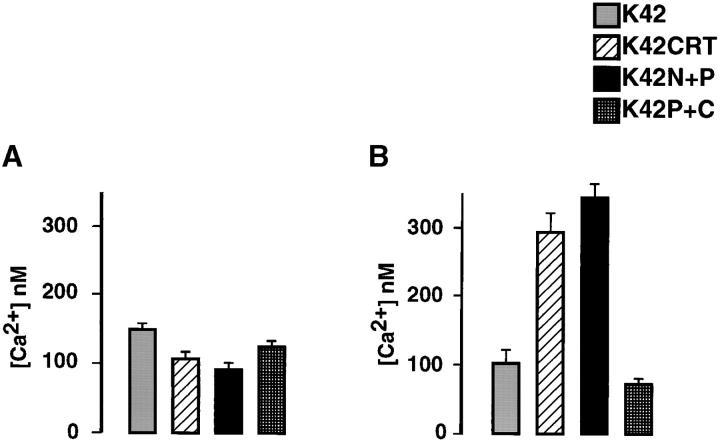
The data presented in Figs. 4 and 9 indicate that the impairment of bradykinin-induced Ca2+ release in calreticulin-deficient cells results from the failure of bradykinin to bind to its receptor. This indicates that the bradykinin receptor may be misfolded and therefore unable to bind bradykinin. In preliminary experiments, we showed that calreticulin and bradykinin receptor form complexes, which can be immunoprecipitated (unpublished data), indicating that calreticulin may play a role in folding of the bradykinin receptor. This presented us with a unique opportunity to investigate the role of calreticulin's different domains in its function as a chaperone. We used bradykinin-induced changes in [Ca2+]c as a measure of the function of the bradykinin receptor. Cells were loaded with fura-2, stimulated with 200 nM bradykinin, and changes in [Ca2+]c were monitored. As shown in Fig. 10 , in K42 crt − /− cells expressing calreticulin (K42CRT), bradykinin-induced Ca2+ release was restored to the levels seen in wild-type cells. This indicates that full-length calreticulin is required for normal ligand binding to the receptor. Bradykinin-induced Ca2+ release was also reestablished in K42 cells after transfection with the N + P domain of calreticulin (Fig. 10 B, K42N+P). However, it was not reestablished in cells expressing the P + C domain of the protein (Fig. 10 B, K42P+C). This indicates that the N and P domain of calreticulin may play a role in peptide binding and/or folding of the bradykinin receptor in mouse embryonic fibroblasts.
Figure 10.
Role of the N + P domain of calreticulin in bradykinin-induced Ca2 + release. Cells were loaded with the fluorescent Ca2+ indicator fura-2 and stimulated with 200 nM bradykinin. A shows a basal [Ca2+]c, and B shows the amount of Ca2+ released by 200 nM bradykinin. K42, calreticulin-deficient cells; K42CRT, K42 cells transfected with calreticulin expression vector; K42N+P, K42 cells transfected with N + P domain expression vector; K42P+C, K42 cells transfected with P + C domain expression vector. Data are means ± SD (n = 3).
Discussion
In this study, we took advantage of a new calreticulin-deficient cell line, which enabled us to address some of the many outstanding questions regarding the function of calreticulin and its distinct structural domains in the lumen of the ER. We found that calreticulin-deficient cells have impaired bradykinin-induced Ca2+ release, which results from a dysfunctional bradykinin receptor. The dysfunction probably arises because the receptor is incorrectly folded and as a result is unable to bind its ligand. Since the receptor cannot bind the ligand, it fails to initiate the signal transduction cascade, which normally leads to production of InsP3 and Ca2+ release from the ER via the InsP3R. These are the first studies in which the function of calreticulin and of its distinct domains have been tested against a calreticulin-deficient background. In these studies, we show that the C domain of calreticulin plays a critical role in determining the Ca2+ storage capacity of the ER and that the N + P domain but not the C domain may play a role in the protein's chaperone function. This study shows that distinct regions (domains) of calreticulin perform specialized functions in the ER lumen.
We have shown here that calreticulin plays an important role in determining the Ca2+ storage capacity of the ER. This fits with previous work, which has indicated that overexpression of calreticulin increases the Ca2+ capacity of InsP3-sensitive Ca2+ stores (Bastianutto et al., 1995; Mery et al., 1996; Fasolato et al., 1998; Xu et al., 2000). Specifically, we found that there is a significant decrease in the Ca2+ storage capacity of the ER in calreticulin-deficient mouse embryonic fibroblasts. This finding is in disagreement with the results of other work in which calreticulin-deficient embryonic stem cells were used (Coppolino et al., 1997). The cause of this discrepancy is not clear, but it may result from the relatively harsh conditions required for the selection of calreticulin-deficient embryonic stem cells. Importantly, we found that expression of either full-length calreticulin or its P + C domain in calreticulin-deficient fibroblasts restored the Ca2+ capacity of the ER to normal levels. This indicates that the P + C domains of calreticulin somehow help to determine the Ca2+ storage capacity in the lumen of the ER. This most likely occurs through the C domain of calreticulin, which binds Ca2+ with high capacity (Michalak et al., 1999), but at this stage a contribution by the P domain cannot be ruled out because we have been unable to express the C domain of calreticulin alone. Despite this, it is unlikely that the P domain has a role because expression of the N + P domain of calreticulin does not affect the Ca2+ storage capacity of the ER. For many years, it has been hypothesized that the C domain of calreticulin plays a role in determining the Ca2+ storage capacity of the ER. These studies provide the first direct evidence that this is indeed the case. Interestingly, although calreticulin-deficiency has a profound effect on the Ca2+ storage capacity of the ER it does not appear to affect the free [Ca2+]ER as determined using cameleon techniques.
There are many obvious questions posed by the finding that calreticulin affects the Ca2+ storage capacity of the ER. For example, what are the physiological consequences of modulating the Ca2+ storage capacity of the ER? It has already been suggested that changes in Ca2+ concentration in the lumen of the ER may profoundly affect store-operated Ca2+ influx (Fasolato et al., 1998). These kinds of changes may also be involved in regulation of Ca2+ transport (John et al., 1998), protein–protein interactions, and chaperone function in the ER (Corbett and Michalak, 2000). Further, recent reports indicate that the Ca2+ storage capacity of the ER may play a role in determining cell sensitivity to apoptosis. For example, cells that overexpress Bcl-2 have a lower Ca2+ in the lumen of the ER and are more resistant to apoptosis (Foyouzi-Youseffi et al., 2000; Pinton et al., 2000, 2001). In addition, calreticulin knockout cells, which have reduced intraluminal Ca2+ concentrations, are also resistant to apoptosis (Nakamura et al., 2000).
The nuclear export of the glucocorticoid receptor is inhibited in calreticulin-deficient cells (Holaska et al., 2001). Calreticulin may play a role in this directly or alternatively, and these effects might be exerted through calreticulin's role in determining the Ca2+ storage capacity of the ER (and the nuclear envelope). It seems that many of the diverse functions proposed for calreticulin (Michalak et al., 1999) might be explained by its effects on the ER Ca2+ storage capacity as described here and by others (Bastianutto et al., 1995; Mery et al., 1996; Fasolato et al., 1998; Xu et al., 2000).
Bradykinin-dependent Ca2+ signaling is impaired in calreticulin-deficient cells (Mesaeli et al., 1999). At least partly, this may explain why calreticulin deficiency is lethal. The Ca2+ responses to bradykinin are also diminished as a result of antisense oligodeoxynucleotide downregulation of calreticulin expression (Liu et al., 1994). Normally bradykinin binds to a cell surface receptor, and this leads to the activation of PLC followed by the synthesis of InsP3 and the release of Ca2+ from ER stores via the InsP3R (Hashii et al., 1993). Since calreticulin is resident in the lumen of the ER, we thought that the impairment of bradykinin-induced Ca2+ release in calreticulin-deficient cells might result from a direct effect on InsP3R function. However, in this study we have shown that calreticulin-deficient cells exhibit normal InsP3-induced Ca2+ release but fail to produce InsP3 in response to bradykinin. Although the calreticulin-deficient cells have somewhat lower levels of the InsP3R, its function is apparently unaffected. This indicates that cells can tolerate some change in the expression of InsP3R without compromising the ER's ability to release Ca2+. It is not clear why expression of the InsP3R is decreased in calreticulin-deficient cells, but Ca2+ and calcineurin may play a role. Calcineurin affects expression of the InsP3R at the transcriptional level (Genazzani et al., 1999) and calcineurin-dependent transcriptional processes are impaired in calreticulin-deficient cells.
Although the level of the bradykinin receptor is reduced in crt − /− cells, its targeting to the cell surface is unchanged, indicating that the absence of calreticulin does not affect its intracellular trafficking. Decreased expression of the bradykinin receptor may be due to increased degradation of the receptor in calreticulin-deficient cells. Our results indicate that calreticulin-deficient cells do not show bradykinin-induced Ca2+ release because the bradykinin receptor is unable to bind its ligand. If the bradykinin cannot bind, the receptor is unable to stimulate phospholipase C activity and synthesis of InsP3. Bradykinin-induced Ca2+ release can be rescued in crt − /− cells by reintroduction of full-length calreticulin. Importantly, the N + P domain of calreticulin is involved in this restoration, whereas the P + C domain is not. We conclude that the N domain of calreticulin is somehow essential for enabling interaction between the bradykinin receptor and its ligand, most likely through assisting in proper folding of the receptor's ligand-binding domain. Although we do not have direct evidence for this, it is conceivable that the N domain may directly interact with bradykinin receptor or it may recruit other chaperones necessary for the receptor folding and/or posttranslational modification. For example, the N domain interacts in vitro with ERp57 (Corbett et al., 1999), and this may be critical for proper folding of the ligand binding of the receptor. At present, the chaperone function of the P domain is not clear. This study indicates that either the P domain plays less important chaperone role, or most likely its chaperone function requires the presence of the N domain. However, this is the first evidence that the chaperone function of calreticulin may be also contained in the N domain of the protein.
It is widely thought that the central P domain of calreticulin can act as a chaperone for glycosylated proteins because of its amino acid sequence similarities to calnexin and its lectin-like activity. However, a series of in vitro experiments indicate that calreticulin may also function as a molecular chaperone for nonglycosylated proteins (Saito et al., 1999). Both ATP and Zn2+ enhance calreticulin's ability to complex with unfolded nonglycosylated substrates in vitro (Saito et al., 1999). This likely occurs because of the dramatic conformational change, which occurs in calreticulin in the presence of Zn2+ (Khanna et al., 1986). Calreticulin binds Zn2+ at its N domain (Michalak et al., 1999). The amino acid sequence of the N domain is extremely conserved among all calreticulins and is also unique to calreticulin (Michalak et al., 1999). This observation supports the suggestion that the N domain of calreticulin has a highly specific function, which may include the folding of specific substrates. The bradykinin receptor may be such a substrate. Calreticulin and calnexin both interact with monoglucosylated carbohydrates and therefore share many glycosylated substrates. However, each one also interacts with a significantly different spectrum of glycoproteins and proteins (Danilczyk et al., 2000). The N domain of calreticulin may assist in recognition of calreticulin-specific substrates such as the bradykinin receptor (this study). Notably, in support of this suggestion bradykinin-dependent Ca2+ release is not altered in calnexin-deficient cells (unpublished data).
In summary, we report here that calreticulin plays an important role in Ca2+ homeostasis in vivo. We show that the C domain of calreticulin is involved in determining the Ca2+ storage capacity of the ER and that the N + P domain may play a role as a chaperone. It is clear that the chaperone functions of calreticulin are tightly linked with its role in Ca2+ homeostasis, and in this work specifically it appears that improper binding of bradykinin to the receptor and/or improper folding of the bradykinin receptor affect its ability to induce Ca2+ release from ER Ca2+ stores. These studies indicate that distinct regions (domains) of calreticulin perform specialized functions in the ER lumen.
Materials and methods
Cell culture and DNA constructs
Mouse embryonic fibroblasts were isolated from calreticulin-deficient and wild-type embryos, immortalized, and designated K41 and K42, respectively (Nakamura et al., 2000). K42 crt − /− cells were transfected with the pcDNA3 expression vector containing cDNA encoding rabbit calreticulin to generate crt − /− cell lines expressing recombinant calreticulin (designated K42CRT). K42 cells were also transfected with expression vectors encoding the N + P domain or P + C domain of calreticulin to generated K42N+P and K42P+C lines, respectively. cDNA encoding the N + P domain of calreticulin (amino acid residues 1–287) was synthesized by PCR-driven reaction using the following oligodeoxynucleotides with 5′ flanking EcoR1 (primer N5′) and Kpn1 (primer P3′) restriction sites: N5′, 5′-ATATGAATTCATGCTGCTCCCTGTGCCGCT-3′ and P3′, 5′-ATATCTCGAGGTCGGGCGAGTACTCGGGGT-3′.
cDNA encoding the P + C domain of the protein (amino acid residues 172–401) was synthesized by PCR-driven reaction using the following P5′ and C3′ primers with 5′ flanking Kpn1 and Xho1, respectively: P5′, 5′-ATATGGTGACCAACAGCCAGGTGGAGTCGGG-3′ and C3′, 5′-ATATCTCGAGGCCGGCGGCCGCCTCCTCCT-3′.
cDNA for the N + P and P + C domain was preceded by cDNA encoding calreticulin signal sequence and COOH-terminal KDEL ER retrieval signal.
SDS-PAGE and Western blot analysis
Cells were lysed, and proteins were separated by SDS-PAGE (10% acrylamide) and transferred to nitrocellulose membrane (Mery et al., 1996). Blots were also probed with goat and rabbit anticalreticulin (Nakamura et al., 2000), antibradykinin B2 receptor antibodies (Blaukat et al., 1996), or rabbit anti-SERCA2 antibodies at a 1:1,000 dilution (Lytton et al., 1992).
To assess the level of InsP3R protein, microsomal membranes were isolated from wild-type (K41) and crt − /− (K42) cells (Lytton et al., 1992) and from RBL-2H3 cells as control (Vanlingen et al., 1997). Membrane proteins were separated on SDS-PAGE, transferred to Immobilon-P and probed with isoform-specific antibodies against InsP3R type 1 (Rbt03, dilution 1:1,000), InsP3R type 2 (Rbt02, dilution 1:200), or InsP3R type 3 (I31220, dilution 1:2,000; Transduction Laboratories) (Parys et al., 1995; De Smedt et al., 1997). Quantification of the immunoreactive bands was performed after incubation with secondary antibodies coupled to alkaline phosphatase detection using Vistra™ enhanced chemifluorescence and fluorimaging as described before (Vanlingen et al., 1997). Statistical analysis of the InsP3R isoforms levels in the K41 and K42 cells was performed using the paired Student's t test after normalization of the levels to those found in microsomes of RBL-2H3 cells.
Reverse transcriptase PCR analysis of InsP3R mRNA
Relative levels of mRNA encoding different isoforms of InsP3R were determined by reverse transcriptase PCR (De Smedt et al., 1997). PCR products and restriction fragments were separated on a 6% acrylamide gel and visualized by staining with Vistra Green (followed by fluorimaging and quantitative analysis on a Storm840 FluoroImager equipped with the ImageQuaNT 4.2 software.) GAPDH mRNA was used as an internal standard.
Total and free ER luminal Ca2+ concentrations
The total Ca2+ in ER Ca2+ stores was estimated using 45Ca2+ (10 μCi/ml) as described earlier (Mery et al., 1996). Free [Ca2+]ER was estimated by dual emission ratio imaging using the ER-targeted yellow cameleon (YC4ER) (Miyawaki et al., 1997; Arnaudeau et al., 2001). Cameleon fluorescence was imaged at 37°C on a ZEISS Axiovert S100 TV equipped with 430 ± 10 nm excitation and two emission filters alternated by a filterwheel. Images were acquired on a 12-bit cooled CCD camera controlled by the Metamorph/Metafluor versus 3.5 software. [Ca2+] was calibrated from the YC4ER fluorescence ratio R (535/475 nm) using the following equation:
[Ca2+] = K′d[(R − (R min + 14 / 100*(R max − R min))) / (R max − R)](1/n)
where R max = ratio obtained in the presence of 10 μM ionomycin and 20 mM CaCl2, R min = ratio obtained in the presence of 10 μM ionomycin and 20 mM EGTA, K′d = 292 μM, the apparent dissociation constant, and n = 0.60, the Hill coefficient of the fitted Ca2+ calibration curve. This curve was obtained in situ on mouse embryonic fibroblasts expressing YC4ER, permeabilized with ionomycin (10 μM) and digitonin (5 μg/ml), and incubated with different Ca2+-containing solutions buffered with 5 mM EGTA and 5 mM HEEDTA below 100 μM free Ca2+ calculated according to Bers et al. (1994).
Cytoplasmic Ca2+ measurements
For measurement of [Ca2+]c, cells (1.5 × 10⁶/ml) were loaded with the fluorescent Ca2+ indicator fura-2/AM (2 μM) (Mery et al., 1996). Cells were stimulated with 200 nM bradykinin, 100 μM carbachol, 1 μM angiotensin II, 50 nM bombesin, 10 mM caffeine, or 25 ng PDGF/ml of medium. For direct addition of InsP3, cells were permeabilized with saponin (Favre et al., 1994).
InsP3 level measurement
For InsP3 level measurements K41 and K42 (4 × 10⁷ cells), cells were incubated for 15 s with 200 nM bradykinin, and the reaction was terminated by addition of an equal volume of 15% trichloroacetic acid. Acid-treated cells were centrifuged at 3,000 g for 15 min at 4°C, extracted with water-saturated diethyl ether, neutralized with NaHCO3 followed by the d-myo-[3H]InsP3–binding assay, which was carried out as recommended by the manufacturer (Amersham Pharmacia Biotech).
Bradykinin binding
Cells were plated at 2 × 10⁴ cells/ml in 24-well (1 ml/well) and equilibrated on ice for 10 min with a binding buffer containing 20 mM Hepes, pH 7.4, 17 mM NaCl, 5.4 mM KCl, 0.44 mM KH2PO4, 0.63 mM CaCl2, 0.21 mM MgSO4, 0.34 mM Na2HPO4, 110 mM N-methylglutamine, 0.1% BSA, and 2 mM bacitracin. Cells were then incubated with different concentrations of [3H]bradykinin (0.38–6.4 nM) in the presence or absence of 10 μM bradykinin. Cells were washed with a binding buffer, resuspended at 250 μl/well in ice-cold 100 mM NaOH and counted by scintillation counting. Binding assays were performed for 4 h at 4°C in triplicate.
Immunostaining, fluorescence microscopy, and flow cytometry
Immunostaining and confocal microscopy were carried out as previously described (Nakamura et al., 2000). Goat antibodies against calreticulin (diluted 1:50), rabbit antibodies against Grp94 (diluted 1:50), PDI (diluted 1:50), and bradykinin receptor (diluted 1:100) were used. The secondary antibodies were: FITC-conjugated donkey anti–goat IgG (H + L) (diluted 1:50) and FITC-conjugated goat anti–rabbit IgG (H + L) (diluted 1:50).
For flow cytometry, fibroblasts were suspended in a solution containing 1 mM EDTA, 150 mM NaCl, 50 mM Tris, pH 7.3, washed, incubated with PBS containing 2% FBS, and labeled with rabbit antibradykinin receptor antibodies at a 1:10 dilution for 20 min at 4°C. Secondary antibody was anti–rabbit FITC antibody at a 1:50 dilution. Analysis was carried out with a Becton Dickinson FACScan using CellQuest software. Results are presented as the relative mean fluorescence intensity of the population labeled with primary and secondary antibodies minus that obtained with secondary antibody alone. Results shown are representative of five experiments.
Acknowledgments
We thank M. Dabrowska and A. Monod for superb technical assistance. We thank R.E. Moses for pSV-7 vector, R. Tsien for YC4ER vector, and J. Lytton for anti-SERCA2.
This work was supported by grants (to M. Michalak and M. Opas) from the Canadian Institutes of Health Research, from the Heart and Stroke Foundation of Alberta (to M. Michalak) and the Heart and Stroke Foundation of Ontario (to M. Opas), by a grant from National Swiss Fund 31-56802.99 (to N. Demaurex and D. Lew), and by grant 99/08 of the Concerted Actions of the Katholieke Universiteit Leuven (to J.B. Parys and H. De Smedt). K. Nakamura was a Fellow of the Alberta Heritage Foundation for Medical Research. J.F. Lynch and I. Ahsan are recipients of studentships from the Heart and Stroke Foundation of Canada and the Alberta Heritage Foundation for Medical Research, respectively. M. Michalak is a Canadian Institutes of Health Research senior investigator and a medical scientist of the Alberta Heritage Foundation for Medical Research.
K. Nakamura and A. Zuppini contributed equally to this work.
Footnotes
Abbreviations used in this paper: [Ca2+]c, cytoplasmic Ca2+ concentration; [Ca2+]ER, ER luminal Ca2+ concentration; ER, endoplasmic reticulum; InsP3, inositol 1,4,5-trisphosphate; InsP3R, InsP3 receptor; PDI, protein disulfide isomerase.
References
- Arnaudeau, S., W.L. Kelley, J.V. Walsh Jr., and N. Demaurex. 2001. Mitochondria recycle calcium to the endoplasmic reticulum and prevent the depletion of neighboring ER regions. J. Biol. Chem. 276:29430–29439. [DOI] [PubMed] [Google Scholar]
- Bastianutto, C., E. Clementi, F. Codazzi, P. Podini, F. De Giorgi, R. Rizzuto, J. Meldolesi, and T. Pozzan. 1995. Overexpression of calreticulin increases the Ca2+ capacity of rapidly exchanging Ca2+ stores and reveals aspects of their lumenal microenvironment and function. J. Cell Biol. 130:847–855. [DOI] [PMC free article] [PubMed] [Google Scholar]
- Bergeron, J.J.M., M.B. Brenner, D.Y. Thomas, and D.B. Williams. 1994. Calnexin: a membrane-bound chaperone of the endoplasmic reticulum. Trends Biochem. Sci. 19:124–128. [DOI] [PubMed] [Google Scholar]
- Bers, D.M., C.W. Patton, and R. Nuccitelli. 1994. A practical guide to the preparation of Ca2+ buffers. Methods Cell Biol. 40:3–29. [DOI] [PubMed] [Google Scholar]
- Blaukat, A., S.A. Alla, M.J. Lohse, and W. Müller-Esterl. 1996. Ligand-induced phosphorylation/dephosphorylation of the endogenous bradykinin B2 receptor from human fibroblasts. J. Biol. Chem. 271:32366–32374. [DOI] [PubMed] [Google Scholar]
- Coppolino, M.G., M.J. Woodside, N. Demaurex, S. Grinstein, R. St-Arnaud, and S. Dedhar. 1997. Calreticulin is essential for integrin-mediated calcium signalling and cell adhesion. Nature. 386:843–847. [DOI] [PubMed] [Google Scholar]
- Corbett, E.F., and M. Michalak. 2000. Calcium, a signaling molecule in the endoplasmic reticulum? Trends Biochem. Sci. 25:307–311. [DOI] [PubMed] [Google Scholar]
- Corbett, E.F., K. Oikawa, P. Francois, D.C. Tessier, C. Kay, J.J.M. Bergeron, D.Y. Thomas, K.-H. Krause, and M. Michalak. 1999. Ca2+ regulation of interactions between endoplasmic reticulum chaperones. J. Biol. Chem. 274:6203–6211. [DOI] [PubMed] [Google Scholar]
- Corbett, E.F., K.M. Michalak, K. Oikawa, S. Johnson, I.D. Campbell, P. Eggleton, C. Kay, and M. Michalak. 2000. The conformation of calreticulin is influenced by the endoplasmic reticulum lumenal environment. J. Biol. Chem. 275:27177–27185. [DOI] [PubMed] [Google Scholar]
- Danilczyk, U.G., M.F. Cohen-Doyle, and D.B. Williams. 2000. Functional relationship between calreticulin, calnexin, and the endoplasmic reticulum luminal domain of calnexin. J. Biol. Chem. 275:13089–13097. [DOI] [PubMed] [Google Scholar]
- De Smedt, H., L. Missiaen, J.B. Parys, R.H. Henning, I. Sienaert, S. Vanlingen, A. Gijsens, B. Himpens, and R. Casteels. 1997. Isoform diversity of the inositol trisphosphate receptor in cell types of mouse origin. Biochem. J. 322:575–583. [DOI] [PMC free article] [PubMed] [Google Scholar]
- Fasolato, C., P. Pizzo, and T. Pozzan. 1998. Delayed activation of the store-operated calcium current induced by calreticulin overexpression in RBL-1 cells. Mol. Biol. Cell. 9:1513–1522. [DOI] [PMC free article] [PubMed] [Google Scholar]
- Favre, C.J., D.P. Lew, and K.-H. Krause. 1994. Rapid heparin-sensitive Ca2+ release following Ca2+-ATPase inhibition in intact HL-60 granulocytes. Evidence for Ins(1,4,5)P3-dependent Ca2+ cycling across the membrane of Ca2+ stores. Biochem. J. 302:155–162. [DOI] [PMC free article] [PubMed] [Google Scholar]
- Foyouzi-Youseffi, R., S. Arnaudeau, C. Borner, W.L. Kelley, J. Tschopp, D.P. Lew, N. Demaurex, and K.-H. Krause. 2000. Bcl-2 decreases the free Ca2+ concentration within the endoplasmic reticulum. Proc. Natl. Acad. Sci. USA. 97:5723–5728. [DOI] [PMC free article] [PubMed] [Google Scholar]
- Genazzani, A.A., E. Carafoli, and D. Guerini. 1999. Calcineurin controls inositol 1,4,5-trisphosphate type 1 receptor expression in neurons. Proc. Natl. Acad. Sci. USA. 96:5797–5801. [DOI] [PMC free article] [PubMed] [Google Scholar]
- Hashii, M., Y. Nozawa, and H. Higashida. 1993. Bradykinin-induced cytosolic Ca2+ oscillations and inositol tetrakisphosphate-induced Ca2+ influx in voltage-clamped ras-transformed NIH/3T3 fibroblasts. J. Biol. Chem. 268:19403–19410. [PubMed] [Google Scholar]
- Helenius, A., E.S. Trombetta, D.N. Hebert, and J.F. Simons. 1997. Calnexin, calreticulin and the folding of glycoproteins. Trends Cell Biol. 7:193–200. [DOI] [PubMed] [Google Scholar]
- Holaska, J.M., B.E. Black, D.C. Love, J.A. Hanover, J. Leszyk, and B.M. Paschal. 2001. Calreticulin is a receptor for nuclear export. J. Cell Biol. 152:127–140. [DOI] [PMC free article] [PubMed] [Google Scholar]
- John, L.M., J.D. Lechleiter, and P. Camacho. 1998. Differential modulation of SERCA2 isoforms by calreticulin. J. Cell Biol. 142:963–973. [DOI] [PMC free article] [PubMed] [Google Scholar]
- Khanna, N.C., M. Tokuda, and D.M. Waisman. 1986. Conformational changes induced by binding of divalent cations to calregulin. J. Biol. Chem. 261:8883–8887. [PubMed] [Google Scholar]
- Liu, N., R.E. Fine, E. Simons, and R.J. Johnson. 1994. Decreasing calreticulin expression lowers the Ca2+ response to bradykinin and increases sensitivity to ionomycin in NG-108-15 cells. J. Biol. Chem. 269:28635–28639. [PubMed] [Google Scholar]
- Lytton, J., M. Westlin, S.E. Burk, G.E. Shull, and D.H. MacLennan. 1992. Functional comparisons between isoforms of the sarcoplasmic or endoplasmic reticulum family of calcium pumps. J. Biol. Chem. 267:14483–14489. [PubMed] [Google Scholar]
- Marceau, F., J.F. Hess, and D.R. Bachvarov. 1998. The B1 receptors for kinins. Pharmacol. Rev. 50:357–386. [PubMed] [Google Scholar]
- Meldolesi, J., and T. Pozzan. 1998. The endoplasmic reticulum Ca2+ store: a view from the lumen. Trends Biochem. Sci. 23:10–14. [DOI] [PubMed] [Google Scholar]
- Mery, L., N. Mesaeli, M. Michalak, M. Opas, D.P. Lew, and K.-H. Krause. 1996. Overexpression of calreticulin increases intracellular Ca2+ storage and decreases store-operated Ca2+ influx. J. Biol. Chem. 271:9332–9339. [DOI] [PubMed] [Google Scholar]
- Mesaeli, N., K. Nakamura, E. Zvaritch, P. Dickie, E. Dziak, K.-H. Krause, M. Opas, D.H. MacLennan, and M. Michalak. 1999. Calreticulin is essential for cardiac development. J. Cell Biol. 144:857–868. [DOI] [PMC free article] [PubMed] [Google Scholar]
- Michalak, M., E.F. Corbett, N. Mesaeli, K. Nakamura, and M. Opas. 1999. Calreticulin: one protein, one gene, many functions. Biochem. J. 344:281–292. [PMC free article] [PubMed] [Google Scholar]
- Miyawaki, A., J. Llopis, R. Heim, J.M. McCaffery, J.A. Adams, M. Ikura, and R.Y. Tsien. 1997. Fluorescent indicators for Ca2+ based on green fluorescent proteins and calmodulin. Nature. 388:882–887. [DOI] [PubMed] [Google Scholar]
- Nakamura, K., E. Bossy-Wetzel, K. Burns, M. Fadel, M. Lozyk, I.S. Goping, M. Opas, R.C. Bleackley, D.R. Green, and M. Michalak. 2000. Changes in endoplasmic reticulum luminal environment affect cell sensitivity to apoptosis. J. Cell Biol. 150:731–740. [DOI] [PMC free article] [PubMed] [Google Scholar]
- Parys, J.B., H. De Smedt, L. Missiaen, M.D. Bootman, I. Sienaert, and R. Casteels. 1995. Rat basophilic leukemia cells as model system for inositol 1,4,5-trisphosphate receptor IV, a receptor of the type II family: functional comparison and immunological detection. Cell Calcium. 17:239–249. [DOI] [PubMed] [Google Scholar]
- Pinton, P., D. Ferrari, P. Magalhaes, K. Schulze-Osthoff, F. Di Virgilio, T. Pozzan, and R. Rizzuto. 2000. Reduced loading of intracellular Ca2+ stores and downregulation of capacitative Ca2+ influx in Bcl-2–overexpressing cells. J. Cell Biol. 148:857–862. [DOI] [PMC free article] [PubMed] [Google Scholar]
- Pinton, P., D. Ferrari, E. Rapizzi, F.D. Virgilio, T. Pozzan, and R. Rizzuto. 2001. The Ca2+ concentration of the endoplasmic reticulum is a key determinant of ceramide-induced apoptosis: significance for the molecular mechanism of Bcl-2 action. EMBO J. 20:2690–2701. [DOI] [PMC free article] [PubMed] [Google Scholar]
- Rauch, F., J. Prud'homme, A. Arabian, S. Dedhar, and R. St-Arnaud. 2000. Heart, brain, and body wall defects in mice lacking calreticulin. Exp. Cell Res. 256:105–111. [DOI] [PubMed] [Google Scholar]
- Saito, Y., Y. Ihara, M.R. Leach, M.F. Cohen-Doyle, and D.B. Williams. 1999. Calreticulin functions in vitro as a molecular chaperone for both glycosylated and non-glycosylated proteins. EMBO J. 18:6718–6729. [DOI] [PMC free article] [PubMed] [Google Scholar]
- Vanlingen, S., J.B. Parys, L. Missiaen, H. De Smedt, F. Wuytack, and R. Casteels. 1997. Distribution of inositol 1,4,5-trisphosphate receptor isoforms, SERCA isoforms and Ca2+ binding proteins in RBL-2H3 rat basophilic leukemia cells. Cell Calcium. 22:475–486. [DOI] [PubMed] [Google Scholar]
- Xu, W., F.J. Longo, M.R. Wintermantel, X. Jiang, R.A. Clark, and S. DeLisle. 2000. Calreticulin modulates capacitative Ca2+ influx by controlling the extent of inositol 1,4,5-trisphosphate-induced Ca2+ store depletion. J. Biol. Chem. 275:36676–36682. [DOI] [PubMed] [Google Scholar]


