

Abstract
We determined the immunoglobulin (Ig) VH subgroup expressed by the leukemia cells of 108 patients with B cell chronic lymphocytic leukemia (CLL). Surprisingly, we found that six samples (5%) each expressed Ig of more than one VH subgroup. Southern blot analysis demonstrated that these samples each had rearrangements involving both Ig heavy chain alleles. Nucleic acid sequence analyses of the Ig cDNA revealed each to express two functional Ig VH genes: VH3-33 and VH4-39; VH3-7 and VH4-39; VH3-23 and VH4-61; VH2-70 and VH3-30.3; or VH3-30 and VH4-b (DP67). One sample expressed three Ig VH genes: VH2-70, VH3-7, and VH4-59. Despite having more than one Ig heavy chain transcript, each sample was found to express only one functional Ig light chain. From the primary sequence, we deduced that the Ig of some of these CLL samples should react with Lc1, a monoclonal antibody (mAb) reactive with a supratypic cross-reactive idiotype present on Ig encoded by a subgroup of Ig VH4 genes (namely, VH4-39, VH4-b [DP-67], VH4-59, or VH4-61), and B6, an mAb that reacts with Ig encoded by certain Ig VH3 genes (namely, VH3-23, VH3-30, or VH3-30.3), and/or modified staphylococcal protein A (SpA), a 45-kilodalton bacterial “superantigen” that reacts with most Ig of the VH3 subgroup. Flow cytometric analyses revealed that such samples did in fact react with Lc1 and B6 and/or SpA, but not with control mAbs of irrelevant specificity. This study demonstrates that a subset of CLL patients have leukemic B cells that express more than one functional Ig heavy chain.
Ig are comprised of heavy and light chains that are encoded by genes that rearrange during B cell ontogeny. In the Ig heavy chain gene complex on chromosome 14, there are ∼50 functional Ig VH genes, 30 diversity segments, and 6 JH minigenes (1–3). The Ig VH genes are classified into seven subgroups (VH1–VH7) based on their relative nucleotide sequence homology (4, 5). During B cell development, one or more diversity segments can juxtapose with a JH gene segment, forming a DJH complex that then rearranges with an Ig VH gene to form a VHDJH exon that ultimately can encode the Ig heavy chain variable region (6). After successful Ig heavy chain gene rearrangement, the genes encoding the Ig κ and/or λ light chain variable regions undergo similar gene rearrangements.
Each mature B cell ordinarily expresses only one Ig heavy chain and one Ig light chain allele (7). This phenomenon, called allelic exclusion, is thought to reflect the relative infrequency of productive Ig gene rearrangements and the fact that expression of a productive Ig heavy chain can suppress subsequent gene rearrangement on the allelic Ig heavy chain complex (8). Similarly, expression of intact Ig generally precludes subsequent Ig light chain gene rearrangement. Allelic exclusion prevents each B cell from expressing Ig with varied combinations of different heavy and light chains, each having potentially distinct binding specificities. This allows for selection of B cells that express Ig with desired binding properties, thus providing a means for generating high-affinity, antigen-specific antibody responses. A similar process governs rearrangement and expression of genes encoding the TCR for antigen (9).
However, several studies have provided evidence that allelic exclusion may not be absolute, at least for the TCR. Rearrangements of both TCR Vα alleles have been detected in T cell clones (10, 11) and in TCR Vα transgenic mice (12). Dual Vα chains also have been detected on the surface of T cells of transgenic mice (13) and on normal human T cells (14). In addition, there also are exceptions to TCR Vβ allelic exclusion. Balomenos et al., for example, demonstrated that a small portion (1%) of thymocytes escape TCR Vβ allelic exclusion in both transgenic and normal mice (15). These dual Vβ-expressing cells increase with age and can account for a sizable proportion of the T cells in the periphery. Dual TCR expression also has been observed for a subset (1%) of human α/β T cells (16), and γ/δ T cells (17).
Conceivably, a small proportion of B lymphocytes also may lack allelic exclusion in their expression of Ig genes. To evaluate this, we examined the fidelity of allelic exclusion in B cell chronic lymphocytic leukemia (CLL)1, a monoclonal B cell malignancy. Because the blood lymphocytes of patients with this disease primarily are derived from the leukemic clone, we could screen for leukemia cell expression of more than one Ig VH gene subgroup using an anchored reverse transcriptase (RT)-PCR–ELISA assay (18). Our studies indicate that a small subset of patients have leukemia cells that express more than one Ig heavy chain allele, indicating that B cell allelic exclusion of Ig heavy chains is not absolute.
Materials and Methods
Patient Material.
Blood samples were obtained from 108 patients from the University of California at San Diego Medical Center, the Veteran's Administration Hospital at San Diego, or the Scripps Clinic (La Jolla, CA) who satisfied diagnostic criteria for B cell CLL (19). PBMC were prepared by Ficoll-Hypaque density gradient centrifugation, washed twice, and analyzed directly or suspended in fetal calf serum containing 10% dimethylsulfoxide for frozen storage in liquid nitrogen.
DNA Isolation and Southern Blotting.
Genomic DNA was isolated from PBMC as described (20). 10 μg of genomic DNA was digested with a fivefold excess of BamHI and HindIII, EcoRI and HindIII, or BamHI, EcoRI, or HindIII alone. Restriction enzyme– digested DNA were separated in an 0.8% agarose gel for analysis by the technique of Southern (21). Nylon membranes with transferred and denatured DNA were probed with a 32P-labeled JH probe, consisting of a 2.1-kb Sau3A fragment spanning the genomic DNA of JH2–JH6, as described (20). Stringent washing conditions consisted of two 20-min washes at 65°C in 0.1× SSC containing 0.1% NaDodSO4.
RNA Isolation and cDNA Synthesis.
Total RNA was isolated from 5 × 10⁶ PBMC using RNAzol B (Cinna/Biotex, Friendswood, TX). First strand cDNA was synthesized using 1–5 μg of total RNA, oligo-dT primer, and Superscript RT (GIBCO BRL, Gaithersburg, MD). The remaining RNA was removed with RNaseH and the cDNA was purified using QIAquick purification columns (Qiagen, Chatsworth, CA).
Poly-dG–tailing of cDNA and Anchored PCR.
The purified cDNA was poly-dG–tailed using dGTP and terminal deoxytransferase (Boehringer Mannheim, Indianapolis, IN) and purified using QIAquik purification columns (Qiagen). One fourth of the sample was subjected to primary-anchored PCR amplification using an antisense oligonucleotide primer specific for the constant region of human IgM (Cμ) and a 9:1 mixture of two anchor sensestrand primers, as previously described (18). The PCR products were purified using the QIAquik purification columns and one third of this product was used as a template for a nested PCR. This second PCR reaction was the same as the primary anchored PCR except a 5′ biotinylated Cμ-antisense primer was used that was upstream of the initial Cμ primer.
RT-PCR–ELISA.
The nested PCR product was purified using QIAquik purification columns and distributed onto ELISA wells that had been precoated with streptavidin (Sigma Chemical Co., St. Louis, MO), as described (18). Oligonucleotides corresponding to the Ig VH subgroup-specific sense-strand sequences of the leader region were labeled with digoxigenin and terminal deoxytransferase (Boehringer Mannheim). The double-stranded PCR product was denatured with 0.1 N NaOH and, after washing, it was incubated with each of the digoxigenin-labeled oligonucleotide probes for 20 min at 65°C, followed by 90 min at 42°C, as described (18). A peroxidase-conjugated antidigoxigenin antibody was used to detect the bound probe. The wells were subsequently washed and then incubated with tetramethylbenzidine and peroxidase (Kirkegaard & Perry Labs. Inc., Gaithersburg, MD). The reaction was stopped with 1 M O-phosphoric acid (Fisher Scientific, Pittsburgh, PA) and the optical densities were measured at 450 nm using an ELISA microplate reader (Molecular Devices Corp., Menlo Park, CA).
Cloning and Nucleic Acid Sequence Analysis.
The cDNA from each patient was amplified using primers specific for the sense strand of the leader sequence of the Ig VH gene of interest and an antisense JH consensus sequence containing flanking restriction sites for EcoRI or HindIII, as described (22). The fragments were digested with EcoRI and HindIII, purified, ligated into pUC19 vector (Bluescribe™; Stratagene Corp., La Jolla, CA) that had been similarly digested. The ligated plasmid was used to transform competent Escherichia coli (Stratagene Corp.). The plasmids containing the insert were isolated for double-stranded DNA sequence analysis (Pharmacia Biotech, Piscataway, NJ) on an automated nucleic acid sequence analyzer (Applied Biosystems, Foster City, CA). Sequences were analyzed using the EMBL/GenBank/DDBJ database.
Flow Cytometric Analysis.
Immunofluorescence analyses of PBMC were performed on a FACS®-Calibur flow cytometer (Becton Dickinson, San Jose, CA), as described (23). In addition to labeling cells with fluorochrome-conjugated mAbs, the leukemia cells also were stained with propidium iodide to label dead cells red when excited by the argon laser. This allowed for electronic gating on live cells during the analysis. Overall, cell viability generally exceeded 95%. B6, a murine IgG1 mAb that reacts with a major cross-reactive idiotype (CRI) present on a subset of Ig encoded Ig VH3 genes (24), originally was provided by R. Mageed and R. Jefferis (University of Birmingham, Birmingham, U.K.). Lc1, a murine IgG1 mAb that reacts with a supratypic cross-reactive idiotype present on a large subset of Ig encoded by Ig VH4 genes (25), was originally obtained from J.G. Sissons (Cambridge University, Cambridge, U.K.; 26). The nonspecific mouse IgG1 (MOPC21) was purchased from CALTAG (South San Francisco, CA). HB57 (DA4-4), a murine IgG1 antihuman (anti-hu) μ heavy chain mAb producing hybridoma (27), was obtained from the American Type Culture Collection (Rockville, MD). The HB-57 (anti-hu IgM) mAb was produced and purified from ascites, as described (23). Modified staphylococcal protein A (SpA), a 45-kD bacterial “superantigen” that reacts with most Ig of the VH3 subgroup (28), was provided by G. Silverman (University of California at San Diego, La Jolla, CA). B6 and SpA were conjugated to biotin, allowing for detection of cell-bound reagent with avidinphycoerythrin. Lc1, HB-57, and MOPC21 were conjugated to FITC, as described (23). To compare the fluorescence-staining intensities of leukemic cells from different patients, we computed the mean fluorescence intensity ratio (MFIR). The MFIR for a given antigen is defined as the mean fluorescence intensity of gated B cells stained with an antigen-specific fluorochrome-conjugated mAb divided by the mean fluorescence intensity of such cells stained with a fluorochrome-conjugated isotype control mAb or reagent of irrelevant specificity.
Results
Identification of Ig VH Subgroups by Anchored RT-PCRELISA.
Total RNA was isolated from the blood lymphocytes of 108 patients that satisfied diagnostic and clinical criteria for B cell CLL. More than 90% of the lymphocytes of each sample expressed surface IgM and/or IgM/IgD, and CD5. 61 of these leukemia cell samples expressed κ light chains (56%), whereas the remaining 47 samples expressed λ light chains (44%).
We determined the Ig heavy chain subgroup expressed by these cells using an anchored RT-PCR–ELISA (18). This technique generates Ig cDNA from each sample with biotin attached to the 5′ end of the antisense strand, allowing this strand to become tethered to a plastic plate coated with streptavidin. Equal amounts of the Ig cDNA from each sample were dispensed into separate wells of a streptavidincoated ELISA microtiter plate. After washing away the denatured and unbound sense strand, each well received a digoxigenin-labeled oligonucleotide probe corresponding to one of the major Ig VH gene subgroups. The bound oligonucleotide probes were detected using an alkaline-phosphatase–conjugated antidigoxigenin antibody that subsequently was developed with a chromogenic substrate. After a 15-min incubation at room temperature, the optical densities at 450 nm (OD450) of each well were recorded using an ELISA plate reader. Through this method, we simultaneously could evaluate the relative contributions of each Ig VH gene subgroup to the total Ig cDNA.
Through these analyses we delineated five major subgroups. 40 (37%) of the 108 samples had Ig cDNA that only hybridized with oligonucleotides specific for the VH1 and VH7 subgroups (Table 1, group I, boxed value), these samples having a mean OD450 of 0.470 (± SD = 0.238). The mean OD450 of wells with oligonucleotide probes for each of the other subgroups were significantly lower (P <0.001, Bonferroni t test), each value being ⩽0.002 (Table 1). A recent study of the nucleotide sequences of the Ig cDNA expressed by these samples confirmed that each expressed Ig VH1 (39 samples) or VH7 genes (1 sample) (29). 2 (2%) of the 108 samples had cDNA that reacted only with the oligonucleotide probe specific for Ig VH2 genes (Table 1, group II, boxed value). Again, the mean OD450 of 0.282 (± SD = 0.069) for wells with the Ig VH2 probe was significantly higher than that of any of the other wells with other Ig VH subgroup probes (P <0.001, Bonferroni t test) (Table 1). Similarly, 41 (38%) had cDNA that reacted only with probes for the VH3 subgroup (Table 1, group III, boxed value), 13 (12%) generated cDNA that reacted only with probes for the VH4 subgroup (Table 1, group IV), 6 (6%) generated cDNA that reacted only with probes for the VH5 subgroup (Table 1, group V), and none generated cDNA that reacted with the VH6 subgroup probe. Again, for each group, the mean OD450 for wells with probes for one Ig VH subgroup probe (boxed values) was significantly higher than that of wells with any of the other Ig VH subgroup probes (P <0.001, Bonferroni t test).
Table 1.
IgVH Subgroup OD (± SD)
| Group | VH1 | VH2 | VH3 | VH4 | VH5 | VH6 | ||||||
|---|---|---|---|---|---|---|---|---|---|---|---|---|
| I | 0.470 (±0.238) | 0.002 (±0.004) | 0.000 (±0.005) | 0.002 (±0.002) | 0.001 (±0.003) | 0.001 (±0.001) | ||||||
| II | 0.002 (±0.001) | 0.282 (±0.069) | 0.001 (±0.002) | 0.000 (±0.000) | 0.001 (±0.000) | 0.001 (±0.002) | ||||||
| III | 0.001 (±0.003) | 0.002 (±0.004) | 0.475 (±0.239) | 0.002 (±0.003) | 0.001 (±0.002) | 0.001 (±0.001) | ||||||
| IV | 0.002 (±0.002) | 0.001 (±0.002) | 0.001 (±0.001) | 0.553 (±0.268) | 0.001 (±0.002) | 0.001 (±0.001) | ||||||
| V | 0.001 (±0.001) | 0.001 (±0.002) | 0.001 (±0.002) | 0.002 (±0.002) | 0.563 (±0.230) | 0.002 (±0.002) | ||||||
The far left column provides the roman numeral designator for each group. The columns to the right are labeled at the top with the Ig VH subgroup oligonucleotide used to probe the tethered Ig cDNA. (Because the Ig VH1 and VH7 subgroup share high homology in their respective leader sequences, the probe for Ig VH1 gene also reacts to the leader sequences of Ig VH7 genes.) The numbers in each column provide the mean OD450 for all the samples within the group for the indicated oligonucleotide probe. The numbers in parentheses provide the standard deviation about the mean.
6 of the 108 samples (5%), however, had cDNA that reacted with probes for more than one Ig VH gene subgroup in each of three separate experiments (Table 2). 4 had Ig cDNA that reacted equally well with probes for the Ig VH3 and Ig VH4 subgroups (P1, P2, P4, and P5), but not with probes specific for any of the other Ig VH subgroups (Table 2). One sample (P4) had Ig cDNA that reacted equally well with probes specific for the Ig VH2 and Ig VH3 subgroups, but not probes for any of the other Ig VH gene subgroups (Table 2). Finally, one sample (P3) had Ig cDNA that reacted equally well with probes specific for the Ig VH2 and VH4 subgroups, but reacted twice as well with probes specific for the Ig VH3 subgroup (Table 2). The Ig cDNA for this sample, however, did not react with oligonucleotide probes specific for any of the other Ig VH gene subgroups.
Table 2.
Ig VH Subgroup OD (± SE)
| Sample | VH1 | VH2 | VH3 | VH4 | VH5 | VH6 | ||||||
|---|---|---|---|---|---|---|---|---|---|---|---|---|
| P 1 | 0.002 (±0.001) | 0.001 (±0.000) | 0.633 (±0.287) | 0.733 (±0.287) | 0.001 (±0.001) | 0.001 (±0.001) | ||||||
| P 2 | 0.001 (±0.000) | 0.002 (±0.001) | 0.600 (±0.082) | 0.600 (±0.141) | 0.001 (±0.002) | 0.001 (±0.001) | ||||||
| P 3 | 0.001 (±0.001) | 0.361 (±0.060) | 0.667 (±0.067) | 0.315 (±0.015) | 0.001 (±0.001) | 0.001 (±0.001) | ||||||
| P 4 | 0.002 (±0.001) | 0.000 (±0.001) | 0.840 (±0.118) | 0.859 (±0.181) | 0.001 (±0.001) | 0.001 (±0.000) | ||||||
| P 5 | 0.001 (±0.002) | 0.001 (±0.000) | 0.610 (±0.271) | 0.663 (±0.187) | 0.001 (±0.001) | 0.001 (±0.000) | ||||||
| P 6 | 0.001 (±0.000) | 0.847 (±0.152) | 0.943 (±0.222) | 0.001 (±0.001) | 0.001 (±0.001) | 0.001 (±0.001) | ||||||
The far left column (Sample) provides the designator for each patient sample. The columns to the right are labeled as in Table 1. The numbers in each column provide the mean OD450 for the sample in each of three separate experiments for the indicated oligonucleotide probe. The numbers in parentheses provide the standard error about the mean.
Southern Blot Analysis.
To evaluate the clonality of these leukemia populations, genomic DNA was digested with BamHI and HindIII restriction enzymes and analyzed by Southern blotting using a radiolabeled JH-specific probe. Five of the six samples had Ig gene rearrangements involving both alleles (Fig. 1, lanes 1, 2, and 4–6) and one sample, P3, had evidence for three Ig gene rearrangements (Fig. 1, lane 3). The genomic DNA of each leukemic cell sample lacked a strong band corresponding to the germline nonrearranged DNA present in human placenta DNA (Fig. 1, P).
Figure 1.

Southern blot analysis. Placenta and leukemia cell genomic DNA were digested with BamHI and HindIII for Southern blot analysis using a human JH region probe. The molecular weight markers of λ DNA digested with HindIII are shown at the far left. (P, placenta; 1, P1; 2, P2; 3, P3; 4, P4; 5, P5; 6, P6.)
Nucleic Acid Sequence Analyses.
Nucleic acid sequence analyses of Ig cDNA demonstrated that each sample had two distinct and productively rearranged Ig VH genes that corresponded to the subgroups detected in the anchored RT-PCR– ELISA (Table 1). Each of the isolated VH genes had productive gene rearrangements without introduced frameshift or nonsense mutations. Comparison of the nucleic acid sequence of the cloned Ig VH genes to known germline genes revealed that sample P4 expressed Ig VH with highest homology to VH3-30 (99% homology) and VH4-b (90% homology), sample P6 expressed VH genes that were most homologous to VH2-70 (90% homology) and VH3-30.3 (88% homology), sample P1 used VH genes with highest homology to VH3-33 (99% homology) and VH4-39 (98% homology), sample P2 had VH with highest homology to VH3-7 (97% homology) and VH4-39 (99% homology), and sample P5 expressed Ig VH genes with 98% homology to VH3-2 and 96% homology to VH4-61. From sample P3 we isolated three VH genes that had highest homology to VH2-70, VH3-7, and VH4-59 (88, 100, and 99% homology, respectively; Fig. 2). We did not detect any intraclonal diversity when we sequenced two separate clones from each RT-PCR reaction.
Figure 2.
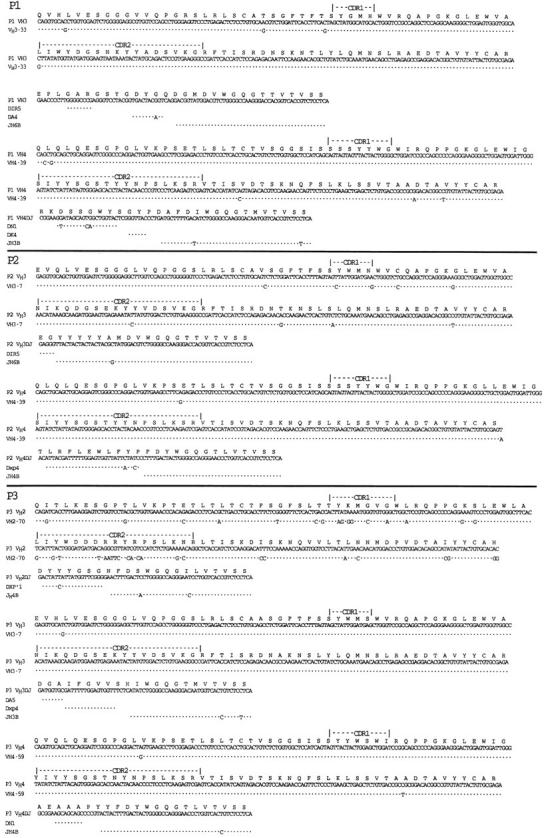
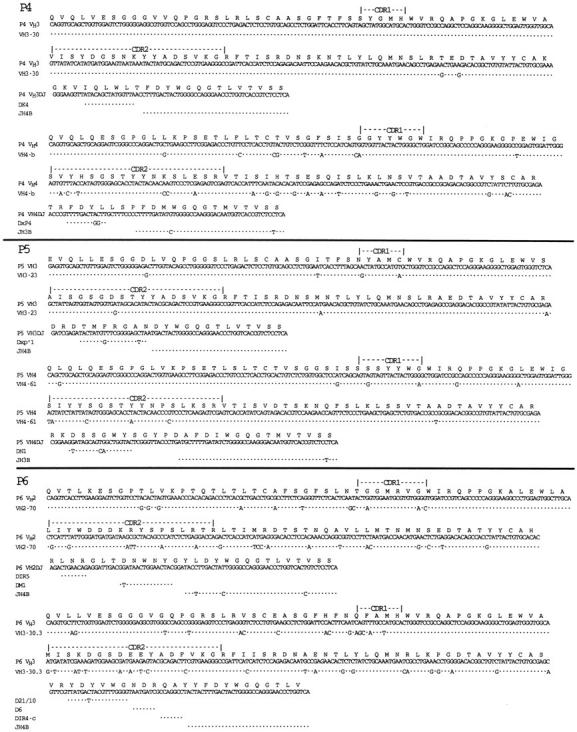
Nucleic acid sequence data of the rearranged Ig VH genes isolated from the CLL samples lacking Ig heavy chain allelic exclusion. The deduced amino acid sequence using the 20-letter code is provided at the top of each sequence, along with descriptors marking the deduced CDR1 and CDR2 for each isolated VH gene. Each sequence is compared to germline VH gene, D segment, or JH segment having the highest nucleic acid sequence homology, indicated on the far left-hand side of the figure. (Dot, base identity). These sequence data are available from EMBL/GenBank/DDBJ under the following accession numbers: P1, U96277 and U96278; P2, U96279 and U96280; P3, U96281, U96282, and U96283; P4, U96284 and U96285; P5, U96286 and U96287; P6, U96288 and U96289.
Evaluation of the sequence data allowed us to deduce the probable D and JH segments used to generate the sequence encoding the third complementarity determining region (CDR3) of each Ig gene. We deduced that the DH-containing irregular spacer signal 5 (DIR5) gene segment was probably used to generate the sequence encoding the CDR3 of the two VH3-encoded genes of samples P1 and P2 (Fig. 2) or the VH2-70–encoded genes of P6 (Fig. 2). The DXP4 gene segment was probably used to generate the CDR3-encoding sequence detected in the rearrangements involving two of the six patient samples (Fig. 2, P3 and P2). In addition, the DN1 gene segment was rearranged to each of the VH4 genes expressed by three patient samples (Fig. 2, P3, P1, and P5). We deduced that either JH4B or JH3B were used in each of the rearranged Ig genes except for the rearranged VH3 genes of samples P1 or P2 (Fig. 2). The latter two apparently used the JH6B minigene segment (Fig. 2).
Despite expressing two, or in one case three, Ig heavy chains, each sample was found to express only one functional Ig light chain gene. To determine the rearranged Ig light chain gene of each sample, we performed RT-PCR and sequence analysis directly on the poly-dG–tailed cDNA template isolated from each κ light chain–expressing patient sample using an anchor sense-strand primer and an antisense-strand primer specific for the constant region of the Ig κ light chain gene. The cells from patients P1 or P5 expressed Ig light chain genes belonging to the Vκ1 family (96% homology to DPK5 and 92% to DPK7, respectively) rearranged to the Jκ5 and Jκ2 minigenes, respectively. Samples P3 or P2 had B cells that rearranged Ig light chain genes belonging to the Vκ2 subgroup (94% homology to DPK18 and 86% homology to DPK16, respectively), and to Jκ2 and Jκ1, respectively. The B cells of patient P4 expressed rearranged Ig light chain genes belonging to the Vκ4 subgroup (95% sequence homology to DPK24). This Vκ gene rearranged to Jκ2 minigene (Fig. 3).
Figure 3.

Nucleic acid sequence data of the rearranged light chain genes isolated from the CLL samples lacking Ig heavy chain allelic exclusion. The deduced amino acid sequence using the 20-letter code is provided at the top of each sequence, along with descriptors marking the deduced CDR1 and CDR2 for each isolated Vκ gene. Each sequence is compared to germline Vκ gene or Jκ segment having the highest nucleic acid sequence homology, indicated on the far left-hand side or top of the sequence, respectively. (Dot, base identity). These sequence data are available from EMBL/GenBank/DDBJ under the following accession numbers: P1, U96290; P2, U96291; P3, U96292; P4, U96293; P5, U96294.
Flow Cytometric Analyses.
From the primary sequence data, we deduced that the Ig expressed by some of these CLL samples should react with Lc1, a mAb reactive with a CRI present on Ig encoded by a subgroup of Ig VH4 genes such as VH4-39, VH4b (DP67), VH4-59, or VH4-61 (25, 30), and B6, an mAb anti-CRI present on Ig encoded by certain Ig VH3 genes, namely VH3-23, VH3-30, or VH3-30 (24), and/or modified SpA, a 45-kD bacterial superantigen that reacts with the variable region of most Ig heavy chains belonging to the VH3 subgroup (28).
The Ig molecules encoded by the VH3-30, VH3-30.3, VH3-33, VH3-7, or VH3-23 genes expressed by the B cells of patients P4, P3, P6, P1, P2, and P5 were expected to react with SpA and/or B6, whereas the Ig encoded by the VH4-b, VH4-59, VH4-39, or VH4-61 genes expressed by the B cells of patients P4, P3, P1, P2, and P5 were expected to react with Lc1 (Table 3). Flow cytometric analyses revealed that the leukemia cells from these samples reacted specifically with Lc1 and SpA and/or B6, but not with control mAbs of irrelevant specificity, as predicted from the sequence analysis (Fig. 4, P3, P5, P4, and P2, and Table 3).
Table 3.
CLL Samples That Lack Ig Heavy Chain Allelic Exclusion
| Sample | VH gene | Percent homology | Anticipated phenotype | SpA | B6 | Lc1 | μ | |||||||
|---|---|---|---|---|---|---|---|---|---|---|---|---|---|---|
| P1 | VH3-33 | 99 | SA+ | N.T. | ||||||||||
| VH4-39 | 98 | Lc1+ | N.T. | |||||||||||
| P2 | VH3-7 | 97 | SA+/B6+ | 2.4 | 1.4 | |||||||||
| VH4-39 | 99 | Lc1+ | 10 | 9.5 | ||||||||||
| P3 | VH2-70 | 88 | – | |||||||||||
| VH3-7 | 100 | SA+/B6+ | 1.9 | 1.4 | ||||||||||
| VH4-59 | 99 | Lc1+ | 1.6 | 1.9 | ||||||||||
| P4 | VH3-30 | 99 | SA+/B6+ | 3 | 1.8 | |||||||||
| VH4-b | 90 | Lc1+ | 9.4 | 7.2 | ||||||||||
| P5 | VH3-23 | 98 | SA+/B6+ | 1.8 | 2.1 | |||||||||
| VH4-61 | 96 | Lc1+ | 4.9 | 7.4 | ||||||||||
| P6 | VH2-70 | 90 | – | |||||||||||
| VH3-30.3 | 88 | SA+/B6+ | N.T. | N.T. |
The far left column (Sample) provides the designator for each sample (P1–P6). The second column (VH gene) lists the germline Ig VH genes that have the highest homology with the Ig VH genes isolated from each sample. The percent homology column lists the percent sequence homology between the isolated VH gene and the deduced germline VH gene having the highest base sequence homology. The Anticipated Phenotype column provides the expected reactivity of the surface Ig with the anti-CRI or anti-VH subgroup reagents. The columns labeled SpA, B6, Lc1, or μ provide the observed MFIR of the leukemia cell population stained with each of these reagents relative to that of the cells stained with an isotype control mAb. N.T., sample was not tested.
Figure 4.
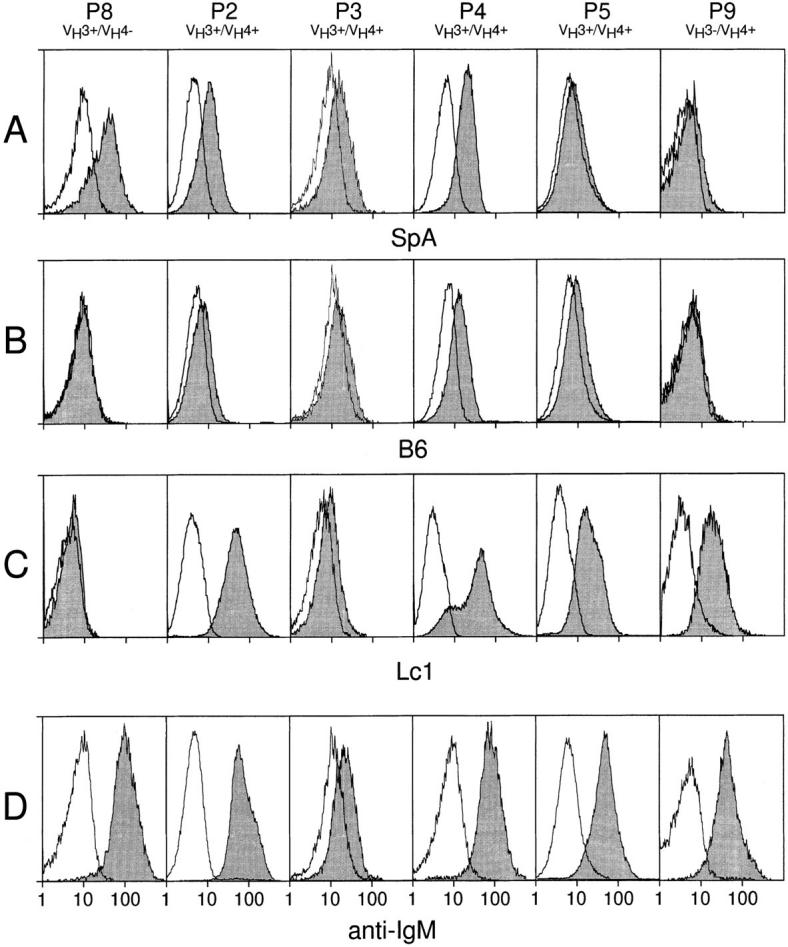
Flow cytometric analysis of surface Ig. Open histograms depict staining with FITC-conjugated control mAb, whereas shaded histograms depict staining with SpA (A), B6 (B), Lc1 (C), or anti-μ (anti-IgM, D). Each column represents the flow cytometric analyses performed on one leukemia cell sample, indicated at the top of each column along with its identified Ig VH genotype. The histograms at the bottom of each column have abscissas indicating the relative logarithmic fluorescence intensity. Control leukemic B cells of sample P8 stained only with SpA, whereas control leukemia cells of sample P9 stained only with Lc1. B cells from P3, P5, P4, or P2 showed significant staining with Lc1 and SA and/or B6.
The MFIRs of these samples were compared with those of control leukemia cell populations that expressed Ig VH genes belonging to only one subgroup. Analyses of four leukemia cell samples that expressed only Ig VH3 genes revealed these samples to have a mean MFIR with SpA of 3.9 (± SD = 1.8), and a mean MFIR with Lc1 of 1.1 (± SD = 0.2). For example, the leukemic B cells from patient P8 expressed only Ig VH genes of the VH3 subgroup and with SpA had a MFIR of 5.2 (Fig. 4, row A, far left). In contrast, this sample did not react with B6 or Lc1 (Fig. 4, rows B and C, far left), having MFIRs with each of these reagents of 0.9 or 1.0, respectively. Similarly, analyses of four different leukemia cell samples that expressed only Ig VH4 genes, encoding Lc1-reactive Ig, revealed these samples to have a mean MFIR with SpA of 1.1 (± SD = 0.1), a mean MFIR with B6 of 1.1 (± SD = 0.2), and a mean MFIR with Lc1 of 5.0 (± SD = 2.2). For example, the B cells from sample P9 stained only with Lc1 (Fig. 4, row C, far right), having a MFIR for Lc1 of 5.0, but MFIR of 1.1 or 1.0 with SpA or B6, respectively (Fig. 4, rows A and B, far right). In contrast, samples P2, P3, P4, or P5 had MFIRs >1 after staining with either SpA (Fig. 4, row A), B6 (Fig. 4, row B) or Lc1 (Fig. 4, row C) (Table 3). Moreover, the mean MFIR with SpA for these samples (2.3 ± 0.6, SD) is significantly higher than that with SpA for the four leukemia samples tested that expressed only Ig VH4 genes (P <0.01, Student's t test). Also, the mean MFIR with Lc1 for P2, P3, P4, and P5 (6.5 ± 4.0, SD) is significantly higher than that with Lc1 for the four leukemia samples tested that expressed only Ig VH3 genes (P <0.05, Student's t test). However, the mean MFIRs observed with the anti-hu IgM mAb with the leukemia cell samples that exclusively expressed Ig VH3 or Ig VH4 (namely, 7.0 ± 0.2 (SD) or 8.7 ± 1.3 (SD), respectively) were not significantly different from that observed with anti-IgM for these variant leukemia cell samples (6.5 ± 3.2 (SD), P >0.05, Bonferroni t test). In each case, the relative staining intensity observed with the anti-hu IgM mAb correlated with that observed with the antisubgroup reagents found to react with the leukemia cells (Fig. 4, row D, and Table 3). Moreover, the low staining intensities observed with any of the anti-Ig reagents reflects the low level expression of surface Ig that is a noted characteristic for B cell CLL (19).
Discussion
We examined the Ig VH genes expressed by the leukemia cells of 108 patients by an anchored RT-PCR–ELISA technique. In most cases, we detected expression of only one Ig VH subgroup, consistent with previous findings that each leukemia cell population uses only one Ig heavy chain. However, in six samples (5%) we detected Ig VH gene transcripts of more than one Ig VH subgroup. Conceivably, this may have been secondary to an artifact of the anchored RT-PCR–ELISA technique. Although we used probes specific for each of the major Ig VH gene subgroups, these exceptional leukemia cell samples may have had unusual VH gene sequences that hybridized with probes for more than one Ig VH gene subgroup. Alternatively, our technique may have detected expression of VH genes from bystander B cells that were not related to the leukemia B cell clone. Finally, each of these leukemic populations itself may have been heterogeneous.
However, we found that none of these explanations could describe our findings. First, although the RT-PCR–ELISA revealed the Ig cDNA from these samples reacted with oligonucleotide probes for two or, in one case, three Ig VH gene subgroups, the Ig cDNA of each sample did not hybridize with all probes for each of the Ig VH gene subgroups, including those specific for major Ig VH gene subgroups, such as Ig VH1 (Table 2). These hybridization patterns are very distinct from those observed with Ig cDNA generated from heterogeneous populations of normal B cells (18). Second, Southern blot analyses of the Ig heavy chain genes rearranged in each sample revealed each to have two or, in one case (P3), three Ig rearrangements (Fig. 1). Furthermore, the absence of a strong germline band in the genomic DNA of these blood mononuclear cell samples argued that each was comprised mostly of leukemic B cells. Third, nucleic acid sequence analyses of the Ig cDNA revealed that each of these samples had disparate functional VH gene transcripts that corresponded to the VH gene subgroups detected in the RT-PCR–ELISA. Finally, we found that each sample expressed only one functional light chain gene. Collectively, these findings indicate that the two or, in one case, three different Ig VH gene cDNA isolated from each of these samples were derived from a single clone of leukemic B cells.
Flow cytometric analyses provided evidence that each of these leukemic B cell populations expressed more than one Ig heavy chain protein. We noted that several samples expressed Ig VH4 or VH3 genes that were highly homologous to germline genes known to encode Ig molecules that could react with either Lc1, B6, and/or SpA, respectively. Lc1 is a mAb that reacts with a CRI present on a subset of VH4 genes (25, 30), whereas modified SpA is a 45-kD bacterial superantigen that reacts with Ig encoded by most VH3 genes (28). B6 is another mAb anti-CRI that reacts with Ig encoded by only a subset of VH3 genes (24). Flow cytometry analysis revealed that the leukemia cell populations indeed reacted with these reagents, as predicted from the primary sequences of the isolated Ig heavy chain genes (Fig. 4, rows A–C, columns 2–5, and Table 3). In contrast, such double staining was not observed for other leukemic cells samples that expressed Ig VH genes of only one subgroup (Fig. 4, rows A–C, columns 1 and 6, and data not shown). Collectively, these data reveal that a subset of patients with CLL have leukemic B cells that express more than one Ig heavy chain.
In one sample, P4, the shape of the fluorescence histogram of cells stained with Lc1 revealed a shoulder of dullstaining cells (Fig. 4, row C, column 4) that was not observed in the fluorescence histograms of these same cells stained with SpA (Fig. 4, row A, column 4) or B6 (Fig. 4, row B, column 4). This discrepancy makes it unlikely that the noted staining with SpA or B6 is due to cross-reactivity of these reagents for the Lc1-positive surface Ig expressed by these cells. The fluorescence histogram of these same cells stained with the anti-hu IgM mAb also failed to demonstrate this shoulder (Fig. 4, row D, column 4), possibly reflecting an averaging of surface densities of both types of surface Ig on this leukemia cell population. Nevertheless, for the other variant leukemia cell samples, the noted shift in the overall fluorescence histograms of the positively stained cells also correlated with that noted for cells stained with anti-IgM mAb, making it unlikely that only a subset of the cells in each sample expressed only Ig of one or the other Ig VH subgroup.
These findings indicate that Ig heavy chain allelic exclusion is not absolute and suggest that a subset of normal human B cells also may express dual Ig receptors. Brezinschek et al. noted in a recent study of the Ig heavy chains expressed by isolated B cells using single-cell Ig PCR that 1 of the 74 single-cell samples had two productively rearranged PCR products (31). Although this was explained as being secondary to possible sample-well contamination, it is conceivable that this well instead contained a single B cell that expressed two Ig heavy chains. Furthermore, in a recent study using sensitive multiparameter flow cytometric analyses, Giachino et al. estimated that 0.2–0.5% of human blood B cells from healthy adults may express both κ and λ light chains (32), suggesting that light chain allelic exclusion also may not be absolute. Although we did not detect any κ and λ light chains expressing leukemia cell samples in our study, it is possible that a critical analysis of the light chain V gene subgroups in all our samples also may have detected a few cases that expressed more than one type of κ or λ light chain. This was not found to be the case, however, for those samples found to express more than one Ig heavy chain, arguing against the possibility that these samples lacked the normal regulatory mechanisms governing both light and heavy chain allelic exclusion.
Rather, the structural analyses of the Ig VH genes expressed by the CLL samples lacking allelic exclusion suggest that there may be selection for expression of two antibodies with different binding specificities. We deduced that one of the expressed Ig VH genes in several cases (P1, P3, P4, P5, or P6) had incurred somatic mutations resulting in a relatively high ratio of deduced replacement mutations (R) to silent mutations (S) in the CDRs. For example, an R/S ratio of six or seven for the deduced mutations in the CDR1 and CDR2 of the VH2 genes, respectively expressed by P3 or P6, are higher than the innate R/S ratio of 3.8 predicted for random base substitutions in the CDR of these VH genes (33). Mutations resulting in higher R/S ratios in the CDR than expected by chance commonly are noted in the Ig V genes expressed by B cells selected in a secondary antigendriven immune response (34–37). Conceivably, the allele with the deduced somatic mutations (the VH2 gene of P3 or P6, the VH3 gene of P5, or the VH4 gene of P1) had undergone rearrangement first and was expressed by the B cell clone during an antigen-driven immune response. Should mutations within the expressed Ig VH gene result in an Ig that reduced the fitness of the B cell clone, then there may have been selective advantage for cells that could rearrange and express the other nonmutated Ig heavy chain allele (e.g., the VH3 genes of P1, P3, and P5, or the VH4 genes of P2 and P3).
A similar model has been used to explain the findings of studies on mice engineered to express transgenic Ig reactive with self antigens (38–40). These mice may generate transgene-expressing B cells that also rearrange and express their endogenous Ig genes, thereby presumably allowing these cells to escape negative selection. This mechanism also has been used to explain the observed examples of Ig-receptor editing (41, 42), in which autoantibody-expressing B cells undergo secondary Ig heavy chain rearrangements that allow them to express new Ig molecules with altered antigen-binding specificities. In this regard, it is noteworthy that the CLL B cells are frequently found to make IgM autoantibodies (reviewed in reference 43). Conceivably, expression of such autoantibodies also may favor selection of cells that undergo such reiterative Ig gene rearrangements, particularly if their original Ig receptors develop enhanced binding activity for self antigen through somatic mutation. On the other hand, there may be selection to maintain these B cells that manifest multiple binding specificities. In either case, B cells lacking allelic exclusion may have a selective advantage.
Acknowledgments
This work was supported in part by National Institutes of Health grant R37-CA49870RO1.
Footnotes
We are thankful to Dr. Gregg J. Silverman for the modified SpA used in this study and for his helpful comments. The authors also are grateful to Esther D. Avery and Todd A. Johnson for their assistance in this study.
1 Abbreviations used in this paper: anti-hu, anti-human; CDR, complementarity determining region; CLL, chronic lymphocytic leukemia; CRI, cross-reactive idiotype; MFIR, mean fluorescence intensity ratio; R, replacement mutation; RT, reverse transcriptase; S, silent mutation; SpA, staphylococcal protein A.
References
- 1.Matsuda F, Shin EK, Hirabayashi Y, Nagaoka H, Yoshida MC, Zong SQ, Honjo T. Organization of variable region segments of the human immunoglobulin heavy chain: duplication of the D5 cluster within the locus and interchromosomal translocation of variable region segments. EMBO (Eur Mol Biol Organ) J. 1990;9:2501–2506. doi: 10.1002/j.1460-2075.1990.tb07429.x. [DOI] [PMC free article] [PubMed] [Google Scholar]
- 2.Walter MA, Surti U, Hofker MH, Cox DW. The physical organization of the human immunoglobulin heavy chain gene complex. EMBO (Eur Mol Biol Organ) J. 1990;9:3303–3313. doi: 10.1002/j.1460-2075.1990.tb07530.x. [DOI] [PMC free article] [PubMed] [Google Scholar]
- 3.Cook GP, Tomlinson IM, Walter G, Riethman H, Carter NP, Buluwela L, Winter G, Rabbitts TH. A map of the human immunoglobulin VHlocus completed by analysis of the telomeric region of chromosome 14q. Nat Genet. 1994;7:162–168. doi: 10.1038/ng0694-162. [DOI] [PubMed] [Google Scholar]
- 4.Pascual V, Capra JD. Human immunoglobulin heavy-chain variable region genes: organization, polymorphism, and expression. Adv Immunol. 1991;49:1–74. doi: 10.1016/s0065-2776(08)60774-9. [DOI] [PubMed] [Google Scholar]
- 5.Cook GP, Tomlinson IM. The human immunoglobulin VHrepertoire. Immunol Today. 1995;16:237–242. doi: 10.1016/0167-5699(95)80166-9. [DOI] [PubMed] [Google Scholar]
- 6.Alt FW, Yancopoulos GD, Blackwell TK, Wood C, Thomas E, Boss M, Coffman R, Rosenberg N, Tonegawa S, Baltimore D. Ordered rearrangement of immunoglobulin heavy chain variable region segments. EMBO (Eur Mol Biol Organ) J. 1984;3:1209–1219. doi: 10.1002/j.1460-2075.1984.tb01955.x. [DOI] [PMC free article] [PubMed] [Google Scholar]
- 7.Kipps, T.J. 1995. Functions of B lymphocytes and plasma cells in immunoglobulin production. In Williams Hematology. E. Beutler, M.A. Lichtman, B.S. Coller, and T.J. Kipps, editors. McGraw-Hill, Inc., New York. 930–938.
- 8.Kitamura D, Rajewsky K. Targeted disruption of mu chain membrane exon causes loss of heavy-chain allelic exclusion. Nature (Lond) 1992;356:154–156. doi: 10.1038/356154a0. [DOI] [PubMed] [Google Scholar]
- 9.Malissen M, Trucy J, Jouvin-Marche E, Cazenave PA, Scollay R, Malissen B. Regulation of TCR α and β gene allelic exclusion during T-cell development. Immunol Today. 1992;13:315–322. doi: 10.1016/0167-5699(92)90044-8. [DOI] [PubMed] [Google Scholar]
- 10.Borgulya P, Kishi H, Uematsu Y, von Boehmer H. Exclusion and inclusion of alpha and beta T cell receptor alleles. Cell. 1992;69:529–537. doi: 10.1016/0092-8674(92)90453-j. [DOI] [PubMed] [Google Scholar]
- 11.Malissen M, Trucy J, Letourneur F, Rebai N, Dunn DE, Fitch FW, Hood L, Malissen B. A T cell clone expresses two T cell receptor alpha genes but uses one alpha beta heterodimer for allorecognition and self MHC-restricted antigen recognition. Cell. 1988;55:49–59. doi: 10.1016/0092-8674(88)90008-6. [DOI] [PubMed] [Google Scholar]
- 12.von Boehmer H. Developmental biology of T cells in T cell–receptor transgenic mice. Annu Rev Immunol. 1990;8:531–556. doi: 10.1146/annurev.iy.08.040190.002531. [DOI] [PubMed] [Google Scholar]
- 13.Heath WR, Miller JF. Expression of two α chains on the surface of T cells in T cell receptor transgenic mice. J Exp Med. 1993;178:1807–1811. doi: 10.1084/jem.178.5.1807. [DOI] [PMC free article] [PubMed] [Google Scholar]
- 14.Padovan E, Casorati G, Dellabona P, Meyer S, Brockhaus M, Lanzavecchia A. Expression of two T cell receptor alpha chains: dual receptor T cells. Science (Wash DC) 1993;262:422–424. doi: 10.1126/science.8211163. [DOI] [PubMed] [Google Scholar]
- 15.Balomenos D, Balderas RS, Mulvany KP, Kaye J, Kono DH, Theofilopoulos AN. Incomplete T cell receptor V beta allelic exclusion and dual V beta-expressing cells. J Immunol. 1995;155:3308–3312. [PubMed] [Google Scholar]
- 16.Davodeau F, Peyrat MA, Romagne F, Necker A, Hallet MM, Vie H, Bonneville M. Dual T cell receptor β chain expression on human T lymphocytes. J Exp Med. 1995;181:1391–1398. doi: 10.1084/jem.181.4.1391. [DOI] [PMC free article] [PubMed] [Google Scholar]
- 17.Davodeau F, Peyrat MA, Houde I, Hallet MM, De Libero G, Vie H, Bonneville M. Surface expression of two distinct functional antigen receptors on human γδ T cells. Science (Wash DC) 1993;260:1800–1802. doi: 10.1126/science.8390096. [DOI] [PubMed] [Google Scholar]
- 18.Rassenti LZ, Kohsaka H, Kipps TJ. Analysis of immunoglobulin VHgene repertoire by an anchored PCRELISA. Ann NY Acad Sci. 1995;764:463–473. doi: 10.1111/j.1749-6632.1995.tb55866.x. [DOI] [PubMed] [Google Scholar]
- 19.Kipps, T.J. 1995. Chronic lymphocytic leukemia and related diseases. In Williams Hematology. E. Beutler, M.A. Lichtman, B.S. Coller, and T.J. Kipps, editors. McGraw-Hill, Inc., New York. 1017–1039.
- 20.Rassenti LZ, Pratt LF, Chen PP, Carson DA, Kipps TJ. Autoantibody-encoding kappa light chain genes frequently rearranged in lambda light chain expressing chronic lymphocytic leukemia. J Immunol. 1991;147:1060–1066. [PubMed] [Google Scholar]
- 21.Southern EM. Detection of specific sequences among DNA fragments separated by gel electrophoresis. J Mol Biol. 1975;98:503–517. doi: 10.1016/s0022-2836(75)80083-0. [DOI] [PubMed] [Google Scholar]
- 22.Rassenti LZ, Kipps TJ. Lack of extensive mutations in the VH5 genes used in common B cell chronic lymphocytic leukemia. J Exp Med. 1993;177:1039–1046. doi: 10.1084/jem.177.4.1039. [DOI] [PMC free article] [PubMed] [Google Scholar]
- 23.Kipps TJ, Meisenholder GW, Robbins BA. New developments in flow cytometric analyses of lymphocyte markers. J Clin Lab Anal. 1992;12:237–275. [PubMed] [Google Scholar]
- 24.Crowley JJ, Mageed RA, Silverman GJ, Chen PP, Kozin F, Erger RA, Jefferis R, Carson DA. The incidence of a new human cross-reactive idotype linked to subgroup VHIII heavy chains. Mol Immunol. 1990;27:87–94. doi: 10.1016/0161-5890(90)90063-6. [DOI] [PubMed] [Google Scholar]
- 25.Pratt LF, Szubin R, Carson DA, Kipps TJ. Molecular characterization of a supratypic cross reactive idiotype associated with IgM autoantibodies. J Immunol. 1991;147:2041–2046. [PubMed] [Google Scholar]
- 26.Ono M, Winearls CG, Amos N, Grennan D, Gharavi A, Peters DK, Sissons JGP. Monoclonal antibodies to restricted and cross-reactive idiotopes on monoclonal rheumatoid factors and their recognition of idiotope-positive cells. Eur J Immunol. 1987;17:343–349. doi: 10.1002/eji.1830170307. [DOI] [PubMed] [Google Scholar]
- 27.Maruyama S, Kubagawa H, Cooper MD. Activation of human B cells and inhibition of their terminal differentiation by monoclonal anti-mu antibodies. J Immunol. 1985;135:192–199. [PubMed] [Google Scholar]
- 28.Silverman GJ, Sasano M, Wormsley SB. Ageassociated changes in binding of human B lymphocytes to a VH3-restricted unconventional bacterial antigen. J Immunol. 1993;151:5840–5855. [PubMed] [Google Scholar]
- 29.Johnson TA, Rassenti LZ, Kipps TJ. Ig VH1 genes expressed in B-cell chronic lymphocytic leukemia exhibit distinctive molecular features. J Immunol. 1997;158:235–246. [PubMed] [Google Scholar]
- 30.Potter KN, Li YC, Capra JD. The cross-reactive idiotopes recognized by the monoclonal antibodies 9G4 and LC1 are located in framework region 1 of two non-overlapping subsets of human VH4 family encoded antibodies. Scand J Immunol. 1994;40:43–49. doi: 10.1111/j.1365-3083.1994.tb03431.x. [DOI] [PubMed] [Google Scholar]
- 31.Brezinschek HP, Brezinschek RI, Lipsky PE. Analysis of the heavy chain repertoire of human peripheral B cells using single-cell polymerase chain reaction. J Immunol. 1995;155:190–202. [PubMed] [Google Scholar]
- 32.Giachino C, Padovan E, Lanzavecchia A. κ+ λ+dual receptor B cells are present in the human peripheral repertoire. J Exp Med. 1995;181:1245–1250. doi: 10.1084/jem.181.3.1245. [DOI] [PMC free article] [PubMed] [Google Scholar]
- 33.Chang B, Casali P. A sequence analysis of human germline Ig VH and VL genes. The CDR1s of a major proportion of VH, but not VL, genes display a high inherent susceptibility to amino acid replacement. Ann NY Acad Sci. 1995;764:170–179. [PubMed] [Google Scholar]
- 34.Stewart AK, Schwartz RS. Immunoglobulin V regions and the B cell. Blood. 1994;83:1717–1730. [PubMed] [Google Scholar]
- 35.Shlomchik MJ, Marshak-Rothstein A, Wolfowicz CB, Rothstein TL, Weigert MG. The role of clonal selection and somatic mutation in autoimmunity. Nature (Lond) 1987;328:805–811. doi: 10.1038/328805a0. [DOI] [PubMed] [Google Scholar]
- 36.Rajewsky K, Förster I, Cumano A. Evolutionary and somatic selection of the antibody repertoire in the mouse. Science (Wash DC) 1987;238:1088–1094. doi: 10.1126/science.3317826. [DOI] [PubMed] [Google Scholar]
- 37.Weiss U, Zoebelein R, Rajewsky K. Accumulation of somatic mutants in the B cell compartment after primary immunization with a T cell-dependent antigen. Eur J Immunol. 1992;22:511–517. doi: 10.1002/eji.1830220233. [DOI] [PubMed] [Google Scholar]
- 38.Tiegs SL, Russell DM, Nemazee D. Receptor editing in self-reactive bone marrow B cells. J Exp Med. 1993;177:1009–1020. doi: 10.1084/jem.177.4.1009. [DOI] [PMC free article] [PubMed] [Google Scholar]
- 39.Vos Q, Hodes RJ. Immunoglobulin (Ig) μ, κ transgenic mice express transgenic idiotype on endogenously rearranged IgM and IgA molecules by secretion of chimeric molecules. J Exp Med. 1992;176:951–961. doi: 10.1084/jem.176.4.951. [DOI] [PMC free article] [PubMed] [Google Scholar]
- 40.Iliev A, Spatz L, Ray S, Diamond B. Lack of allelic exclusion permits autoreactive B cells to escape deletion. J Immunol. 1994;153:3551–3556. [PubMed] [Google Scholar]
- 41.Radic MZ, Erikson J, Litwin S, Weigert M. B lymphocytes may escape tolerance by revising their antigen receptors. J Exp Med. 1993;177:1165–1173. doi: 10.1084/jem.177.4.1165. [DOI] [PMC free article] [PubMed] [Google Scholar]
- 42.Gay D, Saunders T, Camper S, Weigert M. Receptor editing: an approach by autoreactive B cells to escape tolerance. J Exp Med. 1993;177:999–1008. doi: 10.1084/jem.177.4.999. [DOI] [PMC free article] [PubMed] [Google Scholar]
- 43.Kipps TJ, Carson DA. Autoantibodies in chronic lymphocytic leukemia and related systemic autoimmune diseases. Blood. 1993;81:2475–2487. [PubMed] [Google Scholar]