

Abstract
Using the method of gene targeting in mouse embryonic stem cells, regulatory function of δEF1, a zinc finger and homeodomain-containing transcription factor, was investigated in vivo by generating the δEF1 mutant mice. The mutated allele of δEF1 produced a truncated form of the δEF1 protein lacking a zinc finger cluster proximal to COOH terminus. The homozygous δEF1 mutant mice had poorly developed thymi with no distinction of cortex and medulla. Analysis of the mutant thymocyte showed reduction of the total cell number by two orders of magnitude accompanying the impaired thymocyte development. The early stage intrathymic c-kit+ T precursor cells were largely depleted. The following thymocyte development also seemed to be affected as assessed by the distorted composition of CD4- or CD8-expressing cells. The mutant thymocyte showed elevated α4 integrin expression, which might be related to the T cell defect in the mutant mice. In the peripheral lymph node tissue of the mutant mice, the CD4−CD8+ single positive cells were significantly reduced relative to CD4+CD8− single positive cells. In contrast to T cells, other hematopoietic lineages appeared to be normal. The data indicated that δEF1 is involved in regulation of T cell development at multiple stages.
Recent progress in our understanding of the T cell development clarified a major developmental pathway in thymus at cellular level: T cell precursors that originate from hematopoietic stem cells located in fetal liver and in adult bone marrow migrate and colonize in thymus. Starting from the CD4−CD8− double negative (DN)1 stage, thymocytes begin to rearrange their TCR genes and express CD3, a TCR coreceptor molecule, then proceed to the CD4+CD8+ double positive (DP) stage. The DP thymocytes go through positive and negative selections depending on the specificity of the TCR. Finally, the CD4+CD8− or CD4−CD8+ single positive (SP) mature thymocytes are produced, and these immunocompetent cells migrate out and populate the peripheral lymphoid organs (1).
Some of these steps have been assigned to specific genes, and mutant mice of such genes produced by gene targeting have contributed greatly in defining each regulatory step of T cell development (2). However, it is obvious that more knowledge of genetic regulation is required to understand cellular events in T cell development. The δEF1 mutant mice to be reported in this paper has a novel phenotype: only T cells are affected among hematopoietic lineages and major defects are found in early T cell precursors, thus defining a new step in T cell development.
δEF1 was originally identified as an enhancer binding factor of the chicken δ1-crystallin gene (3). δEF1 is a unique protein in that it has multipartite DNA-binding motifs, containing two Krüppel-type C2H2 zinc finger clusters located close to NH2 and COOH termini and a homeodomain in between (4). Subsequent analysis showed that δEF1 possesses repressive activity on transcription (5), and that δEF1 is expressed besides lens cells in various anlages of developing tissues, such as notochord, myotome, limb bud, and neural crest derivatives in chickens (4) and mice (Takagi T., H. Kondoh, and Y. Higashi, unpublished results), suggesting that δEF1 is involved in regulation of a number of genes other than the crystallin genes (6–8).
To clarify the regulatory function of δEF1 and to understand the functional significance of the multipartite DNAbinding motifs in vivo, we have initiated a study using δEF1 mutant mice of several different alleles generated by the gene targeting technique. So far, we have produced two δEF1 mutant alleles of mice: one, a null mutation, in which most of the coding sequence was replaced by bacterial β-galactosidase (Null–LacZ), the other coding for a truncated protein lacking only the COOH-proximal zinc finger clusters (ΔC-fin). Unexpectedly, as presented in this report, one of the major phenotype of both homozygous mutant mice was impairment of thymus development: severe hypocellularity in thymus without clear distinction of cortex and medulla. Since Null–LacZ homozygous mutant mice are perinatally lethal with skeletal defects (to be published elsewhere), while ∼20% of the ΔC-fin homozygous mutant mice were born alive and grown up to adulthood, we analyzed the lymphoid tissues in detail using the surviving young adult ΔC-fin homozygous mutant mice. Here we describe the generation and analysis of ΔC-fin mutant mice and demonstrate that the defect of the thymus was ascribed to depletion of T precursor cells and to aberration of intrathymic development of T cells.
Materials and Methods
Mice.
C57BL/6 and ICR mice were purchased from Japan SLC Inc. (Shizuoka, Japan) or CLEA Japan Inc. (Tokyo, Japan). All mice were maintained under specific pathogen-free conditions.
Construction of Targeting Vector.
Cloning and structural analysis of mouse δEF1 has been described (9). The targeting vector (see Fig. 2 A) was constructed as follows. A 0.8-kb SalI–SalI fragment containing a Sau3AI–SalI genomic fragment of the exon 6 sequence (see Fig. 2 A) and a 12-bp SalI–BamHI adapter sequence which is derived from an EMBL3 cloning vector, was subcloned into the SalI site of pBlueScript II to give pSS. The SalI and XbaI sites at the 5′ end of the inserted genomic fragment of pSS were inactivated by digesting with XbaI, partially with SalI, blunt-ending by fill-in, and self-ligation. A XbaI linker carrying stop codons in all three frames (CTAGTCTAGACTAG) was inserted in the remaining SalI site at the 3′ end of the insert to have pSSstop. A XhoI–KpnI fragment of pSTNeoB (10) containing neor sequence was inserted in the XhoI–KpnI site of the pSSstop, to have pSSstopNEO. In parallel, the 5.4-kb SalI-ApaI genomic fragment, immediately 3′ of the Sau3AI–SalI fragment was once cloned into the pBlueScript II, and regenerated by digesting with Asp718. The resulting fragment was blunt-ended, digested with SalI and cloned into the SalI–EcoRV site of DT-A vector (11), generating pSADT-A plasmid. The pSSstopNEO was digested with the Asp718, blunt-ended and digested with NotI. The resulting Asp718 (blunt-ended by Klenow)-NotI fragment was cloned into the SalI (blunt-ended by Klenow)–NotI sites of the pSADT-A, generating a final targeting vector. The vector plasmid was linearized with NotI and used for electroporation. The expected targeted gene product lacks the COOH-terminal zinc finger clusters which have been shown to be essential for the DNA binding of δEF1 protein (12). The neor element has a promoter but lacks the termination and poly(A) addition signals, so that the neor is expressed only when poly(A) addition signal is supplied by recombination with a host gene. A DT-A cassette (11) was placed in the 3′ end of the linearized vector for the negative selection against integration into nonhomologous genes.
Figure 2.


ΔC-fin δEF1 mutant allele generated by homologous recombination. (A) The last three exons (6–8) of the mouse δEF1 gene encoding the homeodomain and the C-proximal zinc finger cluster are shown (top) together with the targeting vector (middle) and the resulting genomic structure of the homologous recombinant (bottom). Stop codons and the neor cassette are inserted in the middle of the 6th exon, downstream of the homeodomain in the targeting vector. A DT-A cassette (11) was added at the 3′ end of the vector for negative selection against random insertion of the vector. neor, neomycin resistance gene cassette; DT-A, the Diphtheria toxin A chain expression cassette. The diagnostic BglII fragments detected in Southern blots using the probe (indicated by the thick bar) are shown. Restriction sites of SalI, ApaI, and Sau3AI in the genomic DNA used for the targeting vector construction are also shown (see Materials and Methods). (B) Proteins coded by wild-type allele (wt) and the mutated (ΔC-fin) allele are schematically shown. (C) DNAs isolated from wild-type mice (+/+), a recombinant ES clone (A84), and mice heterozygous (+/−) or homozygous (−/−) for the mutant δEF1 gene were digested with BglII and subjected to Southern blot analysis using the indicated probe. (D) Total RNAs (5 μg each) from wild-type (+/+), heterozygous (+/−), and homozygous (−/−) embryos (12.5 d.p.c.) were analyzed by Northern blotting using a mouse δEF1 cDNA (clone M12) as probe. Only the larger size mRNA (δEF1+neor) resulting from the insertion of neor was detected in a homozygous embryo, while only the normal size of δEF1 mRNA was present in a wild type, and both were in a heterozygous embryo. (E) Nuclear extracts from wild-type (+/+), heterozygous (+/−) and homozygous (−/−) 12.5 d.p.c. embryos were immunoprecipitated and analyzed by Western blotting for δEF1 and \xc6 C-fin protein using anti-δEF1 antiserum which can react to N-proximal portion of δEF1 (see Materials and Methods). As size references, the nuclear extracts from the COS cells transfected with expression vectors of wild-type (wt/COS) and ΔC-fin δEF1 protein (ΔC-fin/COS) were also electrophoresed in parallel.
Gene Targeting.
E14 embryonic stem cells were electroporated and selected in the presence of G418 as described previously (13). Homologous recombinants were screened using Southern blot analysis, and obtained at a frequency of one in 107 electroporated cells. The ES cells carrying the mutated δEF1 allele were injected into blastocysts from (C57BL/6 × C3H) F1 female mated with C57BL/6 male, and transferred to ICR pseudopregnant recipient mice. Resulting male chimeras were bred to ICR female mice to have heterozygous mice. The heterozygous mice were crossed with ICR or separately with C57BL/6 to keep the heterozygous pedigrees and intercrossed to generate homozygous mutant mice. Back-crossing to C57BL/6 has been done for six generations to date to obtain the mutant animals in C57BL/6 genetic background. Genotypes were determined by PCR analysis of DNA from ear punching (14) or by Southern blot analysis of tail DNA.
Southern and Northern Blot Analysis.
Total DNA from the ES cells, the yolk sacs and the tails were isolated as described previously (15). The probe used in Southern blot analysis for identification of homologous recombination and genotyping was a 1.5kb EcoRI–XbaI genomic fragment at 0.5 kb upstream of exon 6 (shown in Fig. 2 A). Total RNA of 12.5 d.p.c. embryos were prepared by a single step isolation procedure (16). 5 μg of the total RNA was separated by electrophoresis in a 1% formaldehyde agarose gel and blotted to a Hybond N (Amersham, Buckinghamshire, England) nylon membrane. The filter was hybridized with the 32P-labeled 2.5-kb EcoRI fragment of mouse δEF1 cDNA containing the sequence from exon 3 to exon 8 (9).
Expression of the δEF1 cDNAs in Cultured Cells.
A cDNA coding for \xc6 C-fin δEF1 protein was constructed by inserting the XbaI linker with stop codons in the SalI site of exon 6 of fulllength cDNA in the same way as targeting vector construction. The full-length and \xc6 C-fin δEF1 cDNAs were inserted into the NotI site of pCDM8 (17) and transfected to COS-7 cells by lipofection as described (18).
An Antiserum against N-proximal Portion of δEF1.
An antiserum against human homologue of δEF1, AREB6, was used to detect the N-proximal region of mouse δEF1. HpaI–NheI (1041-2498) fragment of human AREB6 cDNA (6) was blunt-ended and subcloned into the SmaI site of pGEX-3X to produce a GST-AREB6 fusion protein. An antiserum against this fusion protein, which cross-reacts to mouse δEF1, was used for Western blot analysis.
Immunoprecipitation and Western Blot Analysis.
Nuclear extracts were prepared according to the previous report (19). From each 12.5 d.p.c. embryo, 650 μl (2 μg protein/μl) of the extract was obtained, and a 100-μl aliquot was reacted with the anti-AREB6 antiserum at room temperature for 2 h. The immunocomplexes were precipitated with protein A–Sepharose (Pharmacia) and dissolved in 40 μl of the SDS-PAGE buffer. Each 10-μl sample was separated by SDS-PAGE (7.5 % polyacrylamide) and blotted onto a nitrocellulose filter. The blot was treated with 5% skim-milk in TBST (20 mM Tris-HCl, 150 mM NaCl, 0.05% Tween 20, pH 8.0), incubated with the anti-AREB6 antiserum, washed by TBST, reacted with HRP-labeled goat anti–rabbit IgG and processed for ECL chemoluminescence reaction (Amersham).
FACS® Analysis.
Multicolor analysis of lymphocytes was performed by FACScan® cell sorter as described previously (20). The following mAb were purchased from PharMingen (San Diego, CA): fluorescein isothiocyanate (FITC)-conjugated antiCD45R, RA3-6B2; FITC-conjugated anti-CD8a, 53-6.7; FITC- conjugated anti-CD3ε,145-2C11; FITC-conjugated anti–Gr-1, RB6-8C5; FITC-conjugated anti-CD25, 7D4; PE-conjugated anti–Thy 1.2, 53-2.1; PE-conjugated anti-CD4, RM4-5; PEconjugated anti–α/βTCR, H57-597; PE-conjugated anti–Mac-1, M1/70; PE-conjugated anti-CD44, IM7; Biotin-conjugated antiIgM, R6-60.2, biotin-conjugated anti–c-kit receptor, 2B8. Biotin-conjugated anti-α4 integrin (CD49d), MFR4.B. FITC-conjugated anti-IgD was purchased from Nordic Immunological Laboratories (Capistrano Beach, CA). Three-color analysis for c-kit, α4 integrin, and CD44/CD25 expression was done using Cy-Chrome–labeled streptavidin (PharMingen) as the third fluorescence dye and analyzed by FACScan® cell sorter.
Histology and Immunohistology.
Tissues were fixed in Bouin's fixative and paraffin sections were stained with hematoxylin and eosin. For immunofluorescent staining of thymus, a thymus was excised from an 18.5 days post coitus (d.p.c.) embryo, and rinsed in Hepes-buffered saline (HBS), quickly frozen by dipping into liquid nitrogen, and then embedded in OCT compound (Miles Inc., Elkhart, IN). 6-μm-thick cryosections were fixed in 1% paraformaldehyde in HBS for 30 min. The sections were incubated with affinity-purified rabbit anti-δEF1 antibodies and biotinylated rat monoclonal anti-CD4 and anti-CD8 antibodies, then with FITC-labeled anti-rabbit Ig and Texas red-conjugated streptavidin anti–rat Ig in TBST containing 10% skim milk with washings by TBS between the steps. Finally, the specimens were mounted in Gelvatol (PBS containing 20% polyvinylalcohol, 20% glycerol, and 2.5% 1,4 diazabycyclo-[2,2,2]-octane) and examined under a microscope.
Results
Expression of δEF1 in Embryo and in Lymphoid Organs.
A cDNA coding for mouse δEF1 was isolated by crosshybridization with chicken δEF1 cDNA that was isolated and characterized in our laboratory (9). Comparison of the mouse δEF1 sequence with the chicken and other species revealed that the two zinc finger clusters and the homeodomain are highly conserved (9). Expression pattern of the mouse δEF1 in the embryos was almost identical to that of chicken (4): mesodermal tissues (e.g., notochord, somite, limb bud mesenchyme); neural crest derivatives (e.g., dorsal root ganglia, cephalic ganglia); a part of the central nervous system (hindbrain, motor neurons in the spinal cord). In Northern blot analysis of adult tissues, δEF1 mRNA was detected in all solid tissues examined (data not shown).
Among the lymphoid tissues, the δEF1 transcripts were detected in thymocytes, but not in splenocytes consisting of only mature T and B cells (Fig. 1 A, lanes 2 and 3). Bone marrow cells contained a low but detectable level of the transcripts (Fig. 1 A, lane 1). Immunohistological analysis showed that δEF1 protein was expressed in most of the thymocytes including cells stained with the mixtures of anti-CD4 and anti-CD8 antibodies (Fig. 1 B). Taken together with the results of Northern blot analysis, it was indicated that δEF1 is expressed in some of the bone marrow cells and in most of the thymocytes including CD4- and CD8-expressing cells, but once the cells migrate out δEF1 expression is lost.
Figure 1.


δEF1 expression in adult lymphoid tissues. (A) Total RNAs were prepared from splenocytes (lane 1), thymocytes (lane 2), and bone marrow cells (lane 3) of 8-wk-old wild-type C57BL/6 mice. Each 5-μg RNA sample was analyzed by Northern blotting using a mouse δEF1 cDNA as probe. The position of the origin of electrophoresis, δEF1 mRNA and ribosomal RNAs are indicated. The same filter was rehybridized for glyceraldehyde- 3-phosphate dehydrogenase (G3PDH) mRNA to control the amount of loaded mRNAs. (B) A section of thymus of 18.5 d.p.c. embryo was doubly stained with anti-δEF1 antibody (green) and a mixture of anti-CD4 and anti-CD8 antibodies (orange). Note that the majority of the thymocytes had δEF1 in the nuclei, together with CD4/CD8 on cell surface. Bar, 10 μm.
Generation of δEF1 Mutant Mice Which Lack the Zinc Finger Cluster Proximal to COOH Terminus of δEF1 Protein.
To generate the δEF1 \xc6 C-fin mutant allele, we constructed the targeting vector shown in Fig. 2 A. It was expected that the product of the recombinant gene lacks the C-proximal zinc finger cluster required for high affinity DNA binding (Fig. 2 B and see reference 12). Germ-line male chimeras were produced from homologous recombinant E14 ES cells (e.g., A84 in Fig. 2 C), and heterozygous mutant animals were generated by crossing these chimeras with C57BL/6 or ICR female mice. The heterozygous mice appeared normal in growth, fertility, behavior, and morphology of internal organs. Southern blot analysis of the yolk sac DNA from the 12.5 d.p.c. embryos generated by crossing the heterozygous mice showed the set of the hybridizing bands expected for the homozygous embryos (Fig. 2 C). Then we examined the δEF1 mRNA from the homozygous mutant embryos (12.5 d.p.c.) and compared them with the littermates of other genotypes. As shown in Fig. 2 D, transcripts from the mutated allele were longer than those from wild-type allele as expected from insertion of the neor sequence. The heterozygous embryos had both transcripts while the homozygous mutant embryos possessed only the longer transcript. To further confirm the mutation of δEF1 gene by homologous recombination, we examined the δEF1 protein in the mutant embryos by Western blot analysis (Fig. 2 E). The mutant protein is expected to be smaller by 40 kD than the wild-type δEF1 protein. It was demonstrated that wild-type and homozygous mutant embryos had only full-length and truncated forms of δEF1, respectively, while the heterozygous embryos had both. All these observations indicated that δEF1 gene was mutated as designed, and that the truncated form of the mutant protein was synthesized no less efficiently than the wild-type form.
Severe Hypocellularity in the Thymus of δEF1 Mutant Mice.
In embryonic stages the homozygous mutant embryos developed up to 18.5 d.p.c. with the expected Mendelian frequency. In histological analysis of the embryos from 10.5 to 18.5 d.p.c., we noted that the thymi of the homozygous mutant embryos were smaller than normal embryos. Other tissues and organs were normal in morphological and histological inspections. The number of thymocytes of 18.5 d.p.c. homozygous mutant embryos was reduced 10-fold (∼5 × 10⁵ cells per thymus) compared to the heterozygous and wild-type embryos (∼5 × 10⁶ cells per thymus). FACS® analysis of the thymocytes using CD4 and CD8 markers indicated that the development from the DN to DP cells appeared to be partially inhibited (data not shown). We observed no difference between wildtype and heterozygous mutant embryos.
In the postnatal period ∼80% of the homozygous mutant pups died within 2 d after birth, but the remaining 20% survived and some of them had offspring. After backcrossing to C57BL/6 mice for 6 generations, 11 of the homozygous mutant mice which survived and aged from 3 to 11 wk were analyzed for lymphoid tissue development. As observed in the fetuses, thymi of all the homozygous mutant mice inspected were greatly reduced in size. In histological sections of the mutant thymi, medulla and cortex were hardly distinguishable (Fig. 3, A and B); especially, the cortex which usually consists of the densely packed and actively proliferating small thymocytes seemed to be missing in the mutant thymi (Fig. 3, C and D). Accordingly, the total cell number of thymus was greatly reduced from 1/100 to 1/500 of the heterozygous littermate (Fig. 4 A). The spleens of homozygous mutant mice were not significantly different in size from those of heterozygous littermates, although the number of splenocytes was slightly lower in homozygous mutant mice (Fig. 4 C). As will be shown below, the extent of reduction of the cell number seems to be accounted for by the reduction of peripheral T cells in the spleen. Histological inspection of the spleens of the homozygous mutant mice showed the basic architecture to be normal (data not shown). The lymph node of the homozygous mutant mice was characteristic in the reduced cellularity of the deep cortex where the T cells reside (data not shown). The number of lymphocytes recovered from a pair of inguinal lymph nodes of those mice was reduced to ∼1/10 of that from the heterozygous littermates (Fig. 4 B).
Figure 3.
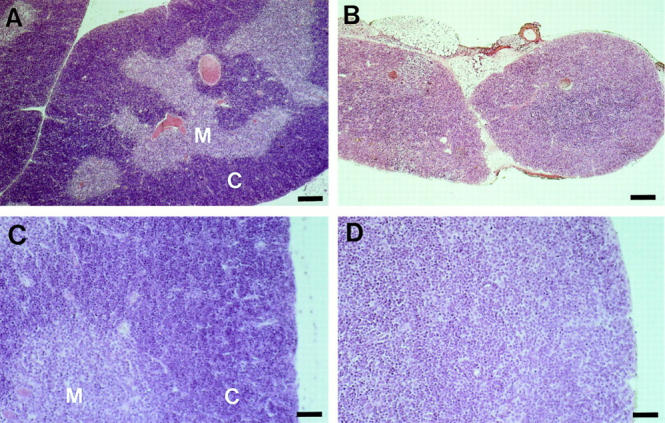
Histology of thymus of δEF1 mutant mouse. Thymi of 6-wk-old heterozygous control (A, C) and homozygous mutant (B, D) mice were fixed in Bouin's fixative and stained with hematoxylin and eosin. The control thymus had developed distinct medulla and cortex (A), while mutant thymi had uniform parenchyma with light staining as seen in medulla of the control thymus (B). Note also the differences of size and cellularity between them. The control thymus had a typical cortex which consists of the densely packed and actively proliferating small thymocytes as shown in higher magnification (C), while the mutant thymus seemed to lack its architecture (D). Bars: (A and B) 200 μm; (C and D) 40 μm.
Figure 4.

Total cell count of lymphocytes in lymphoid organs of δEF1 mutant mice in comparison with control heterozygous littermates. Total lymphocyte numbers in thymi (A), spleens (B), and lymph nodes (C) of 6–11 wk were plotted. Note severe reduction of the total lymphocyte numbers in the mutant thymi (∼100-fold) and lymph nodes (∼10-fold) while the difference in cell number was less pronounced in the spleen.
The heterozygous and wild-type animals were indistinguishable in their histology and cell content of all the lymphoid organs described above. In addition, δEF1 mutant of another allele, Null-LacZ, which lacked almost all of the coding sequence, also exhibited the reduced size of the thymi and impaired T cell development at fetal stages as observed in the \xc6 C-fin mutant mice (Takagi T., H. Kondoh, and Y. Higashi, unpublished results). These observations exclude the possibility that the T cell defect in the homozygous \xc6 C-fin mutant mice is due to the specific effect of the truncated protein.
Aberrant T Cell Development in the Thymus and Reduced T Cell Population in the Peripheral Lymphoid Organs in δEF1 Mutant Mice.
Using FACS® with various cell surface markers, we first investigated the cell populations in thymi from the homozygous mutant and heterozygous control mice. In the homozygous mutant mice, the total thymocyte number was so small (see Fig. 4 A) that whole thymocytes of a mutant mouse was subjected to the FACS® analysis. A representative set of the results is shown in Fig. 5 A. The proportion of the CD4/CD8 SP or DP cell populations present was different from that found in a control heterozygous littermate: the relative proportion of cells in CD4+CD8+ quadrant was reduced from 88% in normal to 57% in the mutant thymocytes while that of the SP cells was increased from 11 to 38% (Fig. 5 A). The relative frequency of α/βTCR+CD3+ cells in the mutant was higher than in the control heterozygous littermate (Fig. 5 B), which was consistent with the fact that the proportion of SP cells was higher in the mutant mice compared with the control heterozygous littermate as described above.
Figure 5.


FACS® analysis of thymocytes from a δEF1 mutant and a control heterozygous littermate. Thymocytes from 6-wk-old homozygous mutant (left) and heterozygous littermate (right) were analyzed by staining with the combination of mAbs: (A) PE–anti-CD4 vs. FITC–anti-CD8; (B) PE–anti-α/βTCR vs. FITC–anti-CD3 to assess developmental stages of thymocytes. Numbers in parentheses indicate the percentage of cells within the quadrant defined by fluorescence of cell surface markers. The thymocytes were also analyzed by the forward light scattering for the estimation of cell size (C). The histograms for whole or a portion of the thymocytes that were logically gated for the DN, DP, and SP cells in A are shown with combination of heterozygous (+/−) and mutant (−/−) thymocyte data: abscissa, forward light scattering and ordinate, relative cell number.
From forward light scattering data of the FACS® analysis, which indicated the distribution pattern of cell size of a cell population examined, we found that the cell population of larger size predominantly existed in the homozygous mutant mice whereas most of the thymocytes in control mice consisted of the small cell population typical for normal mice (Fig. 5 C). The bias toward the larger size of the cell population in the mutant thymocytes seemed to be due simply to the reduced cell number of the DP thymocytes relative to that of SP cells in the mutant mice since we noticed that the most abundant cell size of the DP and SP cells in the control and mutant mice were not quite different (Fig. 5 C). However, cell size distribution pattern of DN cell population was significantly different between the control and mutant thymocytes: mutant thymocytes were not abundant in the cell population of larger size, but instead had much smaller cells compared to the control mice (Fig. 5 C).
T cells in the spleen and the lymph node were also examined by FACS®. In the mutant spleen, although decrease of total cell number in the mutant was less conspicuous than in the thymus (Fig. 4 B), the fraction of the T cells in the total splenocytes was significantly reduced from ∼40% (heterozygous) to 10% (mutant) as judged by Thy1 (T cell marker) and B220 (B cell marker) expression (Fig. 6 A).
Figure 6.
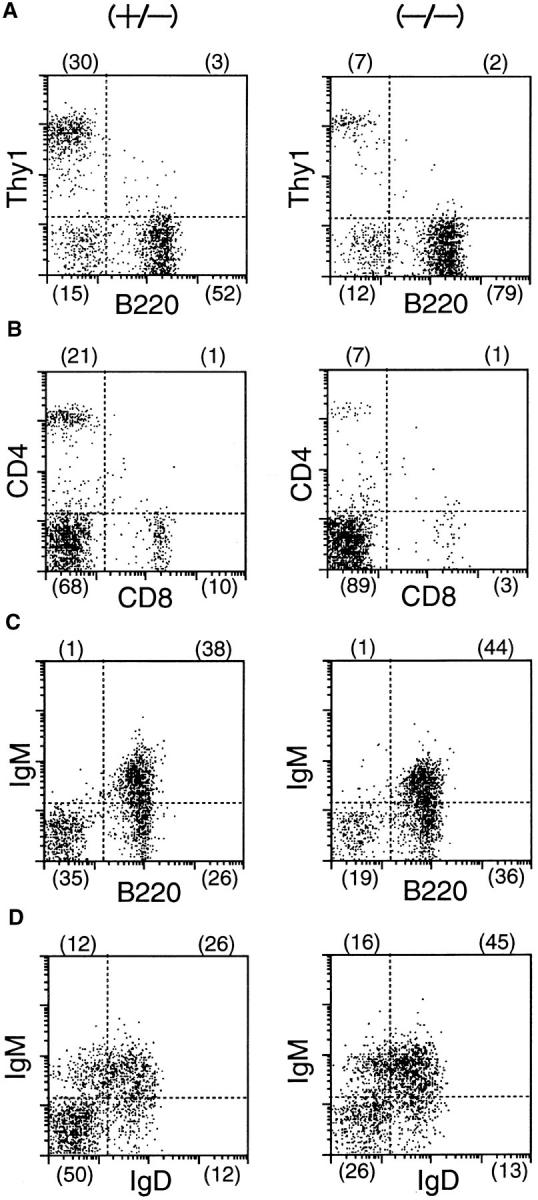
FACS® analysis of splenocytes from a δEF1 mutant and a control heterozygous littermate. Splenocytes from 6-wk-old homozygous mutant (left) and heterozygous littermate (right) were doubly stained with the following combinations of mAbs; (A) PE–anti-Thy1 vs. FITC–anti-B220 to assess fractions of T and B cells; (B) PE–anti-CD4 vs. FITC–anti-CD8 to assess CD4, CD8 expression in T cell population; (C) biotinylated antiIgM plus streptoavidin-PE vs. FITC–anti-B220 and; (D) biotinylated anti-IgM plus streptoavidin-PE vs FITC–anti-IgD to assess development of B cells. Numbers in parentheses have the same indication as in Fig. 5.
In the lymph node also, T cells were reduced in number (Fig. 7 A) and were α/βTCR+CD3+ (Fig. 7 C), indicating full maturity, but the ratio of CD4+CD8− SP to CD4−CD8+ SP cells at the age of 3–8 wk was 5 in the mutant as compared to the ratio of 2 in normal (Fig. 7 B). This bias toward CD4+CD8− cell population tended to be greater in older mice (e.g., 20 wk, data not shown). In such old mice, the bias also became evident in the spleen though there seemed to be no such bias in the spleen of young adult mice at the age of 3–8 wk (Fig. 6 B). The decrease of the T cells commonly observed in the peripheral lymphoid organs may be ascribed to the limited supply of T cells from the thymus.
Figure 7.
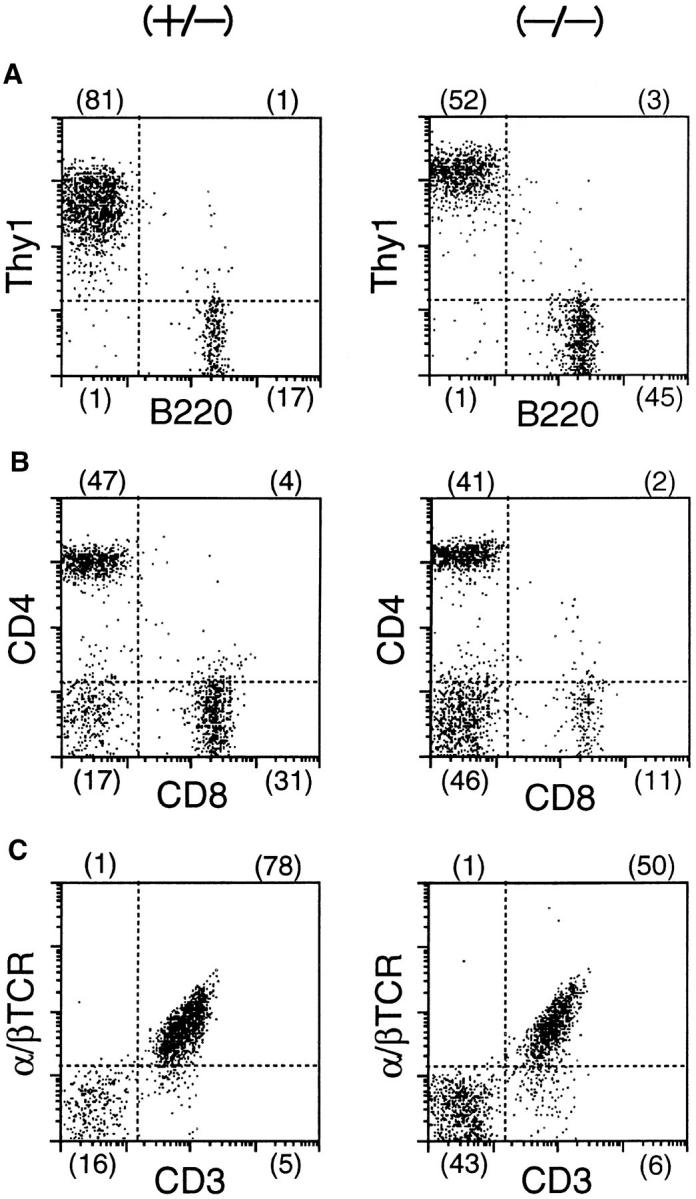
FACS® analysis of lymph node lymphocytes from a δEF1 mutant and a control heterozygous littermate. Inguinal lymph node cells from 6-wk-old homozygous mutant (left) and heterozygous littermate (right) were doubly stained with the following combinations of mAbs; (A) PE– anti-Thy1 vs. FITC–anti-B220; (B) PE–anti-CD4 vs. FITC–anti-CD8; (C) PE–anti-α/βTCR vs. FITC–anti-CD3. Numbers in parentheses have the same indication as Fig. 5.
Since MHC class I and II antigens on the thymic stromal cells are essential for the generation of the CD4 and CD8 SP T cells, we examined the expression of the class I (H-2K) and class II (I-A) antigens on the thymic epithelial cells by immunohistochemistry using anti H-2K and I-A antibodies. The levels of expression of these antigens were not different between δEF1 \xc6 C-fin mutant and control mice, although the expressions of both MHC antigens were detected in medullary region in the control mice while in the whole region in the mutant mice (data not shown). This difference may suggest and is consistent with the histological observation (Fig. 3) that the small thymi in the mutant mice lacked the typical cortex comprising the densely packed small thymocytes, most of which are DP and do not express the MHC antigens highly.
Next we examined the functional maturity of the peripheral T lymphocytes by the proliferative response to the Con A stimulation using the spleen cells as shown in Table 1. Although the degree of Δcpm of the mutant mice was about one-third of that of the control mice, it seemed that the decrease in Δcpm in the mutant mice was simply due to reduction of the number of T cells in the spleen cells of homozygous mutant mice (Fig. 6). The sensitivity to Con A stimulation and the size of colonies of the proliferating T cells were not different between the control and mutant mice (data not shown). Thus, functional maturity of the peripheral T lymphocytes accumulated in the δEF1 homozygous mutant mice did not seem to be affected at least in the responsiveness to the Con A stimulation.
Table 1.
Con A–induced Proliferation of T Cells in Spleen Cells from a δEF1 ΔC-fin Mutant and a Control Heterozygous Littermate
| Genotype | Animal* | Con A (−) | Con A (+)‡ | Δ cpm | ||||
|---|---|---|---|---|---|---|---|---|
| (+/−) | 1 | 1,280 | 30,600 | 29,350 | ||||
| 2 | 900 | 31,120 | 30,220 | |||||
| (−/−) | 1 | 560 | 11,140 | 10,580 | ||||
| 2 | 200 | 9,110 | 8,910 |
Numbers 1 and 2 represent different animals from different litter of 1 and 2, respectively. Animals of the same number belong to the same littermate.
Con A (5 μg/ml) was added to the spleen cell culture in a 96-well microtiter plate (1 × 10⁵ cells/well), and incubated for 24 h. Pulse labeling with [3H]thymidine (0.5 μCi/ml) was carried out for 12 h. Incorporation of [3H] thymidine in each well was measured using Top-Counter (Packard). Values represented were average cm of the triplicate samples.
In contrast to T cells, the development of B cells and myeloid cells was not significantly affected by the δEF1 mutation. B cells were comparable in number among the spleens of homozygous, heterozygous and wild-type littermates. The level of IgM and IgD expression in splenocytes was normal in the homozygous mutant mice (Fig. 6, C and D). The population of the B cells and myeloid cells in the bone marrow was normal as analyzed using B220 (low expression), Mac1 and Gr-1 markers (data not shown). Hematocrit value of the homozygous mutant mice was also similar to the wild-type animals (data not shown). Thus, the defects in the δEF1 mutant mice appeared specific to T lymphocytes.
Depletion of CD4−CD8−c-kit+ Thymocytes in δEF1 Mutant Mice.
The FACS® analysis of the mutant thymocytes using CD4 and CD8 markers indicated that, despite the severe decrease of the total cell number, intrathymic development of the T lymphocytes was not arrested at a specific stage. This is in contrast to the cases of knockout mice lacking molecules that are essential for the development and function of T lymphocytes (e.g., TCR-β [21], CD3 [22]). We suspected that the T precursor cells at a very early stage, for instance, before the rearrangement of the TCR genes, might be affected and decreased in the δEF1 mutant mice, and that a small fraction of the T precursor cells which escaped from the block by the δEF1 mutation proceeded to subsequent development.
To address this point, we analyzed the c-kit expression in the CD4−CD8− DN cell population by three-color FACS® analysis. The early intrathymic T precursor cells which migrate from the bone marrow express c-kit receptor as other hematopoietic progenitors (23, 24). As shown in Fig. 8, A and B, only 15% of the CD4−CD8− cell population in the mutant thymus was assigned as c-kit+, while >50% of CD4−CD8− cells were c-kit+ in the control heterozygous littermate. Taking into account the difference in the total thymocyte number (Fig. 4) and in the proportion of DN cells (Fig. 5 A), it was concluded that early T cell precursor was depleted in the thymus of δEF1 mutant mice.
Figure 8.

FACS® analysis of c-kit, CD25 and CD44 expression in CD4−CD8− cell population in thymocytes of a δEF1 mutant and a control heterozygous littermate. For analysis of the c-kit expression, thymocytes from a δEF1 mutant and heterozygous littermate of 6-wk-old were subjected to the three-color analysis by staining with FITC–anti-CD8 and PE–anti-CD4 mAbs, and with biotin conjugated anti–c-kit receptor mAb plus Cy-chrome streptoavidin. CD4 and CD8 expression were analyzed in whole thymocytes (–). Histograms of c-kit receptor expression in DN fraction (boxed in A) are shown below (B). CD44 and CD25 expression were also analyzed in CD4−CD8− cell populations (C). Each histogram in B was drawn so that the total number of cells sampled was equal between the mutant and heterozygous littermate. Abscissa indicates intensity of Cy-chrome fluorescence, and ordinate represents relative cell number. For analysis of the CD44 and CD25 expression, thymocytes were stained with FITC–anti-CD25 and PE–anti-CD44 mAb, and with a mixture of biotin conjugated anti-CD4 and CD8 mAbs plus Cy-chrome streptoavidin. Numbers in parentheses have the same indication as Fig. 5.
We analyzed further the DN cell population by staining CD44 and CD25 antigens. It is known that a combination of expression states of these markers defines a stage of thymocyte development within the DN cell population which proceeds in the following order: CD44+CD25−→ CD44+ CD25+→ CD44−CD25+→ CD44−CD25− (25, 26). The CD44+CD25− population contains the earliest intrathymic T precursor cells, but also include the cells of non–T cell lineages. It is also known that the CD44+ CD25+ cells are largest in size and express c-kit most highly, while advancement of the cells to CD44−CD25+ and CD44−CD25− stages results in smaller cell size and in lower c-kit expression (26, 27). As shown in Fig. 8 C, CD44+CD25+ cells, which correspond to the high c-kit+ population was greatly reduced from 12 to 3% in the mutant thymocytes as expected. We also noticed that the relative proportion of CD25+ cells in DN cell population was reduced at least to 50% of that of control mice.
Augmentation of α4 Integrin Expression in δEF1 Mutant Mice.
Then, what gene might be affected in δEF1 mutant mice to cause this severe reduction of early T cell precursors? Given that δEF1 can be a repressor of E2-box sequence (7, 12), genes known to have E2-box sequences in their promoter region are good candidates as a regulatory target of δEF1. Among them, α4 integrin gene is especially interesting since its promoter contains multiple E2-box sequences (28), and it is known to have an essential role in lymphocyte migration which may include a pathway from bone marrow to thymus (29–31). Furthermore, α4 integrins have recently been suggested to have some functions in intrathymic development of T lymphocytes (32, 33).
We thus examined the expression of several cell surface markers including integrins in the mutant thymocytes to look for the expression of those proteins affected by δEF1 mutation. We found that the expression of α4 integrin (CD49d) was significantly increased (Fig. 9): two- to threefold increase in α/βTCR−/low/CD3− /low immature cells of the mutant, and to a lesser extent in α/βTCRhigh/CD3high more mature cells (Fig. 9).
Figure 9.

FACS® analysis of α4 integrin expression in thymocytes of a δEF1 mutant and a control heterozygous littermate. Thymocytes from a δEF1 mutant (B) and a heterozygous littermate (A) were stained with FITC–anti-CD3 mAb, PE–anti-α/βTCR mAb and biotin-conjugated anti-α4 integrin mAb plus Cy-chrome streptoavidin, and analyzed for α4 integrin expression in α/βTCR2/lowCD32/low and α/βTCRhigh CD3 high populations marked by 1 and 2, respectively. Histograms of the α4 integrin expression of mutant (−/−) and heterozygous littermate (+/−) thymocytes were compared in C and D for populations 1 and 2, respectively. Each histogram was drawn so that the total number of cells sampled in each cell population was equal between the mutant and heterozygous littermate. Abscissa indicates intensity of Cy-chrome fluorescence, and ordinate represents relative cell number.
Discussion
The data presented in this report demonstrates that δEF1 is essential for normal T cell development. In δEF1 mutant mice, total lymphocyte number in thymus was reduced to ∼1% of that of normal mice. The cell populations found in the thymus of the mutant mice, though reduced in number, represented those of T cells with advanced development, such as CD4+CD8+ DP and CD4+/CD8+ SP cells. This phenotype is in contrast to the previously reported mutant mice of T cell development, e.g., RAG (34, 35), TCR-α/β (21, 36), CD3 (22, 37). In these previous cases where the mutated genes were essential for critical steps of T cell development, advancement of thymocytes to subsequent stages was blocked resulting in accumulation of the cells arrested at the critical stages. The total thymocyte number tended to be smaller as the blocked stage became earlier. In the RAG-2–deficient mice, for instance, thymocytes were decreased 100-fold as was observed in δEF1 mutant mice, and the existing thymocytes were mostly DN cells (34). The fact that the majority of thymocytes in δEF1 mutant mice expressed CD4, CD8 markers despite the severe reduction in total thymocyte number led us to postulate that the major defect of this mutant lay at a very early stage, much earlier than that at which the TCRs were required, and a small fraction of the cells that somehow escaped from the δEF1 mutation could go through the maturation stages.
The idea that the δEF1 mutation impairs early T cell development was supported by the observation on c-kit+ cells in the DN cell population that are considered to be the earliest intrathymic T precursor cells migrating from bone marrow (24). This particular cell population was largely depleted from the mutant thymocytes (Fig. 8 B). Consistent with this observation, the CD44+CD25+ cells, a subset of cells in the early stage of the DN cell population expressing c-kit strongly (26), were also significantly reduced (Fig. 8 C). The cell size distribution of the mutant DN thymocytes measured by the forward light scattering was shifted to smaller than control (Fig. 5 C), which is again in agreement with the observation mentioned above because the c-kit+ DN thymocytes have been shown to have the largest cell size in the DN cell population (26). Furthermore, δEF1 was expressed in the thymocytes (Fig. 1 A, lane 2) and in the bone marrow cells (Fig. 1 A, lane 1), though at a low level in the latter. All these observations support the idea that δEF1 plays an essential role in the very early stages of T cell development so that abrogation of δEF1 results in the severe decrease of T cell populations, accompanied by the significant loss of immature (CD4−CD8−c-kit+) intrathymic T precursor cells.
It is interesting to note that the recently reported mutant mice of IL-7 receptor (IL-7R) (38), IL-2 receptor γ-chain (IL-2Rγ) (39), and Jak3 (40–42), all showed severe reduction in the thymocyte number, and yet produced all DN, DP, and SP cells, similar to δEF1 mutant mice. Since IL-7R, IL-2Rγ, and Jak3 molecules are thought to be essential signaling molecules in expansion of the thymocytes at a very early stage before rearrangement of the TCR genes, it would be interesting to see if δEF1 is involved in such an signaling pathway.
Besides the early stage of T cell development, δEF1 may have additional regulatory roles in the later stage of intrathymic T cell development. The proportion of DN cells in total thymocytes was higher, and the ratio of DP to SP cells was lower in the δEF1 mutant mice. It was also noted that the mutant thymus did not develop medullo-cortical distinction, probably, due to lack of the typical cortex which usually consists of the densely packed and actively proliferating small thymocytes. The defects of δEF1 mutants are different in these two points from those of IL-7, IL-2Rγ, and Jak3 mutant mice: the proportion of the four cell populations marked by CD4, CD8 expression are identical to the normal mice and the thymi of those mice develop distinct structures of cortex and medulla, though the thymi themselves were very small and the thymocyte numbers are ∼1% of the normal mice as the δEF1 mutant mice (38, 39). These differences support the involvement of δEF1 in not only early but also late stages of thymocyte development. Reconstitution of the hematopoietic system in wild-type host using mutant hemopoietic tissues will clarify if the defects in early and late T cell development can be ascribed to lymphocytes or stroma.
In peripheral lymphoid tissues the proportion of CD4− CD8+ T lymphocytes relative to CD4+CD8− cells was significantly reduced from ∼0.5 (wild type) to 0.2–0.1 (mutant). In older mice, the majority of the peripheral T cell population was occupied by CD4+CD8− cells (data not shown). Since the MHC class I and II antigens, which are required for generation of the functional CD4−CD8+ and CD4+CD8− SP T cells, were expressed at the normal level on thymic epithelial cells of the mutant mice (data not shown), and actually the CD4/CD8 SP T cells were produced in the mutant thymus (Fig. 5 A), survival of mature CD4−CD8+ cells may be affected in peripheral tissues of δEF1 mutant mice.
An interesting observation was the increase of α4 integrin (CD49d) expression in the mutant thymocyte (Fig. 9). α4β1 integrins are expressed in CD34+ hematopoietic progenitors (43) and regulate lymphocyte attachment and the homing process in the endothelial microenvironment (30, 31). Thymocytes also express α4β1 integrins (44) and stagedependent regulation of α4 integrin expression in developing thymocytes has been demonstrated (32, 33), suggesting its possible roles in T cell development. The regulatory region of the α4 integrin promoter has been analyzed and a negative element effective in lymphocytes has been identified between positions −400 and −300 in the 5′-flanking sequence (28, 45). The δEF1 binding sequence, CACCT, is present at −357 in a region conserved between human and mouse (45), which may be the target site of δEF1. It is possible, therefore, that derepression of α4 integrin expression caused by δEF1 mutation may affect homing of T precursor cells or intrathymic development of T cells as reported here.
nil-2-a, which seems to be a truncated form of δEF1, was reported to function as a repressor of the IL-2 gene transcriptional regulation in human T cell jarkat cell line (46). The impairment of T cell development observed in the δEF1deficient mice could result from the incomplete regulation of the IL-2 gene expression. Deregulated expression of the IL-2 gene in transgenic mouse system, however, did not show any T cell deficiency (47, 48). Moreover, the IL-2 gene knockout mice showed no effects on thymocyte and peripheral T cell subsets (49). Thus, δEF1 mutant phenotype is not explained by altered regulation of the IL-2 gene.
It has been reported that δEF1 (and its human homologue, ZEB) is expressed in myeloma and B-lymphoma cell line (7). This is not totally consistent with our observation that δEF1 mRNA were not detected in the Northern blot analysis of the splenocytes. It is possible that expression of δEF1 might be correlated to neoplastic transformation of B cells, or, alternatively, that δEF1 mRNA in matured B or T cells are too little to be detected by our Northern blot analysis using total RNA.
Although we still do not know the reason for neonatal death observed in part of the \xc6 C-fin mutant mice, it was rather unexpected that homozygous mutant embryos carrying the \xc6 C-fin allele developed normally except for the T cell defect, given the fact that δEF1 acts as a competitive repressor against bHLH activator proteins, which are widely involved in embryogenesis (12). It should be mentioned that Sna, a mouse homologue of the Drosophila snail and escargot, is expressed at high levels in cephalic neural crest, limb bud mesenchyme, and somites of 9.5 d.p.c. embryo and later in a variety of mesenchymal tissues (50), showing close resemblance to the expression pattern of δEF1. Moreover, consensus binding sequence of Drosophila snail and escargot proteins contain CACCTG E2 box sequence and actually these proteins counteracts E2-box–mediated activation by heterodimer of Scute and Daughterless bHLH proteins (51, 52). It is possible that loss of normal δEF1 protein was compromised by the mouse Sna protein.
In conclusion, T cells, but not other hematopoietic lineage cells, are depleted in δEF1 mutant mice although they are thought to be derived from common stem cells. Possibly, δEF1 has an important role in growth and differentiation of early T cells in the bone marrow, in the homing process and/or in development in the thymus. To date, the early T precursor cells have been understood only poorly. δEF1 mutant mice should thus provide a unique tool to study early T cell development from the aspect of transcriptional regulation.
Acknowledgments
We thank Dr. A. Shimono for his help in the targeting experiments. We also thank Dr. T. Yasui and Mr. K. Yoshida for useful advises on FACS® analysis, and Drs. A. A. Postigo and D. C. Dean for drawing our attention to the α4 integrin promoter.
This work was supported by grants from the Ministry of Education, Science and Culture of Japan to Y. Higashi, T. Takagi, R. Sekido, and H. Kondoh, and from the Science and Technology Agency of Japan to Y. Higashi. T. Takagi and R. Sekido are recipients of a fellowship from the Japan Society for the Promotion of Science for Japanese Junior Scientists.
Footnotes
1 Abbreviations used in this paper: DN, double negative; DP, double positive; d.p.c., days post coitum; FITC, fluorescein isothiocyanate; HBS, Hepes-buffered saline; SP, single positive.
References
- 1.Robey E, Fowlkes BJ. Selective events in T cell development. Ann Rev Immunol. 1994;12:675–705. doi: 10.1146/annurev.iy.12.040194.003331. [DOI] [PubMed] [Google Scholar]
- 2.Pfeffer K, Mak TW. Lymphocyte ontogeny and activation in gene targeted mutant mice. Ann Rev Immunol. 1994;12:367–411. doi: 10.1146/annurev.iy.12.040194.002055. [DOI] [PubMed] [Google Scholar]
- 3.Funahashi J-I, Kamachi Y, Goto K, Kondoh H. Identification of nuclear factor δEF1 and its binding site essential for lens-specific activity of the δ1-crystallin enhancer. Nucleic Acids Res. 1991;19:3543–3547. doi: 10.1093/nar/19.13.3543. [DOI] [PMC free article] [PubMed] [Google Scholar]
- 4.Funahashi J-I, Sekido R, Murai K, Kamachi Y, Kondoh H. δ-crystallin enhancer binding protein δEF1 is a zinc finger homeodomain protein implicated in postgastrulation embryogenesis. Development. 1993;119:433–446. doi: 10.1242/dev.119.2.433. [DOI] [PubMed] [Google Scholar]
- 5.Kamachi Y, Kondoh H. Overlapping positive and negative regulatory elements determine lens-specific activity of the δ1-crystallin enhancer. Mol Cell Biol. 1993;13:5206–5215. doi: 10.1128/mcb.13.9.5206. [DOI] [PMC free article] [PubMed] [Google Scholar]
- 6.Watanabe Y, Kawakami K, Hirayama Y, Nagano K. Transcription factors positively and negatively regulating the Na, K-ATPase α1 subunit gene. J Biochem. 1993;114:849–855. doi: 10.1093/oxfordjournals.jbchem.a124267. [DOI] [PubMed] [Google Scholar]
- 7.Genetta T, Ruezinsky D, Kadesch T. Displacement of an E-box-binding repressor by basic Helix-LoopHelix proteins: implications for B-cell specificity of the immunoglobulin heavy-chain enhancer. Mol Cell Biol. 1994;14:6153–6163. doi: 10.1128/mcb.14.9.6153. [DOI] [PMC free article] [PubMed] [Google Scholar]
- 8.Franklin AJ, Jelton TL, Shelton KD, Magnuson MA. BZP, a novel serum-responsive zinc finger protein that inhibits gene transcription. Mol Cell Biol. 1994;14:6773–6788. doi: 10.1128/mcb.14.10.6773. [DOI] [PMC free article] [PubMed] [Google Scholar]
- 9.Sekido R, Takagi T, Okanami M, Moribe H, Yamamura M, Higashi Y, Kondoh H. Organization of the gene encoding transcriptional repressor δEF1 and cross-species conservation of its domains. Gene (Amst) 1996;173:227–232. doi: 10.1016/0378-1119(96)00185-0. [DOI] [PubMed] [Google Scholar]
- 10.Kato K, Takahashi Y, Hayashi S, Kondoh H. Improved mammalian vectors for high expression of G418 resistance. Cell Struct Funct. 1987;12:575–580. doi: 10.1247/csf.12.575. [DOI] [PubMed] [Google Scholar]
- 11.Yagi T, Nada S, Watanabe N, Tamemoto H, Kohmura N, Ikawa Y, Aizawa S. A novel negative selection for homologous recombination using diphtheria toxin A fragment gene. Anal Biochem. 1993;214:77–86. doi: 10.1006/abio.1993.1459. [DOI] [PubMed] [Google Scholar]
- 12.Sekido R, Murai K, Funahashi J-I, Kamachi Y, Fujisawa-Sehara A, Nabeshima Y, Kondoh H. The δ-crystallin enhancer-binding protein δEF1 is a repressor of E2-box-mediated gene activation. Mol Cell Biol. 1994;14:56925700. doi: 10.1128/mcb.14.9.5692. [DOI] [PMC free article] [PubMed] [Google Scholar]
- 13.Sawai S, Shimono A, Hanaoka K, Kondoh H. Embryonic lethality resulting from disruption of both N-myc alleles in mouse zygotes. New Biologist. 1991;3:861–869. [PubMed] [Google Scholar]
- 14.Qi S-L, Akagi K, Araki K, Miyazaki J-i, Yamamura K-i. Rapid identification of transgenic mice with PCR amplification of DNA from ear punching. Methods Mol Cell Biol. 1990;2:119–122. [Google Scholar]
- 15.Higashi Y. Changes of chromatin conformation around mouse interferon-β gene associated with induction of interferon synthesis. Nucleic Acids Res. 1985;13:5157–5172. doi: 10.1093/nar/13.14.5157. [DOI] [PMC free article] [PubMed] [Google Scholar]
- 16.Chomczynski P, Sacchi N. Single-step method of RNA isolation by acid guanidinium thiocyanate-phenolchloroform extraction. Anal Biochem. 1987;162:156–159. doi: 10.1006/abio.1987.9999. [DOI] [PubMed] [Google Scholar]
- 17.Seed B. An LFA-3 cDNA encodes a phospholipidlinked membrane protein homologous to its receptor CD2. Nature (Lond) 1987;329:840–842. doi: 10.1038/329840a0. [DOI] [PubMed] [Google Scholar]
- 18.Kamachi Y, Sockanathan S, Liu Q, Breitman M, Lovell-Badge R, Kondoh H. Involvement of SOX proteins in lens-specific activation of crystallin genes. EMBO (Eur Mol Biol Organ) J. 1995;14:3510–3519. doi: 10.1002/j.1460-2075.1995.tb07357.x. [DOI] [PMC free article] [PubMed] [Google Scholar]
- 19.Schreiber E, Matthias P, Muller MM, Schaffner W. Rapid detection of octamer binding protein with “miniextracts”, prepared from a small number of cells. Nucleic Acids Res. 1989;17:6419. doi: 10.1093/nar/17.15.6419. [DOI] [PMC free article] [PubMed] [Google Scholar]
- 20.Kawabe T, Naka T, Yoshida K, Tanaka T, Fujiwara H, Suematsu S, Yoshida N, Kishimoto T, Kikutani H. The immune responses in CD40-deficient mice: impaired immunoglobulin class switching and germinal center formation. Immunity. 1994;1:167–178. doi: 10.1016/1074-7613(94)90095-7. [DOI] [PubMed] [Google Scholar]
- 21.Mombaerts P, Clarke AR, Rudnicki MA, Iacomini J, Itohara S, Lafaille JJ, Wang L, Ichikawa Y, Jaenisch R, Hooper ML, Tonegawa S. Mutations in T-cell antigen receptor genes α and β block thymocyte development at different stages. Nature (Lond) 1992;360:225–231. doi: 10.1038/360225a0. [DOI] [PubMed] [Google Scholar]
- 22.Malissen M, Gillet A, Trucy J, Viver E, Boyer C, Kontgen F, Brun N, Maza G, Spanopoulou E, GuyGrand D, Malissen B. T cell development in mice lacking the CD3-ζ/η gene. EMBO (Eur Mol Biol Organ) J. 1993;12:4347–4355. doi: 10.1002/j.1460-2075.1993.tb06119.x. [DOI] [PMC free article] [PubMed] [Google Scholar]
- 23.Ogawa M, Matsuzaki Y, Nishikawa S, Hayashi SI, Kunisada T, Sudo T, Kina T, Nakauchi H, Nishikawa SI. Expression and function of c-kit in hemopoietic progenitor cells. J Exp Med. 1991;174:63–71. doi: 10.1084/jem.174.1.63. [DOI] [PMC free article] [PubMed] [Google Scholar]
- 24.Matsuzaki Y, Gyotoku J-I, Ogawa M, Nishikawa S-I, Katsura Y, Gachelin G, Nakauchi H. Characterization of c-kitpositive intrathymic stem cells that are restricted to lymphoid differentiation. J Exp Med. 1993;178:1283–1292. doi: 10.1084/jem.178.4.1283. [DOI] [PMC free article] [PubMed] [Google Scholar]
- 25.Pearse M, Wu L, Egerton M, Wilson A, Shortman K, Scollay R. A murine early thymocyte developmental sequence is marked by transient expression of the interleukin 2 receptor. Proc Natl Acad Sci USA. 1989;86:1614–1618. doi: 10.1073/pnas.86.5.1614. [DOI] [PMC free article] [PubMed] [Google Scholar]
- 26.Godfrey DI, Kenedy J, Suda T, Zlotnik A. A developmental pathway involving four phenotypically and functionally distinct subsets of CD3−CD4−CD8−triple-negative adult mouse thymocytes defined by CD44 and CD25 expression. J Immunol. 1993;150:4244–4252. [PubMed] [Google Scholar]
- 27.Godfrey DI, Zlotnik A, Suda T. Phenotypic and functional characterization of c-kit expression during intrathymic T cell development. J Immunol. 1992;149:2281–2285. [PubMed] [Google Scholar]
- 28.Rosen GD, Barks JL, Iademarco MF, Fisher RJ, Dean DC. An intricate arrangement of binding sites for the Ets family of transcription factors regulates activity of the α4 integrin gene promoter. J Biol Chem. 1994;269:15652–15660. [PubMed] [Google Scholar]
- 29.Savangner P, Imhof BA, Yamada KM, Thiery J-P. Homing of hematopoietic precursor cells to the embryonic thymus: characterization of an invasive mechanism induced by chemotactic peptides. J Cell Biol. 1986;103:2715–2727. doi: 10.1083/jcb.103.6.2715. [DOI] [PMC free article] [PubMed] [Google Scholar]
- 30.Berlin C, Bargatze RF, Campbell JJ, von Andrian VH, Szabo MC, Hasslen SR, Nelson RD, Berg EL, Erlandsen SL, Butcher EC. α4 integrins mediate lymphocyte attachment and rolling under physiologic flow. Cell. 1995;80:413–422. doi: 10.1016/0092-8674(95)90491-3. [DOI] [PubMed] [Google Scholar]
- 31.Arroyo AG, Yang JT, Rayburn H, Hynes RO. Differential requirements for α4 integrins during fetal and adult hematopoiesis. Cell. 1996;85:997–1008. doi: 10.1016/s0092-8674(00)81301-x. [DOI] [PubMed] [Google Scholar]
- 32.Sawada M, Nagamine J, Takeda K, Utsumi K, Kosugi A, Tatsumi Y, Hamaoka T, Miyake K, Nakajima K, Watanabe T, Sakakibara S, Fujiwara H. Expression of VLA-4 on thymocytes. Maturation stage-associated transition and its correlation with their capacity to adhere to thymic stromal cells. J Immunol. 1992;149:3517–3524. [PubMed] [Google Scholar]
- 33.Salomon DR, Mojcik CF, Chang AC, Wadsworth S, Adams DH, Coligan JE, Shevach EM. Constitutive activation of integrin α4β1 defines a unique stage of human thymocyte development. J Exp Med. 1994;179:1573–1584. doi: 10.1084/jem.179.5.1573. [DOI] [PMC free article] [PubMed] [Google Scholar]
- 34.Shinkai Y, Rathbun G, Lam KP, Oltz EM, Stewart V, Mendelsohn M, Charron J, Datta M, Young F, Stall AM, Alt FW. RAG-2-deficient mice lack mature lymphocytes owing to inability to initiate V(D)J rearrangement. Cell. 1992;68:855–867. doi: 10.1016/0092-8674(92)90029-c. [DOI] [PubMed] [Google Scholar]
- 35.Mombaerts P, Iacomini J, Johnson RS, Herrup K, Tonegawa S, Papaioannou V E. RAG-1-deficient mice have no mature B and T lymphocytes. Cell. 1992;68:869–877. doi: 10.1016/0092-8674(92)90030-g. [DOI] [PubMed] [Google Scholar]
- 36.Philpott KL, Viney JL, Kay G, Rastan S, Gardiner EM, Chae S, Hayday AC, Owen MJ. Lymphoid development in mice congenitally lacking T cell receptor αβexpressing cells. Science (Wash DC) 1992;256:1448–1452. doi: 10.1126/science.1604321. [DOI] [PubMed] [Google Scholar]
- 37.Ohno H, Aoe T, Taki S, Kitamura D, Ishida Y, Rajewsky K, Saito T. Developmental and functional impairment of T cells in mice lacking CD3ζ chains. EMBO (Eur Mol Biol Organ) J. 1993;12:4357–4366. doi: 10.1002/j.1460-2075.1993.tb06120.x. [DOI] [PMC free article] [PubMed] [Google Scholar]
- 38.Peschon JJ, Morrissey PJ, Grabstein KH, Ramsdell FJ, Maraskovsky E, Gliniak BC, Park LS, Ziegler SF, Williams DE, Ware CB, et al. Early lymphocyte expansion is severely impaired in interleukin 7 receptor-deficient mice. J Exp Med. 1994;180:1955–1960. doi: 10.1084/jem.180.5.1955. [DOI] [PMC free article] [PubMed] [Google Scholar]
- 39.DiSanto JP, Muller W, Guy GD, Fischer A, Rajewsky K. Lymphoid development in mice with a targeted deletion of the interleukin 2 receptor gamma chain. Proc Natl Acad Sci USA. 1995;92:377–381. doi: 10.1073/pnas.92.2.377. [DOI] [PMC free article] [PubMed] [Google Scholar]
- 40.Nosaka T, van Deursen JMA, Tripp RA, Thierfelder WE, Whitthuhn BA, McMickle AP, Doherty PC, Grosveld GC, Ihle JN. Defective lymphoid development in mice lacking Jak3. Science (Wash DC) 1995;270:800–802. doi: 10.1126/science.270.5237.800. [DOI] [PubMed] [Google Scholar]
- 41.Russell SM, Tayebi N, Nakajima H, Riedy MC, Roberts JL, Aman MJ, Migone T-S, Noguchi M, Markert MJ, Buckley RH, et al. Mutation of Jak3 in a patient with SCID: Essential role of Jak3 in lymphoid development. Science (Wash DC) 1995;270:797–800. doi: 10.1126/science.270.5237.797. [DOI] [PubMed] [Google Scholar]
- 42.Thomis DC, Gurmiak CB, Tivol E, Sharpe AH, Berg LJ. Defects in B lymphocyte maturation and T lymphocyte activation in mice lacking Jak3. Science (Wash DC) 1995;270:794–797. doi: 10.1126/science.270.5237.794. [DOI] [PubMed] [Google Scholar]
- 43.Miyake K, Weissman IL, Greenberger JS, Kincade PW. Evidence for a role of the integrin VLA-4 in lympho-hemopoiesis. J Exp Med. 1991;173:599–607. doi: 10.1084/jem.173.3.599. [DOI] [PMC free article] [PubMed] [Google Scholar]
- 44.Utsumi K, Sawada M, Narumiya S, Nagamine J, Sakata T, Iwagami S, Kita Y, Teraoka H, Hirano H, Ogata M, Hamaoka T, Fujiwara H. Adhesion of immature thymocytes to thymic stromal cells through fibronectin molecules and its significance for the induction of thymocyte differentiation. Proc Natl Acad Sci USA. 1991;88:5685–5689. doi: 10.1073/pnas.88.13.5685. [DOI] [PMC free article] [PubMed] [Google Scholar]
- 45.Audet JF, Masson JY, Rosen GD, Salesse C, Guerin SL. Multiple regulatory elements control the basal promoter activity of the human α4 integrin gene. DNA Cell Biol. 1994;13:1071–1085. doi: 10.1089/dna.1994.13.1071. [DOI] [PubMed] [Google Scholar]
- 46.Williams TM, Moolten D, Burlein J, Romano J, Bhaerman R, Godillot A, Mellon M, Rauscher F J, III, Kant JA. Identification of a zinc finger protein that inhibits IL-2 gene expression. Science (Wash DC) 1991;254:1791–1794. doi: 10.1126/science.1840704. [DOI] [PubMed] [Google Scholar]
- 47.Ishida Y, Nishi M, Taguchi O, Inaba K, Minato N, Kawaichi M, Honjo T. Effects of the deregulated expression of human interleukin-2 transgenic mice. Int Immunol. 1989;1:113–120. doi: 10.1093/intimm/1.2.113. [DOI] [PubMed] [Google Scholar]
- 48.Akiyama M, Yokoyama M, Katsuki M, Habu S, Nishikawa T. Lymphocyte infiltration of the skin in transgenic mice carrying the human interleukin-2 gene. Arch Dermatol Res. 1993;285:379–384. doi: 10.1007/BF00372129. [DOI] [PubMed] [Google Scholar]
- 49.Schorle H, Holtschke T, Hünig T, Schimple A, Horak I. Development and function of T cells in mice rendered interleukin-2 deficient by gene targeting. Nature (Lond) 1991;352:621–624. doi: 10.1038/352621a0. [DOI] [PubMed] [Google Scholar]
- 50.Smith DE, Franco Del Amo F, Gridley T. Isolation of Sna, a mouse gene homologous to the Drosophila genes snail and escargot: its expression pattern suggests multiple roles during postimplantation development. Development. 1992;116:1033–1039. doi: 10.1242/dev.116.4.1033. [DOI] [PubMed] [Google Scholar]
- 51.Mauhin V, Lutz Y, Dennefeld C, Alberga A. Definition of the DNA-binding site repertoire for the Drosophilatranscription factor SNAIL. Nucleic Acids Res. 1993;21:3951–3957. doi: 10.1093/nar/21.17.3951. [DOI] [PMC free article] [PubMed] [Google Scholar]
- 52.Fuse N, Hirose S, Hayashi S. Diploidity of Drosophila imaginal cells is maintained by a transcriptional repressor encoded by escargot . Genes Dev. 1994;8:2270–2281. doi: 10.1101/gad.8.19.2270. [DOI] [PubMed] [Google Scholar]