

Abstract
After productive rearrangement of a TCRβ chain gene, CD4−8− double negative (DN) thymocytes express TCRβ polypeptide chains on the cell surface together with pre-Tα and the CD3 complex forming the pre-TCR. Signals transmitted through the pre-TCR select TCRβ+ DN thymocytes for further maturation to the CD4+8+ double positive stage, whereas DN cells that fail to generate a productive TCRβ gene rearrangement do not continue in development. This process is termed TCRβ chain selection. Although it is likely that differences between proliferation dynamics of TCRβ+ and TCRβ− cells may play a role, the exact mechanisms of TCRβ chain selection have not been elucidated. We therefore studied the proliferation dynamics of TCRβ+ and TCRβ− thymocytes during fetal development, i.e., when TCRβ chain selection takes place for the first time. We analyzed in situ accumulation of TCRβ+ thymocytes by confocal microscopy, and determined cell cycle and division parameters of TCRβ+ and TCRβ− populations by flow cytometry. About 600 TCRβ+ cells/thymic lobe are generated by independent induction events between days of gestation (dg) 13.5. and 15.5. As of dg 14.5, most TCRβ+ cells have entered S/G2 phase of cell cycle, followed by seven to eight rapid cell divisions in fetal thymic organ culture, suggesting a corresponding burst of nine cell divisions within 4 d in vivo. By dg 18.5, the division rate of TCRβ+ cells has slowed down to less than 1/d. About three quarters of TCRβ− cells divide at a slow rate of 1/d on dg 14.5, the proportion of nondividing cells increasing to 50% within the following four d. From dg 16.5 onwards, TCRβ− cells, but not TCRβ+ cells, contain a significant proportion of apoptotic cells. The results suggest that failure to become selected results in shutdown of proliferation and eventual programmed cell death of fetal TCRβ− cells. Positive selection of fetal TCRβ+ cells is achieved by an increased rate of cell divisions lasting for approximately 4 d.
During development in the thymus, αβ lineage thymocytes proceed through two main developmental checkpoints. First, cells with a CD4/CD8 double negative (DN)1 phenotype differentiate to CD4/CD8 double positive (DP) cells. Second, DP thymocytes develop into CD4 or CD8 single positive (SP) cells (reviewed in reference 1). Progression through either of these checkpoints is the result of a process of selection (reviewed in reference 2). Differentiation of DN to DP cells depends on the expression of the pre-TCR, consisting of the TCRβ chain, pre-Tα (3, 4), and components of the CD3 complex (reviewed in 5–9). Differentiation of DP to SP cells depends on the expression of a mature TCR, consisting of the TCRαβ heterodimer and the CD3 complex (2, 10). The TCRβ genes rearrange during the DN stage (11–13), and expression of the preTCR selects for the approximately 56% of rearranging cells that statistically generate a productive TCRβ gene (14). The TCRα genes rearrange during the DP stage (15). Thus, selection by the pre-TCR, also termed TCRβ chain selection, generates the repertoire of TCRβ chains to be combined with TCRα chains in the DP stage. A putative ligand for the selection by the pre-TCR is not known (16). DP cells expressing the mature αβTCR are selected, positively or negatively, by the ability of the αβTCR to interact with MHC/peptide ligands, thus generating the self tolerant, self-MHC restricted repertoire of CD4 or CD8 SP thymocytes and peripheral T cells (17, 18)
Pre-TCR–induced maturation of DN to DP thymocytes is associated with a complex cluster of differentiation events (reviewed in reference 8), including allelic exclusion of the TCRβ locus (10, 19, 20), initiation of germline transcription of the TCRα locus (20, 21), transient downregulation of the expression of the RAG genes (20, 22), shutdown of CD25 (23–25), and transient expression of the activation marker CD69 (26). Moreover, a large number of DP thymocytes is generated from a small number of DN cells, presumably by induction of cell proliferation. This expansion phase is impaired in the absence of TCRβ (27–32) or of pre-Tα (33). However, TCRβ-deficient DN thymocytes can be induced to proliferate and to differentiate to DP cells by cross-linking CD3ε, expressed on DN thymocytes before and independent of TCRβ (23–25, 34). These results suggested that cell proliferation associated with the differentiation of DN to DP thymocytes may be induced by pre-TCR–mediated signal transduction (26).
Cell division parameters of immature thymocytes have previously been studied in adult mice. Shortman et al. (35) studied proliferation and turnover of DN thymocytes by thymidine labeling in vivo and propidium iodide (PI) staining, and suggested the following sequence: the dividing, most immature DN CD44+ (PgP-1+) CD25− (IL-2Rα−) thymocytes mature sequentially through a nondividing CD25+CD44− stage into dividing CD25−CD44− DN cells before they enter the DP stage and exit cell cycle. Most of TCRβ rearrangement has been subsequently shown to take place at the nondividing CD25+CD44− transitory stage (12, 13). More recently, Penit et al. (36) reported results from 5-bromo-2′-deoxyuridine (BrdU) labeling of thymocytes in vivo suggesting that 70% of the CD25+CD44− DN cells were resting while 30% were proliferating. Hoffman et al. (37) showed that a subset of CD25+CD44− DN thymocytes expressed markers of cell division, such as CDK2 and cdc2. Since proliferating CD25+CD44− cells were not seen in RAG–deficient mice (36, 37), these authors speculated that the proliferating cells might be those that had produced functional TCRβ genes. However, none of these studies directly addressed the relationship between TCRβ expression and thymocyte proliferation. Parkin et al. (38) observed mitotic activity in newborn DN TCRβ+ thymocytes, but proliferation kinetics of TCRβ− cells have not been determined. Moreover, cell cycle and division parameters in fetal thymic development have not been studied.
The thymic anlage of mice starts to become repopulated with thymocyte precursors on day of gestation (dg) 11–12. TCRβ gene VDJ rearrangements were first detected in fetal thymocytes on dg 15.5 (39, 40). Cells expressing TCRβ chains were also observed on dg 15.5 by immunohistochemistry (41) and flow cytometry (FCM) among CD25+CD44− thymocytes (42). In the present report, we studied the accumulation and cell cycle dynamics of TCRβ+ thymocytes in ex vivo fetal thymuses and in dg 14.5 fetal thymic organ cultures (FTOC) during the following four d in vitro, using confocal laser scanning microscopy (CLSM) and flow cytometric analyses of PI- and BrdU-labeled cells. We detect TCRβ+ cells from dg 13.5 onwards. Before dg 15.5, TCRβ+ cells appear to accumulate mostly by independent induction events to reach approximately 600 independent TCRβ+ cells/thymic lobe at dg 15.5. Concomitantly, TCRβ+ cells rapidly enter the S/G2 phase of cell cycle. In FTOC, this is followed by 3 d of rapid proliferation, comprising at least seven to eight cell divisions, and an increase in total TCRβ+ cells of almost 200-fold. In vivo data suggest a corresponding burst of up to nine cell divisions and an approximately 500-fold expansion between dg 14.5 and 18.5. Thereafter, TCRβ+ cells return to slow cycle conditions. A majority of TCRβ− cells appears to be slowly cycling on dg 14.5 with a progressive increase in the proportion of noncycling TCRβ− cells to 50%, resulting in a 8-(in vitro) to 14-(in vivo) fold overall increase in TCRβ− cells during the 4 d of observation. A significant proportion of apoptotic cells is seen from dg 16.5 onwards among TCRβ−, but not among TCRβ+ thymocytes.
Materials and Methods
Mice.
BALB/c mice were obtained from our own specific pathogen-free animal facility. For timed pregnancies, mice were allowed to mate overnight (5 PM to 7 AM) and screened for vaginal plug. Noon of the following day was defined as dg 0.5. For in vivo labeling, pregnant mice were injected 18 h before analyses of fetal thymocytes with 250 μg of BrdU (Boehringer Mannheim GmbH, Mannheim, Germany), and drinking water was supplemented with 1 mg/ml of BrdU.
Fetal Thymic Organ Culture.
Fetal thymic organ cultures were performed with dg 13.5 or 14.5 thymic lobes as previously described (23, 24). Cultures were carried out for 1–4 d, referred to as day +1, +2, +3, and +4, respectively. BrdU labeling was done by incubation for 18 h with 10 μM concentration before analysis.
mAb.
The following mAb, labeled with FITC or PE, were purchased from PharMingen (San Diego, CA): anti-CD44, clone IMF; anti-TCRβ, clone H57-597; anti-TCRVβ6, clone RR4-7; and anti-TCRVβ3, clone KJ25. Anti-CD25, clone 5A2, was labeled with FITC in our own laboratory. FITC labeled anti-BrdU clone BMC9318 was from Boehringer Mannheim, GmbH.
FCM.
For propidium iodide/intracellular (IC) TCRβ double staining cells were first incubated with culture supernatant of mAb 2.4G2 to block FCγRII/III. Cells were then fixed with 1% paraformaldehyde for 30 min on ice, followed by three washing steps in PBS/2% FCS, the last containing, in addition, 0.1% saponin (Lot No. P4170; Sigma Chemical Co., Heidelberg, Germany). FITC labeled anti-TCRβ mAb in PBS/0.125% saponin was added for 20 min on ice, followed by two quick washes with PBS and 2 × 20 min on a rocking platform in PBS/2% FCS/ 0.1% saponin at 4°C. Cells were then fixed again in 1% paraformaldehyde, washed, incubated for 30 min at 37°C with 100 μg/ml RNAse (Boehringer Mannheim, GmbH) and stained with 20 μg/ml propidium iodide (Sigma Chemical Co.). After washing, cells were analyzed by FCM on a FACScan® (Becton Dickinson, Mountain View, CA) using gates (signal area versus signal width) that exclude doublet signals.
BrdU-labeled cells were first stained for intracellular TCRβ as described above, and were sorted into TCRβ+ and TCRβ− populations using a FACStar® plus (Becton Dickinson). Cells were then fixed with 70% ethanol for 30 min on ice, resuspended in 0.1 M HCl, 0.5% Triton X-100 for 10 min on ice, centrifuged, and resuspended in H2O. DNA was denatured by heating for 10 min at 95°C (43) followed by rapid cooling with ice-cold H2O. This heating step obliterated all TCRβ fluorescence. After one wash in 0.5% Triton X-100 in PBS, cells were incubated with FITC-labeled anti-BrdU mAb for 30 min at RT. FCM was done using a FACScan®.
Triple analyses for TCRβ, BrdU incorporation, and PI staining first used a sort for intracellular TCRβ, followed by staining for BrdU incorporation, as described above. PI staining was done last, also as described above.
Confocal Laser Scanning Microscopy.
Whole thymic lobes were quickly rinsed three times in PBS and then fixed with 2% paraformaldehyde for 3 h at 4°C on a rocking platform. They were washed twice in PBS, twice in PBS/1% FCS/1% Tween-100, and then incubated for 7 min in acetone at −20°C. This was followed by resuspension in H2O and 2 × 5 min rocking in PBS/ FCS/Tween. For mAb staining fixed lobes were first incubated for 30 min with unlabeled mAb 2.4 G2 and then for 30 min with each fluorochrome-labeled mAb alternating with 2 × 30 min rocking in PBS/FCS/Tween, all at 37°C. Lobes were then embedded on microscope slides in Fluoromount-C (Southern Biotechnology Assoc., Birmingham, AL), covered by a cover slip, turned upside down, and analyzed by an inverted CLSM instrument (Leica Instrs. GmbH, Heidelberg, Germany). Lobes were minimally compressed by this technique. Magnification was 400fold if not otherwise stated.
PCR for TCRβ rearrangement.
DNA was prepared from thymocytes as described (39). DNA was amplified in 25-μl reaction buffer, containing 0.1 μg DNA, 0.5 μM 5′ and 3′ primers, 200 μM of each dNTP (Pharmacia, Freiburg, Germany) and 0.2 U SuperTaq (Staehelin, Basel, Switzerland) for 34 cycles (40 s at 94°C, 60 s at 63°C, 120 s at 72°C). Primers were 5′Vβ3 (44), 5′Vβ8, 5′Dβ2, and 3′Jβ2 (45).
Results
Kinetics of Accumulation of the TCRβ+ and TCRβ− Subsets In Vivo and in FTOC.
Fetal thymuses were obtained from pregnant BALB/c mice from dg 14.5 to 18.5 and FTOC, were set up using dg 14.5 thymic lobes cultured for one to four d. Thymocytes were stained on each day for IC TCRβ chain, and Table 1 gives the absolute numbers of TCRβ+ and TCRβ− cells determined in both sets of experiments. About 100 TCRβ+ cells/lobe were detected on dg 14.5. This is not a staining artefact, as TCRβ+ cells identified by FCM on dg 14.5 differ drastically in PI staining pattern from TCRβ− cells (see Fig. 5). Moreover, we have no difficulties in demonstrating VDJ rearrangements by PCR in dg 14.5 thymic lobes (see below, Fig. 7 C). In vivo, numbers of TCRβ+ cells increased about 10-fold each day until dg 17.5, at which time the majority turned into DP thymocytes (data not shown; 42). This was followed by a 3–4-fold increase of TCRβ+ cells until dg 18.5. TCRβ− cells increased merely 14-fold over the entire time interval. In vitro, numbers of TCRβ+ cells increased fourfold during the first day of culture, and then eight–ninefold on each of the next 2 d and two–threefold on day four. TCRβ− thymocytes increased about eightfold until day +4 in FTOC. The end result is a proportion of TCRβ+ cells of ∼80% by day 18.5 in vivo or of ∼50% after 4 d of FTOC. The comparison between the cell increments in vitro and in vivo reveals the main difference between dg 15.5 and day +1 of culture, presumably reflecting a lag due to the recovery of the thymic lobes from the handling procedures. The differences later in the time course are smaller and may to some extent be due to lack of influx of new cells in vitro.
Table 1.
Accumulation of TCRβ+ and TCRβ− Cells in Early Fetal Thymic Development*
| In Vivo | In FTOC | |||||||
|---|---|---|---|---|---|---|---|---|
| TCRβ+ | TCRβ− | TCRβ+ | TCRβ− | |||||
| dg 14.5 | ∼102 | 1.1 × 10⁴ | ||||||
| dg 15.5 | 1.22 × 10³ (1.22) | 2.9 × 10⁴ | day+1 0.45 × 10³ (1.8) | 1.5 × 10⁴ | ||||
| dg 16.5 | 1.12 × 10⁴ (1.18) | 4.9 × 10⁴ | +2 4.1 × 10³ (1.67) | 2.8 × 10⁴ | ||||
| dg 17.5 | 1.4 × 10⁵ (1.32) | 7.5 × 10⁴ | +3 3.2 × 10⁴ (1.48) | 5.7 × 10⁴ | ||||
| dg 18.5 | 5.5 × 10⁵ (1.41) | 1.5 × 10⁵ | +4 7.9 × 10⁴ (1.62) | 8.5 × 10⁴ | ||||
Absolute numbers of thymocytes/thymic lobe estimated from the percentages of TCRβIC+ cells in FCM. Standard errors of the geometric means of several experiments in parentheses.
Figure 5.

Cell cycle analysis by PI staining of TCRβ+ and TCRβ− thymocytes from fetal thymic lobes recovered from BALB/c fetuses at dg 14.5, and from dg 14.5 FTOC cultured for 1–4 d. Thymocytes were double stained for intracellular TCRβ (TCRβIC, top) and PI. The lower panels show the PI staining (shaded patterns) of cells gated positively or negatively for TCRβ. Percentages of TCRβ+ cells and of cells with hypodiploid, diploid, and hyperdiploid amounts of DNA are given in each frame. LC, percentage of large blastoid cells as determined by scatter parameters.
Figure 7.

(A) BrdU incorporation into fetal thymic lobes recovered from BALB/c fetuses on dg 13.5 and kept in organ culture for 1 d. Experimental procedure and data representation essentially as in Fig. 6, except that the negative controls for BrdU staining are unmarked. (B) Triple analysis for TCRβ, BrdU incorporation, and PI staining of thymocytes recovered from dg 15.5 and 17.5 fetal thymic lobes of pregnant BALB/c mothers injected 18 h earlier with BrdU. IC TCRβ staining and sorting not shown. Sorted TCRβ+ and TCRβ− cells were double stained with PI (top, shaded patterns) and for BrdU incorporation (bottom). BrdU incorporation is shown separately for cells with diploid (horizontal stripes) and hyperdiploid (vertical stripes) PI staining. The small difference in BrdU intensity between the two populations is not significant, as there is some spillover of PI fluorescence into the FITC chanel. Negative controls (unmarked patterns) are as described in Fig. 6. (C) Analysis of TCRβ locus DJ and VDJ rearrangements by PCR in dg 14.5 fetal thymocytes (14.5), and in adult thymus (AT). Ethidium bromide–stained gel shown, inversely photographed. The six fragments seen with 5′Vβ8 and 5′Vβ3 primers correspond, from top to bottom, from VDβ2Jβ2.1 to VDβ2Jβ2.6 rearrangements. The additional fragment at the top of the Dβ2 to Jβ2 rearrangements represents the germline configuration.
Subset Relationships of Early Fetal TCRβ+ Thymocytes.
Expression of intracellular TCRβ chains before dg 15.5 has not been previously described and it was therefore nessessary to determine the subset relationships of these early TCRβ+ thymocytes. To this end, we prepared fetal thymic lobes from BALB/c mice at dg 13.5 and 14.5 and analyzed them by CLSM for TCRβ and CD44. Fig. 1 shows that TCRβ+ cells are detected as early as dg 13.5. However, even at this early timepoint, all unequivocally identified TCRβ+ cells were negative for CD44. In a second experiment (Fig. 2), fetal thymic lobes were prepared on dg 14.5, 15.5, and 16.5, and analyzed by CLSM for TCRβ and CD25. Out of 25 individually studied TCRβ+ cells on dg 14.5, 14 were were weakly positive (upper panel), and 11 were negative for CD25 (second panel). On dg 15.5 and 16.5, CD25 staining changed from a homogeneous to a spotty pattern, and the proportion of CD25+TCRβ+ cells decreased, in agreement with previous results from FCM (42). Together, these results suggest that even at this early stage in development, TCRβ expression does not preceed the CD25+CD44− stage of DN thymocytes.
Figure 1.

Confocal laser scanning microscopy of fetal thymic lobes recovered from BALB/c fetuses on dg 13.5 and 14.5. Two examples of dg 14.5 are shown. Left, Staining with FITC labeled anti-CD44; right, PE-labeled anti-panTCRβ; center, two color representation. Horizontal side length of one field is 100 μm.
Figure 2.
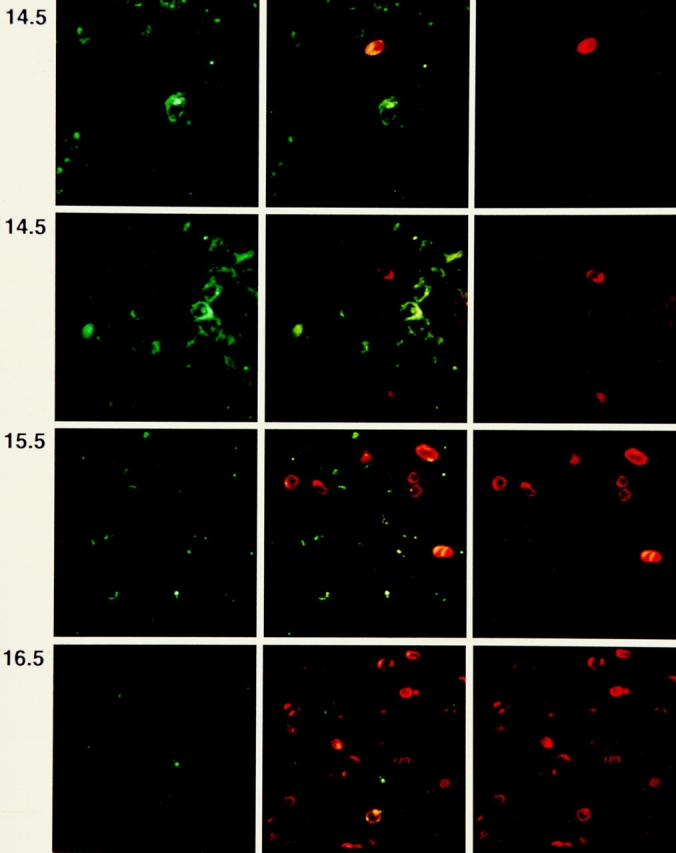
Confocal laser scanning microscopy of fetal thymic lobes recovered from BALB/c fetuses on dg 14.5, 15.5, and 16.5. Two examples of dg 14.5 are shown. Left, staining with FITC-labeled mAb to CD25; right, PE-labeled anti-panTCRβ mAb; center, two color representation. Note that the TCRβ+ cell in the upper example of dg 14.5 is CD25low, and in the lower example is CD25−. The side length of one square field is 100 μm.
Morphodynamics of the Accumulation of TCRβ+ Thymocytes In Vivo and in FTOC.
As shown in Fig. 2, TCRβ+ cells were readily detected on dg 14.5, and increased in density until dg 16.5, in parallel with a decrease in CD25+ cells. TCRβ+ cells on dg 14.5 are dispersed as rare individual cells whereas on dg 15.5 some of them appear as doublets or as large dividing cells, indicating that cell division may have started.
Ex vivo thymic lobes later than dg 16.5 were not readily analyzed by CLSM. Therefore, FTOC were set up with dg 14.5 thymic lobes and cultured for an additional 4 d. Individual lobes were fixed on each day of culture and double stained with mAbs against CD25 and against TCRβ (Fig. 3). The density of TCRβ+ cells after 1 d of culture was higher than on dg 14.5, but appeared lower than on dg 15.5 in ex vivo thymic lobes (see Fig. 2), and most TCRβ+ cells were still dispersed individually with doublets rarely seen. On each of the following 2 d of culture, an increase in the number of TCRβ+ cells was seen, with local accumulations within the field of observation on day +3. A further increase in TCRβ+ cells was seen on day +4, with the cells distributed densely over the entire field of observation. The intensity of CD25 staining and the number of CD25+ cells decreased in parallel with the increase in TCRβ+ cells, slightly delayed compared to the ex vivo analyses.
Figure 3.
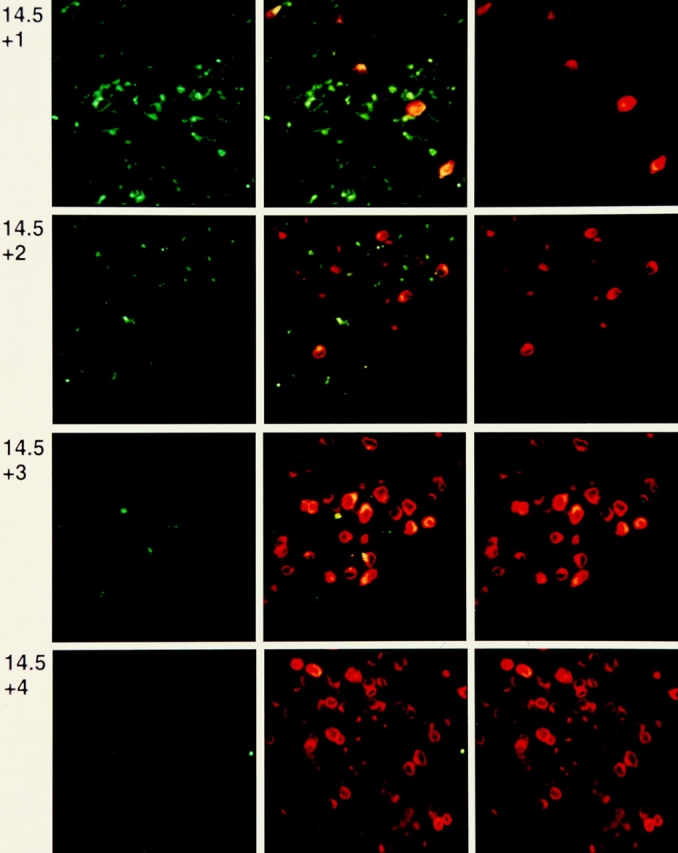
Confocal laser scanning microscopy of fetal thymic lobes recovered from BALB/c fetuses at dg 14.5 and kept in organ culture for 1–4 d. Left, FITC-labeled anti-CD25; right, PE-labeled anti-panTCRβ; center, two color representation. The side length of one square field is 100 μm.
The accumulation of TCRβ+ cells in FTOC was also studied using mAb to individual TCR Vβ gene products. Fig. 4 shows analyses using mAb to Vβ3 and Vβ6, which gave the best signal to noise ratios. For both TCR Vβ gene products, rare individual cells and a few doublets could be detected on day +1 and cellular clusters were detected from day +2 onwards. These clusters are interpreted as dividing TCRβ clones. For unkown reasons, cluster morphology differed between clones expressing TCRVβ3 and TCRVβ6, the former showing tightly packed and the latter showing more loosely associated accumulations of cells. Attempts were made to estimate cluster sizes by a combination of counting cells in individual scans taken at 3 μ intervals, and by superimposing 3 μ scans from top to bottom through a cluster. The results are compiled in Table 2 and suggest that clusters on day +2 range from 4 to 14 cells with clusters of 6 to 8 cells predominating. On day +3 estimates were more difficult, suggesting an average of 30 to 40 cells/cluster. Estimates of cluster sizes on day +4 were not possible, but a further increase in cluster size was apparent (not shown). These data suggest that individual TCRβ+ cells begin to proliferate in FTOC during day +1 and run through at least five cell divisions within the following 2 d, with additional cell divisions thereafter.
Figure 4.
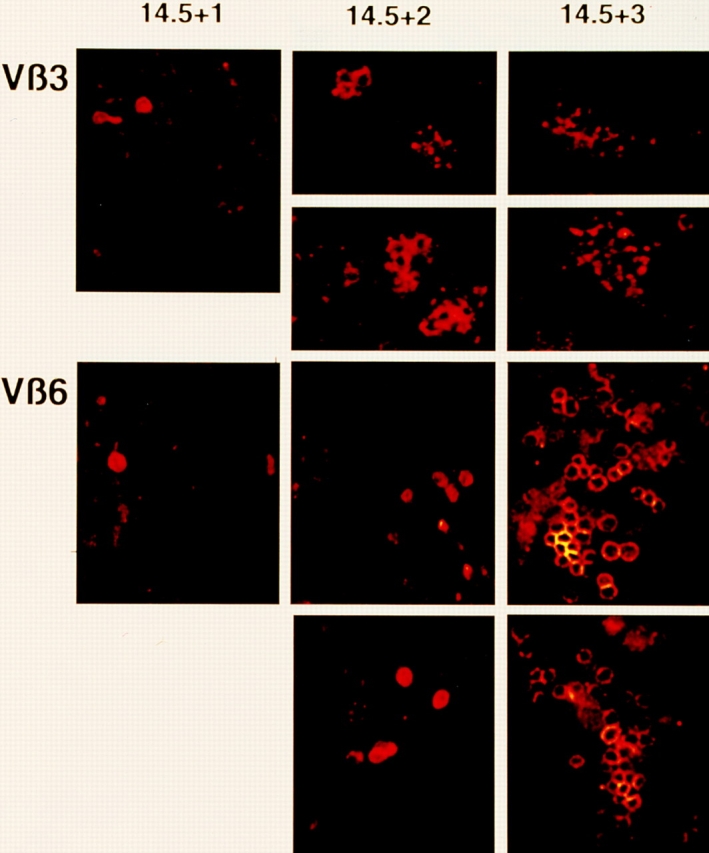
Confocal laser scanning microscopy of fetal thymic lobes obtained from BALB/c fetuses on dg 14.5 and kept in organ culture for 1–3 d. PE-labeled anti-Vβ3 and anti-Vβ6 mAb used for staining, as indicated. For each cluster, a single optical section is shown. The total number of cells/cluster is usually considerably larger than the number of cells seen in the sections shown ( see Table 2).
Table 2.
Sizes of TCRβ Clusters in FTOC*
| Day of culture | ||||||
|---|---|---|---|---|---|---|
| +1 | +2 | +3 | ||||
| Vβ3 | 11 × 1,2,2,3 | 4,5,6,6,9,11,14 | 23,24,32,33,42 | |||
| (1.3) | (7.8) | (31) | ||||
| Vβ6 | 14 × 1,2,3 | 5,6,6,8‡ | 29,34,37,45,46 | |||
| (1.2) | (6.25) | (38.2) | ||||
Cluster sizes determined by confocal laser scanning microscopy by scanning optical sections at 3 μm intervals. For examples see Fig. 4.
Due to the loose association of Vβ6+ cells, only a few safe examples of clusters could be analyzed.
Cell Cycle Analysis by Propidine Iodide Staining.
FTOC were used to focus the cell cycle analyses on a population that entered the thymus within a limited time window and was therefore expected to develop in a quasi-synchronous fashion. To this end, FTOC were set up on dg 14.5, and cells were double stained with anti-TCRβ mAb and PI immediately and on each of 4 d of culture. As shown in Fig. 5, TCRβ+ cells contain high proportions of cells with hyperdiploid concentrations of DNA, characteristic of the S/G2 phases of the cell cycle. The proportion of TCRβ+ cells in S/G2 is highest on dg 14.5, and decreases only slightly until day +4. This suggests that virtually all TCRβ+ cells are in cell cycle for the entire period of observation. The percentages of cells in S/G2 among TCRβ− cells are considerably lower, and decrease from ∼30% on dg 14.5 to <10% on day +4 of culture. Nevertheless, these data show that on dg 14.5 and during the initial days of culture, the TCRβ− subset contains a significant proportion of cycling cells as well. Proportions of blastoid cells were in good agreement with cells in S/G2 in all cases. Note, from day +2 onwards, small proportions of cells with hypodiploid DNA content are seen among the TCRβ−, but not among the TCRβ+ population. The detection of hypodiploid cells in only one of the two subsets argues against a tissue culture artefact (also see below) and suggests that TCRβ− cells may eventually die by apoptosis.
Proliferation Kinetics by Labeling with BrdU.
For labeling with BrdU, we sorted TCRβ+ and TCRβ− cells from FTOC preincubated with BrdU, and stained them with anti-BrdU mAb after denaturation of the DNA by heating to 90° (43). This method reliably permitted the differentiation of two distinct levels of BrdU incorporation, apparently corresponding to partial and saturating DNA labeling. Since the results from CLSM suggested that TCRβ+ fetal thymocytes divide at least 2–3 times/day between days +1 and +3 of FTOC, we chose a labeling period of 18 h before analysis. During this time interval, nearly all asynchronously dividing cells with a cycle time of less than nine h should have acquired a saturating BrdU label, whereas longer cycle times should have been revealed by increasing proportions of partially labeled and unlabeled cells. The results of representative experiments for each day are compiled in Fig. 6. TCRβ+ cells on day +1 fell into three categories: one third remained unlabeled, one third incorporated a partial, and one third incorporated a saturating dose of BrdU. On day +2, the vast majority of TCRβ+ cells had incorporated a saturating dose, whereas this proportion dropped to ∼50% on day +3. On day +4, nearly all of the TCRβ+ cells showed partial BrdU labeling. About 20–25% of the TCRβ− cells remained unlabeled from day +1 to d +3, whereas the rest of the cells incorporated a partial BrdU label. By day +4, the proportion of unlabeled TCRβ− cells increased to 50%. Together, these results suggest that TCRβ+ cells enter a phase of rapid proliferation on day +1 of FTOC with some of the cells going through at least one division. Essentially all of the cells progress through at least three divisions on day +2, and most of the cells through another three divisions on day +3. On day +4, most TCRβ+ cells divide at least once more while turning back to slow cycle conditions. Most of the TCRβ− cells maintain a slow cycle throughout the first 3 d of culture with no more than one division per day and a reduction in the proportion of cycling cells to 50% until day +4.
Figure 6.

BrdU incorporation in fetal thymic lobes recovered from BALB/c fetuses on dg 14.5 and kept in organ culture for 1–4 d. BrdU was added to the culture medium 18 h before termination of culture. Thymocytes were stained for TCRβ (upper panels, percentages of TCRβ+ cells indicated), sorted into TCRβ− and TCRβ+ cells (second panels, cross-hatched and dotted patterns, respectively), and analyzed for BrdU incorporation (third and fourth panels). Note the three levels of BrdU staining (vertical stripes). Percentages of BrdU negative cells and of partially and completely BrdU-labeled cells indicated in each frame. Negative controls (shaded) used thymocytes recovered from thymic lobes cultured without BrdU, and then incubated with BrdU for 30 min on ice, washed, and subjected to the antiBrdU staining procedure.
The results of BrdU incorporation suggested that the phase of rapid divisions of TCRβ+ cells only begins on day +1 in FTOC (Fig. 6). In contrast, PI staining showed >60% of TCRβ+ cells to be in S/G2 already in dg 14.5 ex vivo thymic lobes (Fig. 5). The incomplete BrdU incorporation into TCRβ+ cells on day +1 of dg 14.5 FTOC could indicate an intermittant slowdown of proliferation due to the transfer of the thymic lobes to in vitro conditions. Alternatively, it was possible that TCRβ+ cells remain in a prolonged S/G2 phase through dg 14.5 and most of dg 15.5 before actually undergoing their first division. In the latter case, only unlabeled and partially BrdU labeled TCRβ+ cells should be seen in dg 13.5 FTOC incubated with BrdU for 18 h before analysis on day 13.5+1. As shown in Fig. 7 A, the BrdU incorporation patterns after 1 d of culture of dg 13.5 FTOC were similar to those of dg 14.5 FTOC, with an even higher proportion of TCRβ+ cells labeled to saturation. These data suggest that dg 13.5 TCRβ+ thymocytes have at least a similar capacity for proliferation in vitro as have dg 14.5 TCRβ+ cells. Moreover, we reasoned that if the onset proliferation of TCRβ+ cells in vivo was delayed until late dg 15.5, only the cells in S/G2, and not the cells in G1 phase of cell cycle on that day, should have incorporated BrdU injected into the pregnant mothers 18 h earlier. As shown in Fig. 7 B, labeling in vivo was not as efficient as in vitro, and did not permit a quantitative determination of unlabeled, as compared to partially and completely labeled, cells. Nevertheless, the data show that both G1 and S/G2 phase TCRβ+ cells on dg 15.5 incorporated BrdU under these conditions in vivo. These results support our conclusions from CLSM analyses and suggest that TCRβ+ thymocytes start cell divisions as early as dg 14.5 in vivo, and that transfer to in vitro conditions causes a lag in the onset of proliferation. The data in Fig. 7 B further reveal that dg 15.5 and 17.5 TCRβ− cells in both G1 and S/G2 phases of cell cycle incorporated BrdU injected 18 h earlier into the pregnant mothers. These data support the in vitro results in that they are consistent with a division rate of once per day for the major proportion of TCRβ− cells. Finally, and also in support of the in vitro results, dg 17.5 TCRβ−, but not TCRβ+, cells contain a proportion of hypodiploid cells suggesting ongoing cell death by apoptosis in this population.
The experiment in Fig. 7 C demonstrates that PCR analysis yielded fragments corresponding to TCRβ VDJ rearrangements in dg 14.5 thymocytes, together with stronger signals for DJ rearrangements and a strong germ line fragment. In contrast to adult thymus, VDJ rearrangements at dg 14.5 display only some of the six Jβ2 segments, presumably reflecting the paucity of rearranged TCR Vβ genes at that time. These data support our serological detection of TCRβ+ cells in dg 14.5 thymocytes.
Discussion
During thymic development, a large number of DP thymocytes arise from a small number of DN cells. While this process most likely involves cell proliferation, the extent of cell division cannot be judged from the pool sizes of DN and DP cells, as these are strongly influenced by parameters unrelated to cell division, such as entry rates, exit rates, and mean survival times (46). The present paper describes an attempt to obtain numerical information on cell divisions that occur during the generation of DP cells, using a combination of morphodynamic studies in situ with cell cycle analyses. To focus on cells that have entered the thymus during a defined temporal window in fetal life, most analyses have been done in thymic organ cultures. While it is clear that the increment in thymic cellularity during fetal life in vivo exceeds that in vitro, a proportion of the additional increment in vivo is obviously due to continuous influx of new cells into the thymus. Another proportion of the difference may be due to suboptimal conditions in vitro, so that numbers and rates of cell divisions determined in these studies obviously represent lower estimates. However, our comparisons of cell accumulation in vitro and in vivo localize the major deficit of FTOC to the first day of culture so that our data provide a reasonable basis for estimates of fetal thymocyte proliferation in vivo.
Differentiation of DN to DP cells is dependent on the expression of the TCRβ chain, most likely as part of the pre-TCR. Fetal thymocytes expressing TCRβ polypeptides have first been reported on dg 15.5 (41, 42). We were surprised to see TCRβ+ cells as early as dg 13.5 by CLSM and attribute the increased sensitivity to the capacity to search for individual fluorescent cells by scanning through the entire thymic organ. Since thymic repopulation begins around dg 11 to 12, it appears that TCRβ rearrangement may either be complete within 2 d of thymic arrival, or that some cells may enter the thymus with previous TCRβ VDJ rearrangements. The latter possibility is not excluded by our data; although we never saw CD44+TCRβ+ thymocytes on dg 13.5 or 14.5, biosynthesis of the TCRβ chain may be delayed after rearrangement. However, the developmental stage of TCRβ gene rearrangement previously determined in adult mice (11–13) seems to hold for fetal development as well (39, 40).
What are the proportions of TCRβ+ cells arising by de novo induction and by subsequent proliferation? During dg 13.5 and 14.5, most TCRβ+ thymocytes appear as individually dispersed cells in CLSM. On dg 15.5, a greater number of TCRβ+ cells with many doublets are seen, followed by a further increase in density on dg 16.5. Thus, according to CLSM, little cell division occurs for at least one day after thymocytes first express a TCRβ polypeptide. We therefore think that the ∼100 TCRβ+ cells in dg 14.5 fetal thymic lobes almost exclusively arise by independent induction events. In situ analyses of the TCRβ+ population in FTOC shows maintenance of the individually dispersed appearance of TCRβ+ cells until day +1, and BrdU incorporation suggests that about one third of these cells have arisen by cell division. Together, these results suggest that a minimum of 300 of the 400 TCRβ+ cells/thymic lobe after one day of FTOC arose by independent induction events. Our data from CLSM and from BrdU incorporation in vivo suggest that at least half of the 1,200 TCRβ+ cells/thymic lobe on dg 15.5 in vivo may be the products of cell division, suggesting a maximum of 900 independently induced TCRβ+ cells until that time. Together, our data suggest about 600, certainly less than the 1,000 independently induced TCRβ+ cells/thymic lobe until dg 15.5. Thereafter, as shown by BrdU incorporation, TCRβ+ cells accumulate predominantly by cell division. Productive TCRβ locus rearrangement thus seems to take place in <10% of the cells that have entered the thymus until dg 14.5, i.e., in a rather small proportion of thymocytes. Even after subtraction of ∼10% γδ thymocytes present at that time, this is significantly less than statistically expected if all remaining thymocytes were induced to rearrange their TCRβ genes. Induction of TCRβ locus rearrangement may thus be a relatively inefficient process in early fetal thymocytes.
From day +1 of FTOC onwards, TCRβ+ cells undergo a series of rapid cell divisions resulting in a nearly 200-fold expansion of this population within the following 3 d. This expansion phase is indeed burst-like; it acquires maximum speed (⩾3 divisions/d) on days +2 and +3, and returns to a slow rate of about one–two divisions during the fourth day. Estimates of cell divisions are derived from three mutually supportive sources of information: cell counts by FCM, BrdU incorporation, and morphodynamic studies on the expansion of TCRVβ clones in situ. The rates of cell division estimated from the latter source are slightly lower, possibly due to some degree of underestimation of clone sizes in CLSM. Alternatively, clones expressing different TCRVβ products may expand with somewhat different kinetics. The total accumulation of TCRβ+ thymocytes in 4 d of FTOC is ∼1/6–1/7 of that determined until the corresponding dg 18.5 in vivo. Half of this difference is due to a slowdown in proliferation during the first day of FTOC, leading to threefold less TCRβ+ cells on day +1 of culture than on dg 15.5 in vivo. Most of the other half can perhaps be accounted for by lack of influx of new precursor cells into the thymus. Thus, we estimate an about 500-fold expansion of TCRβ clones during the burst in vivo, corresponding to about nine cell divisions within a time frame of ∼4 d.
The biological purpose of pre-TCR dependent proliferation appears to be the selection for further maturation of thymocytes with a functional rearrangement of the TCRβ locus, thus avoiding the further differentiation of useless cells that have failed to productively rearrange a TCRβ gene. Our analyses of TCRβ− cells in FTOC reveals an initial proportion of ∼30% in S/G2 which declines to <10% over the 4 d of culture. Moreover, an initial proportion of 3/4, declining to 1/2, becomes partially labeled with BrdU during an 18 h pulse. Both sets of data are roughly in agreement and suggest that the majority of TCRβ− cells are indeed dividing between dg 14.5 and 18.5, but they do so at a slower rate than that of the TCRβ+ cells. With the exception of dg 14.5 to 15.5, the increment of TCRβ− cells/day is < twofold in vitro and in vivo. This results in an ∼8–14-fold increment in TCRβ− cells until day +4 in FTOC or dg 18.5 in vivo, consistant with one division/day of most, but not all cells. We observed small but significant proportions of apoptotic TCRβ− cells in vivo and in vitro, indicating that cells that have failed to generate a productive TCRβ rearrangement eventually die by programmed cell death. The increase in the proportion of nondividing TCRβ− cells over the 4 d is consistent with the notion that shutdown of proliferation preceeds cell death. Taken together, it appears that the major mechanism of pre-TCR–dependent positive selection of fetal thymocytes is a burst of up to nine rapid cell divisions that begins within less than two day after TCRβ expression and lasts for about 4 d. In contrast, lack of selection of TCRβ− cells is reflected in a limited maintenance of slow proliferation, then shutdown of proliferation, and eventual cell death by apoptosis.
What is the cell cycle status of TCRβ+ cells on dg 13.5 and 14.5, i.e., before we can see doublet formation in CLSM? As judged by PI staining >60% of TCRβ+ cells have entered S/G2 phase on dg 14.5, and TCRβ+ cells in G1 of cell cycle on dg 15.5 have incorporated BrdU during an 18 h pulse. These in vivo results suggest that TCRβ+ cells may begin to divide as early as dg 14.5. This conclusion is further supported by our finding that many TCRβ+ cells incorporate saturating amounts of BrdU on day +1 of dg 13.5 FTOC. Nevertheless, our CLSM results suggest a delay period between TCRβ chain expression and the start of cell proliferation. We could not exactly define this interval but feel that for most thymocytes the burst of rapid divisions does not start until about one day following expression of the TCRβ chain, and that most of this delay may be spent in the G2 phase of cell cycle. An interesting set of questions arising from these results concerns the potential biological role of a delay before proliferation sets in: Does proliferation perhaps require a second signal, for example through cytokine–cytokine receptor interaction (47–49). Is the delay phase important for DNA repair subsequent to TCRβ rearrangement, and how is this delay phase regulated? Recent experiments suggest that p53 may perhaps have an important role in regulating pre-TCR dependent differentiation events (50).
How do these results on fetal thymocytes compare to previous studies on proliferation of adult thymocyte subsets? According to Shortman et al. (35) the maturation of DN to DP thymocytes is accompanied by two phases of proliferation, separated by the CD25+CD44− DN stage in which the cells are resting. The latter subset, at which TCRβ rearrangement takes place, was found by Penit et al. (36) and by Hoffman et al. (37) to be split into dividing and nondividing cells. Although not directly shown, the dividing and nondividing subsets were interpreted as TCRβ+ and TCRβ− cells, respectively, and it was speculated that the latter cells would die due to lack of positive selection. A 200–300 fold expansion takes place during the subsequent proliferation phase which begins at the CD25−CD44− DN stage, ends with small resting DP cells, and lasts 6 d (35, 36). As far as they can be compared, our results are roughly in agreement with these data. For example, the numbers of cell divisions and the expansion factors do not appear to drastically differ between fetal and adult thymocytes. Moreover, the dividing TCRβ− subset in fetal thymus could correspond to the first proliferative phase involving the immature CD44+CD25− population whereas the resting TCRβ− subset in fetal thymocytes could potentially correspond to the nondividing subset among the CD25+CD44− adult DN cells. The results described in this paper have augmented previous knowledge primarily by firmly establishing the causal connection between the second phase of thymocyte proliferation and the expression of the TCRβ chain, in addition to providing numerical information on fetal thymocyte proliferation.
Footnotes
1 Abbreviations used in this paper: BrdU, 5-bromo-2′-deoxyuridine; CLSM, confocal laser scanning microscopy; dg, day of gestation; DN, double negative; DP, double positive; FCM, flow cytometry; FTOC, fetal thymic organ culture; IC, intracellular; PI, propidium iodide; SP, single positive.
References
- 1.Godfrey DI, Zlotnik A. Control points in early T-cell development. Immunol Today. 1993;14:547–554. doi: 10.1016/0167-5699(93)90186-O. [DOI] [PubMed] [Google Scholar]
- 2.Robey E, Fowlkes BJ. Selective events in T cell development. Ann Rev Immunol. 1994;12:675–705. doi: 10.1146/annurev.iy.12.040194.003331. [DOI] [PubMed] [Google Scholar]
- 3.Groettrup M, Ungewiss K, Azogui O, Palacios R, Owen MJ, Hayday AC, von Boehmer H. A novel disulphide-linked heterodimer on pre–T cells consists of the T cell receptor β chain and a 33 kD glycoprotein. Cell. 1993;75:283–294. doi: 10.1016/0092-8674(93)80070-u. [DOI] [PubMed] [Google Scholar]
- 4.Saint-Ruf C, Ungewiss K, Groettrup M, Bruno L, Fehling HL, von Boehmer H. Analysis and expression of a pre-T cell receptor gene. Science (Wash DC) 1994;266:1208–1212. doi: 10.1126/science.7973703. [DOI] [PubMed] [Google Scholar]
- 5.Groettrup M, von Boehmer H. Role for a pre–T cell receptor in T cell development. Immunol Today. 1993;14:610–614. doi: 10.1016/0167-5699(93)90201-U. [DOI] [PubMed] [Google Scholar]
- 6.Levelt CN, Eichmann K. Parallel development of the T cell and its receptor. The . Immunologist. 1993;1:151–154. [Google Scholar]
- 7.Levelt CN, Eichmann K. Receptors and signals in early thymic selection. Immunity. 1995;3:667–672. doi: 10.1016/1074-7613(95)90056-x. [DOI] [PubMed] [Google Scholar]
- 8.Tanaka Y, Ardouin L, Gillet A, Lin SY, Magnan A, Malissen B, Malissen M. Early T-cell development in CD3–deficient mice. Immunol Rev. 1995;148:171–199. doi: 10.1111/j.1600-065x.1995.tb00098.x. [DOI] [PubMed] [Google Scholar]
- 9.Zunicka-Pflücker JL, Lenardo MJ. Regulation of thymocyte development from immature progenitors. Curr Opin Immunol. 1996;8:215–224. doi: 10.1016/s0952-7915(96)80060-4. [DOI] [PubMed] [Google Scholar]
- 10.Von Boehmer H. Developmental biology of T cells in T cell–receptor transgenic mice. Annu Rev Immunol. 1990;8:531–556. doi: 10.1146/annurev.iy.08.040190.002531. [DOI] [PubMed] [Google Scholar]
- 11.Godfrey DI, Kennedy J, Suda T, Zlotnik A. Developmental pathway involving 4 phenotypically and functionally distinct CD3−CD4−CD8−triple-negative adult mouse thymocytes defined by CD44 and CD25 expression. J Immunol. 1993;150:4244–4252. [PubMed] [Google Scholar]
- 12.Godfrey DI, Kennedy J, Mombaerts P, Tonegawa S, Zlotnik A. Onset of TCRβ rearrangment and role of TCRβ expression during CD3−CD4−CD8−thymocyte differentiation. J Immunol. 1994;152:4783–4792. [PubMed] [Google Scholar]
- 13.Dudley EC, Petrie HT, Shah LM, Owen MJ, Hayday AC. T cell receptor β chain gene rearrangement and selection during thymocyte development in adult mice. Immunity. 1994;1:83–92. doi: 10.1016/1074-7613(94)90102-3. [DOI] [PubMed] [Google Scholar]
- 14.Mallick CA, Dudley EC, Viney JL, Owen MJ, Hayday AC. Rearrangement and diversity of T cell receptor β chain genes in thymocytes, a critical role for the β chain in development. Cell. 1993;73:513–519. doi: 10.1016/0092-8674(93)90138-g. [DOI] [PubMed] [Google Scholar]
- 15.Petrie T, Livak F, Schatz DG, Strasser A, Crispe IN, Shortman K. Multiple rearrangements in T cell receptor α chain genes maximize the production of useful thymocytes. J Exp Med. 1993;178:615–622. doi: 10.1084/jem.178.2.615. [DOI] [PMC free article] [PubMed] [Google Scholar]
- 16.Boismenu R, Rhein M, Fischer WH, Havran WL. A role for CD81 in early T cell development. Science (Wash DC) 1996;271:198–200. doi: 10.1126/science.271.5246.198. [DOI] [PubMed] [Google Scholar]
- 17.Kisielow P, Blüthmann H, Staerz UD, Steinmetz M, von Boehmer H. Tolerance in T cell receptor transgenic mice involves deletion of nonmature CD4+CD8+thymocytes. Nature (Lond) 1988;333:742–746. doi: 10.1038/333742a0. [DOI] [PubMed] [Google Scholar]
- 18.Rothenberg EV. Signaling mechanisms in thymocyte selection. Curr Opin Immunol. 1994;6:257–265. doi: 10.1016/0952-7915(94)90099-x. [DOI] [PubMed] [Google Scholar]
- 19.Malissen M, Tracy J, Janvin-Marche E, Cazenave PA, Scollay R, Malissen B. Regulation of TCRα and β gene allelic exclusion during T cell development. Immunol Today. 1992;13:315–322. doi: 10.1016/0167-5699(92)90044-8. [DOI] [PubMed] [Google Scholar]
- 20.Levelt CN, Wang B, Ehrfeld A, Terhorst C, Eichmann K. Regulation of T cell receptor (TCR)-β locus allelic exclusion and initiation of TCRβ locus rearrangement in immature thymocytes by signaling through the CD3 complex. Eur J Immunol. 1995;25:1257–1261. doi: 10.1002/eji.1830250519. [DOI] [PubMed] [Google Scholar]
- 21.Capone M, Watrin F, Fernex C, Horvat B, Krippl B, Wu L, Scollay E, Ferner P. TCR β and TCR α gene enhancers confer tissue- and stage-specificity on V(D)J recombination events. EMBO (Eur Mol Biol Organ) J. 1993;12:4335–4346. doi: 10.1002/j.1460-2075.1993.tb06118.x. [DOI] [PMC free article] [PubMed] [Google Scholar]
- 22.Wilson A, Held W, MacDonald HR. Two waves of recombinase gene expression in developing thymocytes. J Exp Med. 1994;179:1355–1360. doi: 10.1084/jem.179.4.1355. [DOI] [PMC free article] [PubMed] [Google Scholar]
- 23.Levelt CN, Ehrfeld A, Eichmann K. Regulation of thymocyte development through CD3. I. Timepoint of ligation of CD3ε determines clonal deletion or induction of developmental program. J Exp Med. 1993;177:707–716. doi: 10.1084/jem.177.3.707. [DOI] [PMC free article] [PubMed] [Google Scholar]
- 24.Levelt CN, Mombaerts P, Iglesias A, Tonegawa S, Eichmann K. Restoration of early thymocyte differentiation in T-cell receptor β-chain deficient mutant mice by transmembrane signaling through CD3ε. Proc Natl Acad Sci USA. 1993;90:11401–11405. doi: 10.1073/pnas.90.23.11401. [DOI] [PMC free article] [PubMed] [Google Scholar]
- 25.Shinkai Y, Alt FW. CD3ε -mediated signals rescue the development of CD4+CD8+ thymocytes in RAG2−/−mice in the absence of TCR β chain expression. Int Immunol. 1994;6:995–1001. doi: 10.1093/intimm/6.7.995. [DOI] [PubMed] [Google Scholar]
- 26.Levelt CN, Mombaerts P, Wang B, Kohler H, Tonegawa S, Eichmann K, Terhorst C. Regulation of thymocyte development through CD3: functional dissociation between p56lckand CD3ζ in early thymic selection. Immunity. 1995;3:215–222. doi: 10.1016/1074-7613(95)90091-8. [DOI] [PubMed] [Google Scholar]
- 27.Mombaerts P, Clarke AR, Rudnicki MA, Iacomini J, Itohara S, Lafaille JJ, Wang L, Ichikawa Y, Jaenisch R, Hooper ML, Tonegawa S. Mutations in T cell antigen receptor genes α and β block thymocyte development at different stages. Nature (Lond) 1992;360:225–231. doi: 10.1038/360225a0. [DOI] [PubMed] [Google Scholar]
- 28.Mombaerts P, Iacomini J, Johnson RS, Herup K, Tonegawa S, Papaicannou VE. RAG-1–deficient mice have no mature B and T lymphocytes. Cell. 1992;68:869–877. doi: 10.1016/0092-8674(92)90030-g. [DOI] [PubMed] [Google Scholar]
- 29.Shinkai Y, Koyeau S, Nakayama K, Murphy KM, Loh DY, Reinherz EL, Alt FW. Restoration of T cell development in RAG2-deficient mice by functional TCR transgenes. Science (Wash DC) 1992;259:822–825. doi: 10.1126/science.8430336. [DOI] [PubMed] [Google Scholar]
- 30.Shinkai Y, Rathbun G, Lam KP, Oltz EM, Stewart V, Mendelsohn M, Charron J, Datta M, Young F, Stall AM, Alt FW. RAG2-deficient mice lack mature lymphocytes owing to inability to initiate V(D)J rearrangement. Cell. 1992;68:855–867. doi: 10.1016/0092-8674(92)90029-c. [DOI] [PubMed] [Google Scholar]
- 31.Shores EW, Sharrow SO, Uppenkamp I, Singer A. T cell receptor negative thymocytes from Scid mice can be induced to enter the CD4/CD8 differentiation pathway. Eur J Immunol. 1990;20:69–75. doi: 10.1002/eji.1830200111. [DOI] [PubMed] [Google Scholar]
- 32.Habu S, Kimura M, Katsuki M, Hioki K, Nomuta T. Correlation of T cell receptor gene rearrangements to T cell surface antigen expression and to serum immunoglobulin level in Scid mice. Eur J Immunol. 1987;17:1467–1471. doi: 10.1002/eji.1830171013. [DOI] [PubMed] [Google Scholar]
- 33.Fehling JJ, Krotkova A, Saint-Ruf C, v. Boehmer H. Crucial role of the pre–T cell receptor α gene in the development of αβ but not of γδ cells. Nature (Lond) 1995;375:795–798. doi: 10.1038/375795a0. [DOI] [PubMed] [Google Scholar]
- 34.Jacobs H, Vandeputte D, Tolkamp L, de Vries E, Borel J, Berns A. CD3 components at the cell surface of pro–T cells can mediate pre–T cell development in vivo. Eur J Immunol. 1994;24:934–939. doi: 10.1002/eji.1830240423. [DOI] [PubMed] [Google Scholar]
- 35.Shortman K, Egerton M, Spangrude GJ, Scollay K. The generation and fate of thymocytes. Semin Immunol. 1990;2:3–12. [PubMed] [Google Scholar]
- 36.Penit C, Lucas B, Vasseur F. Cell expansion and growth arrest phases during the transition from precursor (CD4−8−) to immature (CD4+8+) thymocytes in normal and genetically modified mice. J Immunol. 1995;154:5103–5113. [PubMed] [Google Scholar]
- 37.Hoffman EG, Passoni L, Crompton T, Len TMJ, Schatz DG, Kaff A, Owen MJ, Hayday AJ. Productive T cell receptor β chain gene rearrangement: coincident regulation of cell cycle and clonality during development in vivo. Genes Dev. 1996;10:984–962. doi: 10.1101/gad.10.8.948. [DOI] [PubMed] [Google Scholar]
- 38.Parkin IG, Owen JJT, Jenkinson EJ. Proliferation of thymocytes in relation to T-cell receptor β chain expression. Immunology. 1988;64:97–99. [PMC free article] [PubMed] [Google Scholar]
- 39.Rodewald HR, Awad K, Moingeon P, D'Adamaoi L, Rabinowitz D, Shinkai Y, Alt TW, Reinherz EL. Fcγ RII/III and CD2 mark distinct subpopulations of immature CD4−CD8−thymocytes: in vivo development kinetics on T cell receptor β chain rearrangement status. J Exp Med. 1993;177:1079–1092. doi: 10.1084/jem.177.4.1079. [DOI] [PMC free article] [PubMed] [Google Scholar]
- 40.Hozumi K, Kobori A, Sato T, Nozaki H, Nishikawa S-L, Nishimura T, Habu S. Pro-T cells in fetal thymus express c-kit and RAG-2 do not rearrange the gene encoding the T cell receptor β chain. Eur J Immunol. 1994;24:1339–1344. doi: 10.1002/eji.1830240615. [DOI] [PubMed] [Google Scholar]
- 41.Cristanti X, Colantani A, Snodgrass R, von Boehmer H. Expression of T cell receptors by thymocytes: in situstaining and biochemical analysis. EMBO (Eur Mol Biol Organ) J. 1986;5:2837–2843. doi: 10.1002/j.1460-2075.1986.tb04577.x. [DOI] [PMC free article] [PubMed] [Google Scholar]
- 42.Levelt CN, Carsetti R, Eichmann K. Regulation of thymocyte development through CD3. II. Expression of T cell receptor β CD3ε and maturation to the CD4+ CD8+stage are highly correlated in individual thymocytes. J Exp Med. 1993;178:1867–1875. doi: 10.1084/jem.178.6.1867. [DOI] [PMC free article] [PubMed] [Google Scholar]
- 43.Hoy CA, Seamer LL, Schimke RT. Thermal denaturation of DNA for immuno-chemical staining of incorporated bromodeoxyuridine (BrdUrd): critical factors that affect the amount of fluorescence and the shape of BrdUrd/ DNA histogram. Cytometry. 1989;10:718–725. doi: 10.1002/cyto.990100608. [DOI] [PubMed] [Google Scholar]
- 44.Casanova JL, Romero P, Widmann C, Kourilsky P, Maryansky JL. T cell receptor genes in a series of class I major histocompatibility complex-restricted cytotoxic T lymphocyte clones specific for a Plasmodium bergheinonapeptide: implications for T cell allelic exclusion and antigen-specific repertoire. J Exp Med. 1991;174:1371–1383. doi: 10.1084/jem.174.6.1371. [DOI] [PMC free article] [PubMed] [Google Scholar]
- 45.Anderson SI, Abraham KM, Nakayama T, Singer A, Perlmutter RM. Inhibition of T-cell receptor β-chain gene rearrangement by overexpression of the non-receptor protein tyrosine kinase p56lck . EMBO (Eur Mol Biol Organ) J. 1992;11:4877–4886. doi: 10.1002/j.1460-2075.1992.tb05594.x. [DOI] [PMC free article] [PubMed] [Google Scholar]
- 46.Egerton M, Shortman K, Scollay R. The kinetics of immature murine thymocyte development in vivo. . Int Immunol. 1990;2:501–507. doi: 10.1093/intimm/2.6.501. [DOI] [PubMed] [Google Scholar]
- 47.Cao X, Shores EW, Hu-Li J, Anver MR, Kelsall BL, Russell SM, Drago J, Noguchi M, Grinberg A, Bloom ET, Paul WE, Katz SI, Love PE, Leonard WJ. Defective lymphoid development in mice lacking expression of the common cytokine receptor γ chain. Immunity. 1995;2:223–238. doi: 10.1016/1074-7613(95)90047-0. [DOI] [PubMed] [Google Scholar]
- 48.DiSanto JP, Muller W, Guy-Grand D, Fischer A, Rajewsky K. Lymphoid development in mice with a targeted deletion of the interleukin-2 receptor γ chain. Proc Natl Acad Sci USA. 1995;92:377–381. doi: 10.1073/pnas.92.2.377. [DOI] [PMC free article] [PubMed] [Google Scholar]
- 49.Park SY, Saijo K, Takahashi T, Osawa M, Arase H, Hirayama N, Miyake K, Nakauchi H, Shirasawa T, Saito T. Developmental defects of lymphoid cells in Jak3 kinase-deficient mice. Immunity. 1995;3:771–782. doi: 10.1016/1074-7613(95)90066-7. [DOI] [PubMed] [Google Scholar]
- 50.Jiang D, Lenardo MJ, Zuniga-Pflücker JC. p53 prevents maturation to the CD4+CD8+stage of thymocyte differentiation in the absence of T cell receptor rearrangement. J Exp Med. 1996;183:1923–1928. doi: 10.1084/jem.183.4.1923. [DOI] [PMC free article] [PubMed] [Google Scholar]