

Abstract
In the cellular immune response, recognition by CTL-TCRs of viral antigens presented as peptides by HLA class I molecules, triggers destruction of the virally infected cell (Townsend, A.R.M., J. Rothbard, F.M. Gotch, G. Bahadur, D. Wraith, and A.J. McMichael. 1986. Cell. 44:959–968). Altered peptide ligands (APLs) which antagonise CTL recognition of infected cells have been reported (Jameson, S.C., F.R. Carbone, and M.J. Bevan. 1993. J. Exp. Med. 177:1541–1550). In one example, lysis of antigen presenting cells by CTLs in response to recognition of an HLA B8–restricted HIV-1 P17 (aa 24–31) epitope can be inhibited by naturally occurring variants of this peptide, which act as TCR antagonists (Klenerman, P., S. Rowland Jones, S. McAdam, J. Edwards, S. Daenke, D. Lalloo, B. Koppe, W. Rosenberg, D. Boyd, A. Edwards, P. Giangrande, R.E. Phillips, and A. McMichael. 1994. Nature (Lond.). 369:403– 407). We have characterised two CTL clones and a CTL line whose interactions with these variants of P17 (aa 24–31) exhibit a variety of responses. We have examined the high resolution crystal structures of four of these APLs in complex with HLA B8 to determine alterations in the shape, chemistry, and local flexibility of the TCR binding surface. The variant peptides cause changes in the recognition surface by three mechanisms: changes contributed directly by the peptide, effects transmitted to the exposed peptide surface, and induced effects on the exposed framework of the peptide binding groove. While the first two mechanisms frequently lead to antagonism, the third has more profound effects on TCR recognition.
Residues 24–31 (GGKKKYKL) of the HIV-1 Gag protein p17, a region overlapping the nuclear localization site (1), have been mapped as an HLA B8–restricted epitope capable of eliciting a CTL response in HIV-1 seropositive individuals (2). Variations in the genetic sequence encoding these residues have been detected in viruses isolated from patients making a CTL response to this epitope (2, 3). Our present study focuses on four peptides which are related to the index peptide (GGKKKYKL) by single residue changes corresponding to naturally occurring variant epitope sequences, each of which has occured in more than one HLA B8 positive, HIV infected patient (Table 1, denoted as 3R, 5R, 7R, and 7Q). The index and variant peptides bind HLA B8 with similar affinities in vitro (4). A number of CTL clones and lines specific for this epitope have been generated from two HIV positive donors. Fig. 1 shows data from two clones and a line demonstrating the effects that these substitutions can have in terms of recognition and antagonism. The differences between the index and the four variant HLA B8–peptide complexes have been analysed in a series of x-ray crystallographic structure determinations at 2.3 Å resolution or better. Crystallographic statistics for each of the complexes are detailed in Table 1. In line with the binding motif deduced from several epitopes and pooled peptide sequences (5), the index peptide (residues P1–P8) is anchored in the HLA B8–binding groove by buried lysine residues at peptide positions P3 and P5 and by the COOHterminal (P8 or PC) leucine residue (see Fig. 2). Conversely, the sidechains of residues P4, P7 and P6, contribute to the surface exposed for TCR recognition. The APLs thus encompass changes at residues directly exposed to TCR recognition (P7) and at buried anchor residues (P3 and P5).
Table 1.
Statistics for Crystallographic Structure Determination
| Data Set Abbreviated name | B8/GGKKKYKL Index | B8/GGKKKYRL 7R | B8/GGKKKYQL 7Q | B8/GGKKRYKL 5R | B8/GGRKKYKL 3R | |||||
|---|---|---|---|---|---|---|---|---|---|---|
| Data collection site | SRS (9.6) | SRS (9.6) | ESRF (BL 4) | ESRF (BL 4) | SRS (9.6) | |||||
| Total data collected (°) | 90.5 | 120 | 180 | 110 | 90 | |||||
| Unit cell (Å3) | 50.6 × 81.4 × 110.7 | 50.7 × 81.2 × 110.6 | 50.4 × 80.9 × 109.2 | 50.6 × 81.3 × 110.1 | 51.0 × 81.6 × 111.6 | |||||
| Resolution range (Å) | 14-2.05 | 14-2.3 | 14-2.1 | 14-2.2 | 14-2.2 | |||||
| Number of | ||||||||||
| observations | 142,749 | 119,501 | 305,517 | 140,466 | 88,881 | |||||
| Number of unique | ||||||||||
| reflections | 29,118 | 25,985 | 25,086 | 26,227 | 27,424 | |||||
| Completeness (%) | 98.5 | 97.6 | 93.7 | 96.3 | 97.7 | |||||
| I/sig(I) | 7.3 | 7.2 | 5.1 | 5.7 | 8.5 | |||||
| Rmerge (%)a | 8.3 | 8.8 | 8.6 | 7.6 | 8.9 | |||||
| R-factor (%)b | 18.1 | 17.1 | 18.4 | 18.1 | 19.5 | |||||
| Number of protein | ||||||||||
| atoms | 3,146 | 3,148 | 3,146 | 3,148 | 3,140 | |||||
| Number of water | ||||||||||
| molecules | 398 | 315 | 364 | 302 | 298 | |||||
| Rms bond length | ||||||||||
| deviation (Å) | 0.011 | 0.011 | 0.012 | 0.013 | 0.012 | |||||
| Rms bond angle | ||||||||||
| deviation (°) | 1.6 | 1.6 | 1.7 | 1.7 | 1.6 | |||||
| Average B-factor | ||||||||||
| (mainchain) (Å2) | 17.5 | 16.5 | 21.1 | 14.9 | 21.1 | |||||
| RMS Δ B (angles) | 4.0 | 4.6 | 4.7 | 4.9 | 5.0 | |||||
| RMS Δ B (bonds) | 2.7 | 3.4 | 3.1 | 3.3 | 3.4 | |||||
| A diffraction data set was collected for each complex according to the protocol described in Materials and Methods. RMS deviations from ideal values for bond lengths and angles are based on the stereochemical parameters of Engh and Huber (23). For restrained B factor refinement, RMS deviations in B factors are quoted between bond and bond-angle related atoms. aRmerge = Σ ∣ I − < I >∣ / Σ < I > × 100, bR-factor = Σ ∣ Fobs − Fcalc ∣ / Σ Fobs × 100 for each data set. | ||||||||||
Figure 1.


CTL recognition and antagonism by naturally occurring p17 variants. Recognition of variant peptides by two donor 008 clones (18 and 20) (a and b) at an ET of 8:1. (c) Inhibition of killing by clone 20, at an ET of 8:1, by the 3R and 5R variants shown to be encoded for by this provirus (5). Gag p24 (residues 261–269, GEIYKRWII) was used as a control HLA-B8 restricted peptide. (d ) Inhibition of killing by line 84, at an ET of 4:1, by 7R and 7Q. Influenza nuclear protein (residues 380–388, ELRSRYWAI) was used as a HLA B8 restricted control peptide.
Figure 2.
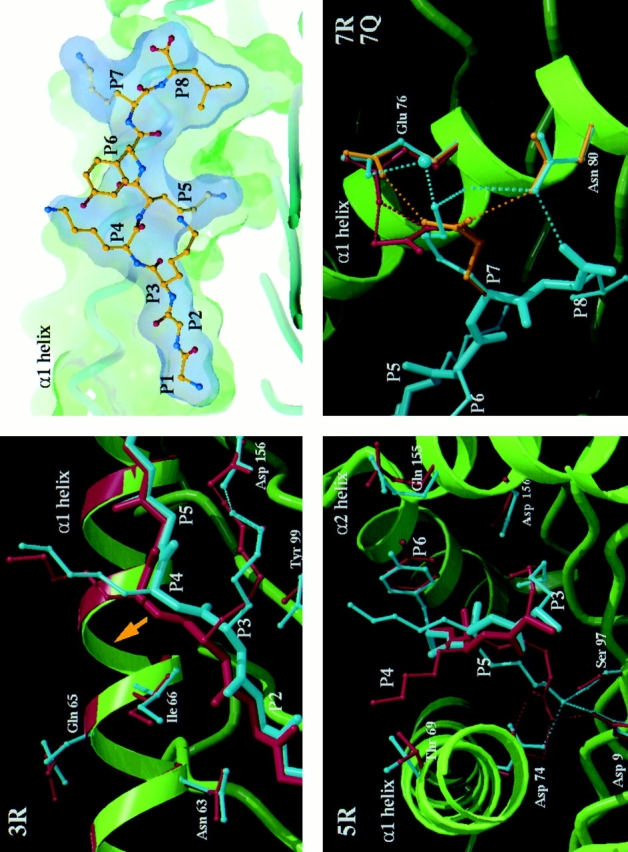
Crystal structures of the HLA B8–index and variant peptide complexes. The index peptide (P1–P8; GGKKKYKL) in the HLA B8 binding groove (top right) is viewed through the α2 helix with surface delineating the peptide volume in blue and the HLA B8 in green. The basic features of peptide binding are comparable to those observed in other MHC class I–peptide complexes (13–18, 24–33). From top left to bottom right, three close up views depict details of the differences between the index versus 3R, index versus 5R and index versus 7R plus 7Q complexes, respectively. The mainchain of the HLA B8 index complex is shown schematically in green, the peptide and representative HLA B8 sidechains in cyan, and the equivalent residues of the variant complexes are colored red in the 3R and 5R panels, red for 7R, and gold for 7Q in the joint P7 variants panel. Hydrogen bonds are depicted by appropriately colored dashed lines. In the 3R variant panel, the P5 sidechain is omitted for clarity. The most significant, concerted differences in HLA B8 mainchain positions are observed for the 3R variant (Fig. 3). The yellow arrow indicates the lateral shift in the position of the peptide backbone and consequent repositioning of a portion of the α1 helix spanning residues 61–66 (for this view, the shift is primarily into the plane of the paper). This region of the α1 helix has previously been observed to flex to accommodate different peptide binding requirements (17, 29). Direct expansion of the D pocket by movement of the α2 helix may be limited by the disulphide bond between residues 164 on the α2 helix and 101 on the floor of the binding groove. The figure was produced using programs SYBYL (Tripos Assoc., St. Louis, MO), MOLSCRIPT (34) (with modifications by R. Esnouf), and RASTER3D (35).
Materials and Methods
Antagonist Assays.
CTL lines and clones were derived and maintained from donors 008 and 84 by stimulation with the index peptide as previously described (4). Peptides were synthesized by standard Fmoc chemistry and purity checked by HPLC. Targets were either autologous or HLA matched Epstein-Barr virustransformed B cell lines pulsed with 300 μ Ci51Cr. In antagonist assays, targets were prepulsed with a suboptimal concentration (100 nM) of index peptide. Target cells (5 × 10³) were then plated into round-bottomed wells containing experimental peptide or media controls. Effector cells, media, or 5% Triton X-100 were then added to appropriate wells to a total volume of 166 μl. Supernatant (20 μl aliquots) was then sampled 4 h later to measure experimental release, spontaneous release, and maximal release. Specific lysis (SL)1 was then calculated as 100 × (experimental lysis − spontaneous release)/(maximal release − spontaneous release). Inhibition was determined as 100 × (SL without antagonist − SL with antagonist)/(SL without antagonist).
Production and Crystallization.
Production and crystallization of soluble forms of HLA B*0801–peptide complexes have been described (6). Briefly, residues 1–276 of the HLA B8 heavy chain and β2m were separately expressed in Escherichia coli and refolded in the presence of the appropriate peptide (Table 1). All the complexes crystallized in closely related unit cells (space group P212121 with one molecule per asymmetric unit; 6) facilitating a series of structure determinations. Note that for the index, 7R, 7Q, and 5R complex crystals, the peptide used for refolding was predominantly a 9 mer (with an additional P9 lysine residue). Subsequent electron density maps indicate that the crystals contained molecules bearing an 8-mer peptide, and sufficient numbers of 8-mer peptides were found, in analysis of original samples by mass spectrometry, to be consistent with selective crystallization of 8-mer complexes.
X-ray Data Collection.
For each complex, a diffraction data set was collected from a single, cryocooled crystal at the Synchrotron Radiation Source (SRS), Daresbury using a MAR-research imaging plate system (30 cm diam, λ = 0.87 Å), or at the European Synchrotron Radiation Facility (ESRF) (Grenoble, France) using a XRII/CCD detector (λ = 0.76 Å) (7). ESRF data sets were corrected for spatial distortion and nonuniformity of response over the detector system using program FIT2D (8). All data sets were auto-indexed and integrated with the program DENZO (9).
Structure Determination and Analysis.
The crystal structure determination, by molecular replacement, of HLA B8 complexed with the index peptide is detailed elsewhere (Reid, S.W., K.J. Smith, A. McMichael, J. Bell, D.I. Stuart, and E.Y. Jones, manuscript in preparation). For each variant complex, rigid-body refinement was carried out in the program X-PLOR (10) using the B8–index complex with peptide coordinates removed as an initial model. Difference Fourier maps calculated on the basis of these phases (using programs in the CCP4 suite (11)) showed unambiguous electron density for the entire peptide backbone and all peptide side chains with the exception of the P7 lysines in the 3R and 5R variants. Electron density maps were displayed and model coordinates fitted on an Evans and Sutherland (Salt Lake City, UT) ESV workstation using the interactive computer graphics program FRODO (12). Further rounds of refinement by conjugate gradient minimization, restrained temperature factor, and simulated annealing using standard X-PLOR protocols (10), interspersed with rebuilding to 2|Fo|-|Fc|φcalc maps, resulted in the current models for the complexes. A bulk solvent correction, as implemented in version 3.1 of X-PLOR (10), allowed all measured data to 2.3 Å resolution, or better, to be incorporated into the refinement and map calculations. In the final stages of refinement, ordered water molecules were added to the complexes. The final electron density maps are of high quality and omit maps confirm all the conformational changes discussed in the text including the position of the P7 lysines that were initially unclear. The mobility of these sidechains is reflected in the refined B-factors.
Results
P3 Variant.
All clones tested were highly sensitive to the arginine substitution at P3 (Fig. 1, a and b), a variant we have detected in three patients. Only one clone (4) was able to lyse targets pulsed with high concentrations of peptide. Over 40 other clones and lines from five patients were unable to recognize the 3R variant (reference 4 and data not shown). The 3R variant complex is distinguished from other B8–index and variant peptide complexes by concerted mainchain shifts in the position of portions of the α1 and α2 helices which flank the binding groove. In both index and variant complexes, the P3 anchor residue is buried in the D pocket which is situated at the α2 side of the binding groove. In HLA B8, as in other HLA class I alleles (13–18), one side of the D pocket is formed by residues Tyr-159, Leu-160, and Tyr-99 while the other side opens into the central portion of the binding groove (Reid, S.W., K.J. Smith, A. McMichael, J. Bell, D.I. Stuart, and E.Y. Jones, manuscript in preparation). This open pocket allows the P3 lysine residue of the index peptide to hydrogen bond to residue Asp-156. The shifts in HLA and peptide mainchain positions between index and variant are triggered by the steric requirements of accommodating the larger P3 arginine residue in place of the index lysine while conserving this hydrogen bond (Figs. 2 and 3). The orientations and mobilities (as judged by crystallographic B-factors) of exposed peptide and HLA sidechains are similar in the two complexes. The major differences in the surface exposed to TCR recognition are therefore the mainchain shifts in the peptide (0.4, 0.6, 1.1, and 0.8 Å for residues P1–P4 Cα positions) and flanking helices (0.4–0.5 Å for residues 61–66, 0.5 Å for residues 159, 162, and 163 Cα positions). These small changes produce the dramatic alterations in recognition by CTLs.
Figure 3.

Mainchain structural differences between index and variant complexes. Ribbon representations of the index complex are coloured according to differences in pairwise Cα superpositions of index and variant complex HLA B8 α1 and α2 domains plus peptide (188 structurally equivalent residues). Regions colored green show the least variation in Cα position (⩽0.2 Å) while those in red correspond to changes of ⩾0.5 Å. (a) The 3R variant complex (overall RMS deviation 0.23 Å). (b) The 5R variant complex (overall RMS deviation 0.26 Å). (c) The 7R variant complex (overall RMS deviation 0.1 Å). (d) The 7Q variant complex (overall RMS deviation 0.1 Å). From these comparisons we estimate that the likely positional errors on main atom coordinates in all of these structures is less than 0.2 Å. The peptide mainchain position is significantly altered for the 3R variant over residues P1–P4 (0.4–1.1 Å) and residues P3–P5 for the 5R variant (0.4–0.8 Å). For the HLA B8 residues, significant concerted shifts (0.4-0.5 Å) are observed for residues 61–66 of the α1 helix in the 3R variant complex. Changes also occur at residues 159, 162, and 163 of the α2 helix (0.5 Å). For 5R, changes occur at residues 154, 155, and 163 of the α2 helix (0.4–0.5 Å). Figures were produced using programs MOLSCRIPT (34) (with modifications by R. Esnouf ) and RASTER3D (35). Structural superpositions were made using the program SHP (36).
P5 Variant.
Recognition of the 5R complex varied considerably between clones. This variant acted as an antagonist towards clone 20 (Fig. 1 c) while clone 18 failed to distinguish it from the index peptide (Fig. 1 a). The 5R variant again represents a change of an anchor residue. The sidechain of the index P5 lysine is deeply buried in the distinctive C pocket of HLA B8 (Fig. 2 and Reid, S.W., K.J. Smith, A. McMichael, J. Bell, D.I. Stuart, and E.Y. Jones, manuscript in preparation) hydrogen bonding a triad of residues (Asp 9, Asp 74, and Ser 97) at the base of the binding groove. The arginine residue in the 5R variant complex also binds within this pocket, maintaining a comparable hydrogen bond network, but the differences in size and hydrogen bonding geometry of arginine and lysine necessitate an alteration in the direction of the P5 Cα-Cβ bond of some 26° (Fig. 2). This is simply accomplished by a distortion of the P4–P5 peptide mainchain, and the resultant perturbations at the surface of the complex are limited primarily to an altered orientation of the exposed P4 sidechain (Fig. 2).
P7 Variant.
The 7R and 7Q variants represent altered peptide ligands (APLs) with changes at a residue which is potentially able to interact directly with a TCR. This leads to abolished functional recognition by clones 18, 20, and the donor 84 line. The TCRs from line 84 specifically interact with these variants, both of which act as potent antagonists (Fig. 1 d ). In the index complex, the lysine sidechain of the P7 residue is fully exposed to solvent and relatively mobile, the sidechain amide interacts indirectly with other protein groups via a water mediated, hydrogen bond network to the sidechains of HLA residues glutamic acid 76 and asparagine 80 on the α1 helix (Fig. 2 ). In contrast, for both 7R and 7Q variants, the P7 sidechain is tethered by two direct hydrogen bonds to one or both of these α1 sidechains: the 7R arginine via two of its guanadinium NH groups to glutamic acid 76, and the 7Q glutamine to both glutamic acid 76 and asparagine 80. Thus, in addition to direct changes in charge and shape at the P7 sidechain position, the mobility of sidechains in this portion of the surface is altered between index and variant complexes.
Discussion
There are a range of conceivable mechanisms by which minor changes in the sequence of the peptide could affect TCR recognition, from localized surface perturbations of amino acid sidechains to concerted mainchain shifts in the MHC class I–peptide complex. Our analysis of the structural differences between HLA complexes for a series of APLs demonstrates that subtle local changes are sufficient to affect TCR recognition. The 7Q and 7R variants, which retain some form of specific recognition for many CTL clones are, somewhat surprisingly, the only variants that show chemical differences in the residues directly exposed to the TCR. In this case, however, the surface perturbations are localized and restricted to sidechain atoms (Figs. 2 and 3). Conversely, amino acid changes at anchor residues, which result in indirect perturbation of surface characteristics, can have more potent effects. Such effects clearly do not imply that the residue concerned directly contacts the TCR, as sometimes assumed. The simple difference in orientation of the P4 residue in the 5R variant appears sufficient to abolish recognition for one CTL clone, but does not alter recognition by the second. The effect of the subtle, but more extensive perturbation in the 3R variant (Fig. 3) appears much more drastic in that recognition is abolished for virtually all CTLs. In contrast to the other variants, the 3R changes are predominantly to mainchain atoms. An explanation of these results could be that sidechains in the contact surface of the 7Q, 7R, and 5R variants may be remolded during the binding of the TCR. Indeed, altered rigidity of a portion of the surface could lead to the change in recognition of the 7Q and 7R variants. The 3R variant produces the most extreme effect on TCR recognition by subtle, but extensive and irreversible (Fig. 3), alterations in the positions of mainchain atoms.
The changes seen are consistent with the hypothesis that altered peptide ligands produce antagonism by very small changes, mainly in sidechains which modulate the interaction with the TCR, possibly leading to an increased offrate. Conversely, such subtle changes in the surface of the MHC class I–peptide complex appear unlikely to change the geometry of the interaction with the TCR. Thus, these data favor the altered avidity model for antagonism (for review see reference 19). Indeed, increased TCR off-rates for antagonist peptide–MHC class II complexes have recently been reported (20). The more extensive conformational changes, including MHC mainchain movements seen with the 3R variant, tend to abolish recognition. This result indicates a direct role for regions of the HLA molecule flanking the peptide in TCR recognition. The combination of our findings with those of Lyons et al. (20) clearly favors the models for antagonism whereby the T cell signaling process could amplify affinity differences between agonist and antagonist MHC–peptide complexes (21, 22)
Acknowledgments
We thank M. Pitkeathly and S. Shah for peptide synthesis, T. Willis for protein sequencing and amino acid analysis, C. Robinson for mass spectrometry, E. Garman for help with crystal freezing conditions, the staff at the Synchrotron Radiation Source Daresbury and the European Synchrotron Radiation Facility and European Molecular Biology Laboratory outstation Grenoble for help with x-ray data collection, R. Bryan and R. Esnouf for computing facilities and computer software and S. Lee for help with the preparation of figures. Atomic coordinates for the HLA B8/p17 index and variant peptide complexes have been deposited with the Protein Data Bank, Brookhaven National Laboratory, USA. Prerelease coordinates are available from S.W. Reid or E.Y. Jones; e-mail addresses SCOTT@ BIOP.OX.AC.UK. and YVON@BIOP.OX.AC.UK.
Footnotes
This work was supported by the Medical Research Council (MRC) and the Wellcome Trust. The Oxford Centre for Molecular Sciences is supported by the Biotechnology and Biological Sciences Research Council and MRC. E.Y. Jones is supported by the Royal Society, A.J. McMichael and D.I. Stuart by the MRC.
1 Abbreviations used in this paper: APL, altered peptide ligand; SL, specific lysis.
References
- 1.Bukrinsky MI, Haggerty S, Dempsey MP, Sharova N, Adzhubel A, Spitz L, Lewis P, Goldfarb D, Emerman M, Stevenson M. A nuclear localization signal within HIV-1 matrix protein that governs infection of non-dividing cell. Nature (Lond) 1993;365:666–669. doi: 10.1038/365666a0. [DOI] [PMC free article] [PubMed] [Google Scholar]
- 2.Phillips RE, Rowland-Jones S, Nixon DF, Gotch FM, Edwards JP, Ogunlesi AO, Elvin JG, Rothbard JA, Bangham CR, Rizza CR, et al. Human immunodeficiency virus genetic variation that can escape cytotoxic T cell recognition. Nature (Lond) 1991;354:453–459. doi: 10.1038/354453a0. [DOI] [PubMed] [Google Scholar]
- 3.Nowak MA, May RM, Phillips RE, Rowland-Jones S, Lalloo DG, McAdam S, Klenerman P, Koppe B, Sigmund K, Bangham CR, et al. Antigenic oscillations and shifting immunodominance in HIV-1 infections. Nature (Lond) 1995;375:606–611. doi: 10.1038/375606a0. [DOI] [PubMed] [Google Scholar]
- 4.McAdam S, Klenerman P, Tussey L, Rowland-Jones S, Lalloo D, Phillips R, Edwards A, Giangrande P, Brown AL, Gotch F, et al. Immunogenic HIV variant peptides that bind to HLA-B8 can fail to stimulate cytotoxic T lymphocyte responses. J Immunol. 1995;155:2729–2736. [PubMed] [Google Scholar]
- 5.Sutton J, Rowland-Jones S, Rosenberg W, Nixon D, Gotch F, Gao X-M, Murray N, Spoonas A, Driscoll P, Smith M, Willis A, McMichael A. A sequence pattern for peptides presented to cytotoxic T lymphocytes by HLA B8 Revealed by analysis of epitopes and eluted peptides. Eur J Immunol. 1993;23:447–453. doi: 10.1002/eji.1830230222. [DOI] [PubMed] [Google Scholar]
- 6.Reid SW, Smith KJ, Jakobsen BK, O'Callaghan CA, Reyburn H, Harlos K, Stuart DI, McMichael A, Bell J, Jones EY. Production and crystallization of MHC class I B allele single peptide complexes. FEBS Lett. 1996;383:119–123. doi: 10.1016/0014-5793(96)00226-8. [DOI] [PubMed] [Google Scholar]
- 7.Moy J-P. A 200 mm input field, 5–80 keV detector based on and X-ray image intensifier and CCD camera. Nucl Instr Meth. 1994;A348:641–644. [Google Scholar]
- 8.Hammersley AP, Svensson SO, Thompson A. Calibration and correction of spatial distortions in 2D detector systems. Nucl Instr Meth. 1994;A346:312–321. [Google Scholar]
- 9.Otwinowski, Z. 1993. Oscillation data reduction program. In Data Collection and Processing. L. Sawyer, N. Isaacs, and S. Bailey, editors. Daresbury Laboratory, Warrington, UK. 55–62.
- 10.Brunger, A. 1992. A system for X-ray crystallography and NMR. In X-PLOR version 3.1. Yale University Press, New Haven, CT.
- 11.CCP4. The CCP4 Suite: programs for protein crystallography. Acta Crystallog Sect D Biol Crystallog. 1994;50:760–763. doi: 10.1107/S0907444994003112. [DOI] [PubMed] [Google Scholar]
- 12.Jones A. Interactive computer graphics: FRODO. Methods Enzymol. 1985;115:157–171. doi: 10.1016/0076-6879(85)15014-7. [DOI] [PubMed] [Google Scholar]
- 13.Saper MA, Bjorkman PJ, Wiley DC. Refined structure of the human histocompatibility antigen HLA-2 at 2.6 A resolution. J Mol Biol. 1991;219:277–319. doi: 10.1016/0022-2836(91)90567-p. [DOI] [PubMed] [Google Scholar]
- 14.Madden DR, Gorga JC, Strominger JL, Wiley DC. The three-dimensional structure of HLA-B27 at 2.1A resolution suggests a general mechanism for tight peptide binding to MHC. Cell. 1992;70:1035–1048. doi: 10.1016/0092-8674(92)90252-8. [DOI] [PubMed] [Google Scholar]
- 15.Silver ML, Guo H-C, Strominger JL, Wiley DC. Atomic structure of a human MHC molecule presenting an influenza virus peptide. Nature (Lond) 1992;360:367–369. doi: 10.1038/360367a0. [DOI] [PubMed] [Google Scholar]
- 16.Madden D, Garboczi D, Wiley D. The antigenic identity of peptide/MHC complexes: a comparison of the conformations of five peptides presented by HLA-2. Cell. 1993;75:693. doi: 10.1016/0092-8674(93)90490-h. [DOI] [PubMed] [Google Scholar]
- 17.Smith KJ, Reid SW, Harlos K, McMichael A, Stuart DI, Bell J, Jones EY. Bound water structure and polymorphic amino acids act together to allow the binding of different peptides to MHC class I HLA B53. Immunity. 1996;4:215–228. doi: 10.1016/s1074-7613(00)80430-6. [DOI] [PubMed] [Google Scholar]
- 18.Smith KJ, Reid SW, Stuart DI, McMichael A, Jones EY, Bell J. An altered position of the alpha 2 helix of MHC class I is revealed by the crystal structure of HLA B*3501. Immunity. 1996;4:203–213. doi: 10.1016/s1074-7613(00)80429-x. [DOI] [PubMed] [Google Scholar]
- 19.Jameson SC, Bevan MJ. T cell receptor antagonists and partial agonists. Immunity. 1995;2:1–11. doi: 10.1016/1074-7613(95)90074-8. [DOI] [PubMed] [Google Scholar]
- 20.Lyons DS, Lieberman SA, Hampl J, Boniface JJ, Chien Y-H, Berg LJ, Davis MM. A TCR binds to antagonist ligands with lower affinities and faster dissociation rates than to agonists. Immunity. 1996;5:53–61. doi: 10.1016/s1074-7613(00)80309-x. [DOI] [PubMed] [Google Scholar]
- 21.McKeithan T. Kinetic proofreading in T-cell receptor signal transduction. Proc Natl Acad Sci USA. 1995;92:5042–5046. doi: 10.1073/pnas.92.11.5042. [DOI] [PMC free article] [PubMed] [Google Scholar]
- 22.Rabinowitz JD, Beeson C, Lyons DS, Davis MM, McConnell HM. Kinetic discrimination in T-cell activation. Proc Natl Acad Sci USA. 1996;93:1401–1405. doi: 10.1073/pnas.93.4.1401. [DOI] [PMC free article] [PubMed] [Google Scholar]
- 23.Engh RA, Huber R. Accurate bond and angle parameters for X-ray protein-structure refinement. Acta Crystallog. 1991;A47:392–400. [Google Scholar]
- 24.Bjorkman PL, Saper MA, Samraoui B, Bennett WS, Strominger JL, Wiley DC. The foreign antigen binding site and T cell recognition regions of class I histocompatability antigens. Nature (Lond) 1987;329:512–518. doi: 10.1038/329512a0. [DOI] [PubMed] [Google Scholar]
- 25.Bjorkman PJ, Saper MA, Samraoui B, Bennett WS, Strominger JL, Wiley DC. Structure of the human class I histocompatability antigen, HLA-A2. Nature (Lond) 1987;329:506–512. doi: 10.1038/329506a0. [DOI] [PubMed] [Google Scholar]
- 26.Garret TPJ, Saper MA, Bjorkman PJ, Strominger JL, Wiley DC. Specificity pockets for the side chains of peptide antigens in HLA-Aw68. Nature (Lond) 1989;342:692–696. doi: 10.1038/342692a0. [DOI] [PubMed] [Google Scholar]
- 27.Madden DR, Gorga JC, Strominger JL, Wiley DC. The structure of HLA-B27 reveals nonamer self-peptides bound in an extended confirmation. Nature (Lond) 1991;353:321–325. doi: 10.1038/353321a0. [DOI] [PubMed] [Google Scholar]
- 28.Zhang W, Young AC, Imarai M, Nathenson SG, Sacchettini JC. Crystal structure of the major histocompatibility complex class I H-2Kb molecule containing a single viral peptide: implications for peptide binding and T-cell receptor recognition. Proc Natl Acad Sci USA. 1992;89:8403–8407. doi: 10.1073/pnas.89.17.8403. [DOI] [PMC free article] [PubMed] [Google Scholar]
- 29.Fremont DH, Matsumura M, Stura EA, Peterson PA, Wilson IA. Crystal structures of two viral peptides in complex with murine MHC class I H-2Kb. Science (Wash DC) 1992;257:919–927. doi: 10.1126/science.1323877. [DOI] [PubMed] [Google Scholar]
- 30.Matsumura M, Fremont DH, Peterson PA, Wilson IA. Emerging principles for the recognition of peptide antigens by MHC class I molecules. Science (Wash DC) 1992;257:927–934. doi: 10.1126/science.1323878. [DOI] [PubMed] [Google Scholar]
- 31.Guo H-C, Jardetzky TS, Garrett TPL, Lane WS, Strominger JL, Wiley DC. Different length peptides bind to HLA-Aw68 similarly at their ends but bulge out in the middle. Nature (Lond) 1992;360:364–366. doi: 10.1038/360364a0. [DOI] [PubMed] [Google Scholar]
- 32.Young ACM, Zhang W, Sacchettini JC, Nathenson SG. The three-dimensional structure of H-2Db at 2.4A resolution: implications for antigen-determinant selection. Cell. 1994;76:39–50. doi: 10.1016/0092-8674(94)90171-6. [DOI] [PubMed] [Google Scholar]
- 33.Fremont D, Stura E, Matsumura M, Peterson P, Wilson I. Crystal structure of an H-2Kb-ovalbumin petide complex reveals the interplay of primary and secondary anchor positions in the major histocompatibility complex binding groove. Proc Natl Acad Sci USA. 1995;92:2479–2483. doi: 10.1073/pnas.92.7.2479. [DOI] [PMC free article] [PubMed] [Google Scholar]
- 34.Kraulis PJ. MOLSCRIPT: a program to produce both detailed and schematic plots of protein structures. J Appl Crystallography. 1991;24:946–950. [Google Scholar]
- 35.Merritt EA, Murphy MEP. Raster 3D version 2.0. A program for photorealistic molecular graphics. Acta Crystallog Sec D Biol Crystallog. 1994;D50:869–873. doi: 10.1107/S0907444994006396. [DOI] [PubMed] [Google Scholar]
- 36.Stuart DI, Levine M, Muirhead M, Stammers D. The crystal structure of cat pyruvate kinase at a resolution of 2.6A. J Mol Biol. 1979;134:109–142. doi: 10.1016/0022-2836(79)90416-9. [DOI] [PubMed] [Google Scholar]