Abstract
Bullous pemphigoid antigen 1 (BPAG1) is a member of the plakin family with cytoskeletal linker properties. Mutations in BPAG1 cause sensory neuron degeneration and skin fragility in mice. We have analyzed the BPAG1 locus in detail and found that it encodes different interaction domains that are combined in tissue-specific manners. These domains include an actin-binding domain (ABD), a plakin domain, a coiled coil (CC) rod domain, two different potential intermediate filament–binding domains (IFBDs), a spectrin repeat (SR)-containing rod domain, and a microtubule-binding domain (MTBD). There are at least three major forms of BPAG1: BPAG1-e (302 kD), BPAG1-a (615 kD), and BPAG1-b (834 kD). BPAG1-e has been described previously and consists of the plakin domain, the CC rod domain, and the first IFBD. It is the primary epidermal BPAG1 isoform, and its absence that is the likely cause of skin fragility in mutant mice. BPAG1-a is the major isoform in the nervous system and a homologue of the microtubule actin cross-linking factor, MACF. BPAG1-a is composed of the ABD, the plakin domain, the SR-containing rod domain, and the MTBD. The absence of BPAG1-a is the likely cause of sensory neurodegeneration in mutant mice. BPAG1-b is highly expressed in muscles, and has extra exons encoding a second IFBD between the plakin and SR-containing rod domains of BPAG1-a.
Keywords: intermediate filaments; actin; microfilaments; microtubules; plakin
Introduction
Bullous pemphigoid antigen 1 (BPAG1)* is a member of the plakin family with cytoskeletal linker properties (Ruhrberg and Watt, 1997). The epidermal isoform of BPAG1 (BPAG1-e) is made up of a coiled coil (CC) rod domain flanked by globular NH2-terminal head and COOH-terminal tail domains. The NH2-terminal head domain is homologous to that of other plakin family members and is called the plakin domain. The COOH terminus consists of two homologous repeats and has been proposed to be an intermediate filament (IF)-binding domain (IFBD). BPAG1-e links hemidesmosomes to keratin filaments. Interestingly, mutations of the BPAG1 gene result in sensory neuron degeneration in the mutant mouse, dystonia musculorum (dt) (Brown et al., 1995). Three neuronal isoforms of BPAG1 (BPAG1-n or dystonin) with different NH2-terminal sequences have been reported (Brown et al., 1995; Guo et al., 1995; Yang et al., 1999). These neuronal isoforms consist of an actin-binding domain (ABD) that is made up of one or two calponin homology subdomains, a plakin domain, a CC rod domain, and an IFBD. The IFBD can interact with neuronal IFs (Yang et al., 1996; Leung et al., 1999a).
Microtubule (MT) actin cross-linking factor (MACF) is a divergent member of the plakin family (Leung et al., 1999b). At its NH2 terminus, MACF exhibits high homology to the NH2 terminus of BPAG1-n, including the ABD and the plakin domain. However, MACF does not contain a CC rod domain or an IFBD. Instead, MACF bears a 23 spectrin repeat (SR)-containing rod domain and a novel COOH-terminal MT-binding domain (MTBD). Recently, we characterized the COOH-terminal portion of a protein (MACF2) that is highly homologous to the MTBD of MACF (Sun et al., 2001). In this report, we describe a detailed characterization of the BPAG1 locus and the alternatively spliced isoforms of BPAG1 in mice. We found that MACF2 is structurally similar to MACF, and that it is an alternatively spliced form of the BPAG1 gene; hence, we renamed it BPAG1-a. BPAG1-a appears to be the predominant form of BPAG1 expressed in the nervous system. In striated muscle we discovered another BPAG1 isoform that possesses a putative novel IFBD in the center of the molecule, and we named this isoform BPAG1-b.
Results and discussion
Molecular cloning of BPAG1 isoforms
We cloned cDNAs of MACF2 by nested PCR. By sequentially performing PCR on a mouse brain cDNA library with primers specific for four EST clones (GenBank/EMBL/DDBJ accession no. AI526522, AA668029, AA765549, and AI058268) and for the end sequences of the previously amplified PCR products, we obtained three consecutively overlapping cDNAs that spanned ∼9.7 kb of the 3′ coding region of mouse MACF2. The 5′ portion of this composite MACF2 cDNA displayed significant sequence homology to a human genomic bacterial artificial chromosome clone, RP1-61B2 (GenBank/EMBL/DDBJ accession no. AL096710). This bacterial artificial chromosome clone was arbitrarily divided into three segments: the first segment included most of the exons of the BPAG1 gene; the second segment contained a putative exon with an ∼5-kb ORF; and the third segment was made up of many small exons that encoded the SRs of MACF2 (Fig. 1 A).
Figure 1.
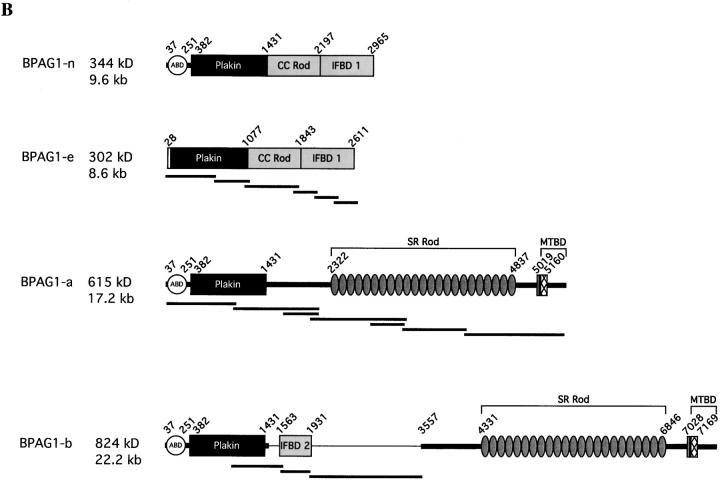
The genomic structure of BPAG1 and the predicted architecture of BPAG1 isoforms. (A) The structure of the 5′ portion of BPAG1 gene is illustrated. The putative promoters are indicated by arrows. The plakin domain is encoded by 21 exons (black), whereas the CC rod domain and the IFBD1 are each coded by a single exon (light gray). The dark gray boxes represent exons specific for BPAG1-b that contain the IFBD2. Exons and cDNA (hatched boxes) that harbor a stop codon are marked. (B) Schematic representation of the domain structure of BPAG1 isoforms. The names of BPAG1 isoforms, their predicted molecular masses, and the length of their composite cDNAs are indicated. Bold lines underneath the schematic protein drawings represent nested PCR products. The names of individual domains are indicated, except for the EF-hand calcium binding motifs (small gray boxes) and the MT-binding Gas-2–related domain (hatched boxes). The numbers of the amino acids that mark the boundaries of each domain are also shown.
By library screening and genomic PCR, we obtained mouse genomic clones that were equivalent to this human locus. An ∼5-kb ORF-containing exon was located ∼4 kb downstream of the “last” exon of mouse BPAG1, and ∼3 kb upstream of a predicted exon of MACF2. Although the last exon of BPAG1 contained an in frame stop codon and a polyadenylation signal, the proximity of the predicted ∼5-kb ORF-containing exon and the lack of an in frame translation start codon common to humans and mice indicated that MACF2 was an alternatively spliced product of the BPAG1 gene. To dissect the potential alternatively spliced transcripts we performed Northern blots with probes against different domains of BPAG1 and MACF2 (described in a later section). We found that MACF2 was an alternatively spliced isoform of BPAG1, hence, we renamed it BPAG1-a. Using these Northern blot results we performed PCR on cDNAs prepared from appropriate tissues and identified three major transcripts of BPAG1: BPAG1-e, BPAG1-a, and BPAG1-b (Fig. 1 B).
Sequence analysis of BPAG1 isoforms
The composite BPAG1-a cDNA is ∼17.2 kb (GenBank/EMBL/DDBJ accession no. AF396878) and encodes a 615-kD protein (Fig. S1 A). The domain structure of BPAG1-a is similar to that of MACF (Fig. 1 B). The ABD and plakin domains of BPAG1-a are identical to those reported for BPAG1-n (Yang et al., 1996). However, the rod domain of BPAG1-a is made up of 23 SRs (Fig. 1 B). BPAG1-a contains two EF-hand motifs and an MTBD at its COOH terminus (Sun et al., 2001). The primary sequences of MACF and BPAG1-a share a 52% identity and a 70% homology, suggesting that they originated from the same ancestral gene. Most of the homologies are located at the NH2 and COOH termini, whereas the sequences of the SRs are more divergent.
The composite BPAG1-b cDNA is ∼23.2 kb (GenBank/EMBL/DDBJ accession no. AF396879) and codes for an 834-kD protein (Fig. S1 B). The transcript of BPAG1-b is identical to that of BPAG1-a except that it has four additional exons in the middle of the molecule, including the ∼5-kb ORF-containing exon that was found in our genomic clone (Fig. 1 A). Part of the deduced amino acid sequence of the ∼5-kb ORF exhibits significant homology to the IFBD of BPAG1-e (Fig. 2) ; hence, we designated this domain as IFBD2 and the COOH-terminal domain of BPAG1-e/n as IFBD1. In contrast to IFBD1 which contains two repeats, IFBD2 harbors only one repeat. Aside from the IFBD2, the extra sequences of BPAG1-b do not show significant homology to other proteins. The composite cDNA of mouse BPAG1-e was ∼9.0 kb (GenBank/EMBL/DDBJ accession no. AF396877) and encoded a 302-kD protein (Fig. S1 C). The protein structure of mouse BPAG1-e is similar to its human orthologue (Sawamura et al., 1991).
Figure 2.
Primary sequences of mouse BPAG1 isoforms and comparison of the IFBDs. The IFBD of BPAG1-b (IFBD2; amino acids 1563–1931 of BPAG1-b) is compared with the IFBD of BPAG1-e (IFBD1; amino acids 2184–2598 of BPAG1-e). Identical amino acids are shaded in black with white letters, whereas the conserved amino acid changes are shaded in gray.
Expression patterns of BPAG1 isoforms
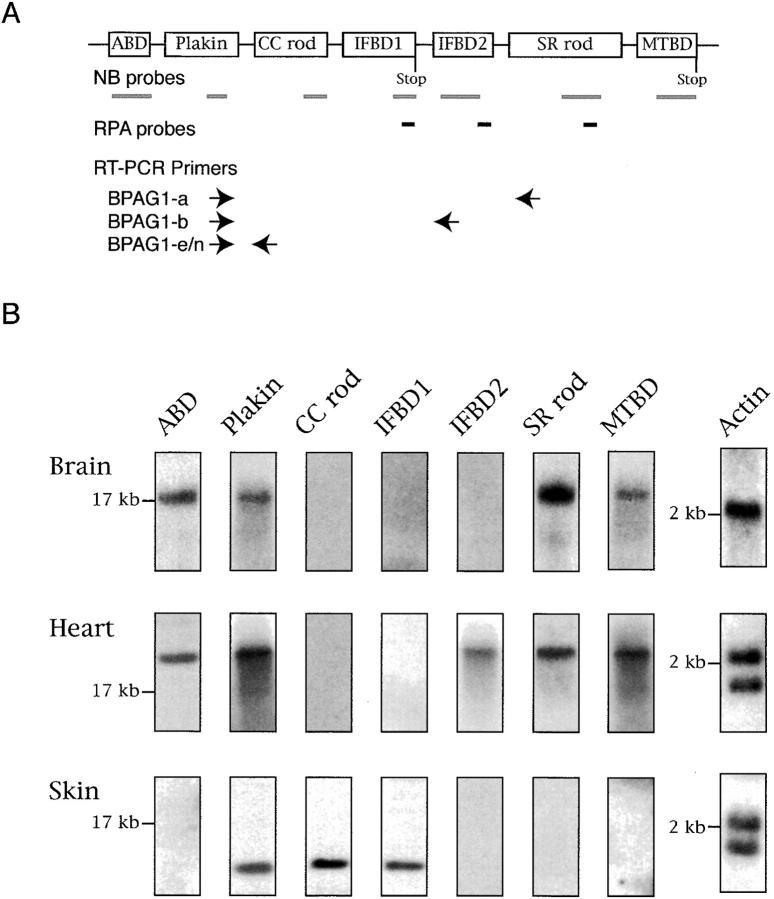
We prepared probes against different domains of BPAG1 isoforms for Northern blot analysis. Three different hybridization patterns were obtained: the pattern in the brain was identical to the spinal cord, the pattern in the heart was identical to the skeletal muscles, and the pattern in the skin was unique. BPAG1-a mRNA was the only BPAG1 mRNA detected in the brain and the spinal cord (Fig. 3 B and unpublished data). Probes specific for the CC rod domain and IFBD1 failed to recognize any mRNAs in the brain and spinal cord, indicating that BPAG1-n is not a major isoform in the central nervous system. The previously reported BPAG1-n mRNAs in the nervous system are likely due to crosshybridization of BPAG1-a with the BPAG1-n probes, as the probes used in these studies were against the ABD and the plakin domain, common to BPAG1-a and BPAG1-n (Bernier et al., 1995a, 1995b, 1998; Brown et al., 1995; Yang et al., 1996; Dalpe et al., 1998). In the heart, BPAG1-b was the predominant BPAG1 isoform. The mRNA of BPAG1-b was labeled with the IFBD2 probe and was larger than the mRNA of BPAG1-a (Fig. 3 B). These results are consistent with previous studies that showed a larger BPAG1 message in skeletal muscles and the heart with probes specific for the 5′ portions of BPAG1-n (Bernier et al., 1995b; Dalpe et al., 1999). Also in agreement with other studies (Yang et al., 1996; Dalpe et al., 1998), the shorter BPAG1-e transcripts were detected in the skin.
Figure 3.
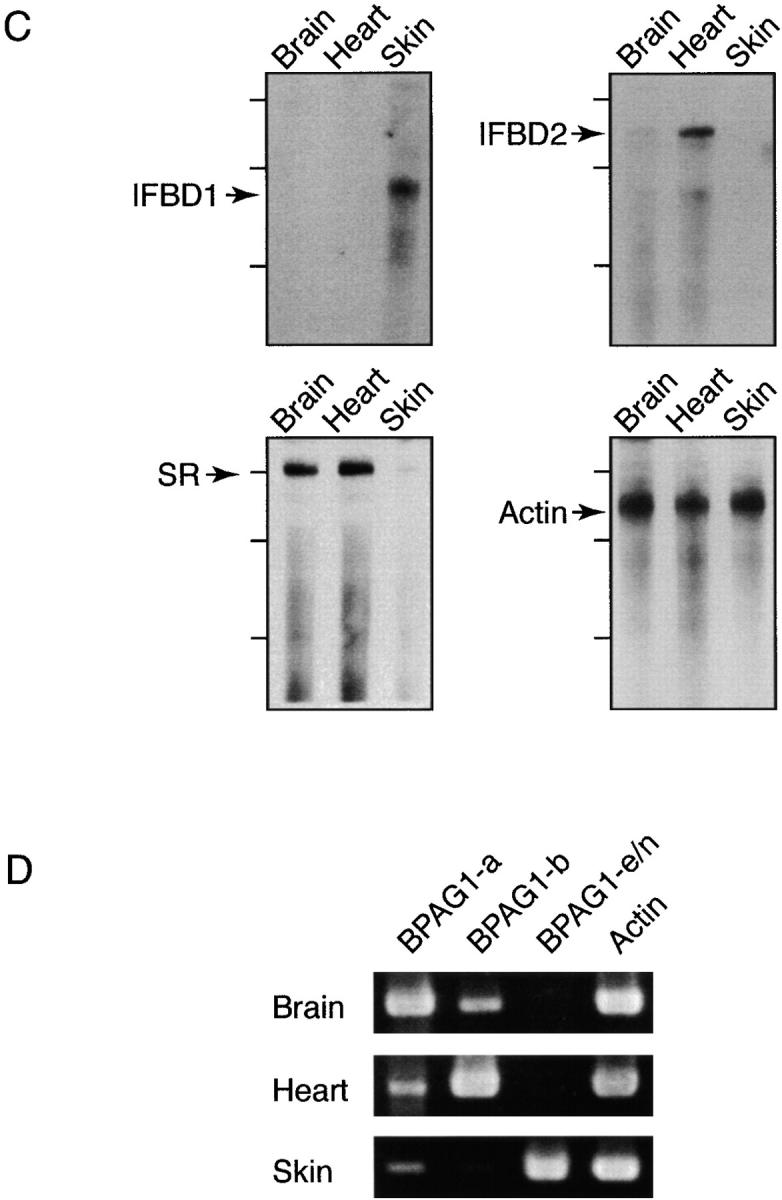
Analyses of BPAG1 mRNAs. (A) A schematic diagram showing the structure of the BPAG1 gene. Bold gray lines underneath individual domains represent the probes used for Northern blot (NB) analysis and in situ hybridizations. The positions of riboprobes (bold lines in black) used for RPA and oligonucleotide primers (arrows) used for RT-PCR analyses are illustrated. The names of the riboprobes corresponded to the BPAG1 structural domains that the riboprobes recognized. The primer sets were named after the BPAG1 isoforms that they amplified. (B) Northern blot analysis of BPAG1 isoforms. The positions of the 17-kb brain MACF mRNA and the 2-kb RNA standard are marked. The β-actin probe also detected other actin isoforms. (C) RPA analysis of BPAG1 isoforms. BPAG1 isoforms that contained the IFBD1 domain were only detected in skin. BPAG1-b transcripts that could be protected by IFBD2 probe were found in large amounts in the heart and small amounts in the brain. The SR-containing rod domain probe that protected both BPAG1-a and BPAG1-b mRNAs gave strong signals in brain and heart and weak signals in skin. Marker standards (100, 200, and 300 bp) are indicated on the left of each panel. (D) RT-PCR analyses of BPAG1 isoforms. The highest amounts of BPAG1-a and BPAG1-b were observed in brain and heart, respectively. BPAG1-e mRNAs were only found in the skin, whereas no BPAG1-e/n mRNAs were detected in the brain or the heart with these RT-PCR settings.
To detect less abundant mRNAs, we performed ribonuclease protection assays (RPAs) and reverse transcriptase (RT)-PCR experiments (Fig. 3 C). Using a riboprobe specific for IFBD1 common to BPAG1-e and BPAG1-n (Fig. 1 B), we obtained signals only from the skin, indicating that BPAG1-n could not be detected in the brain and the heart by RPA. In contrast, the IFBD2 riboprobe detected high levels of BPAG1-b mRNAs in the heart and low levels in the brain. The SR rod domain riboprobe, which does not distinguish BPAG1-a from BPAG1-b, detected strong signals from the brain and the heart, and a weak signal from the skin. The major structural differences between BPAG1-a, BPAG1-b, and BPAG1-e (or BPAG1-n) are in the regions following the plakin domain: BPAG1-a contains the SR rod domain, BPAG1-b contains IFBD2, and BPAG1-e (and BPAG1-n) contains the CC rod domain (Fig. 1 B). We used three sets of PCR primers to distinguish these isoforms. The forward primers were designed against the plakin domain, and the reverse primers were specific for the SR rod domain, IFBD2, and CC rod domain (Fig. 3 A). All PCR products, including the β-actin control, were ∼500 bp in length. As shown in Fig. 3 D, BPAG1-a was the most abundant isoform in the brain, although BPAG1-b was also present. In contrast, the heart contained higher amounts of BPAG1-b than BPAG1-a. In the heart and brain, no BPAG1-n (or BPAG1-e) mRNA was detected under these PCR conditions. High levels of BPAG1-e mRNA were found in the skin, where BPAG1-a and BPAG1-b mRNAs were also present in lower amounts. In an attempt to detect trace amounts of BPAG1-n mRNA in the brain, we performed 35 cycles of PCR using the BPAG1-e/n primer set and obtained a weak signal (unpublished data), implying that small amounts of BPAG1-n (or BPAG1-e) are present in the brain.
To extend our studies on the distribution of BPAG1 isoforms during development, we used probes corresponding to various domains of BPAG1 for in situ hybridization analysis on mouse embryonic day E14.5 embryos. The hybridization patterns of probes against the CC rod domain and IFBD1 were identical, as both labeled the epidermis and mucosal epithelia along the digestive tract (Fig. 4 A and unpublished data). These probes gave no signal in the nervous system, confirming that the BPAG1-n isoforms were not expressed in detectable quantities. The IFBD2 probe specifically labeled BPAG1-b mRNA in myocardium, skeletal muscle masses, vertebrae cartilage, and epithelia of the tongue (Fig. 4 B). More ubiquitous labeling patterns were observed with probes prepared for the ABD, plakin domain, SR-containing rod domain, and MTBD that would label BPAG1-a and BPAG1-b (Fig. 4 C and unpublished data). Strong signals were found with these probes in nervous tissues, especially at the pituitary primordium, the cranial ganglia, and the dorsal root ganglia (DRG). To determine the major form of BPAG1 expressed in the DRG, we hybridized a series of adjacent transverse sections with probes against various domains. Hybridization signals were obtained only with probes against the ABD, plakin domain, SR-containing rod domain, and MTBD, but not with the CC rod domain, IFBD1, and IFBD2 probes. These results demonstrated that BPAG1-e, BPAG1-n, and BPAG1-b are not expressed in high quantities in the DRG, and that the major form there is BPAG1-a (Fig. 4, D–F, and unpublished data).
Figure 4.
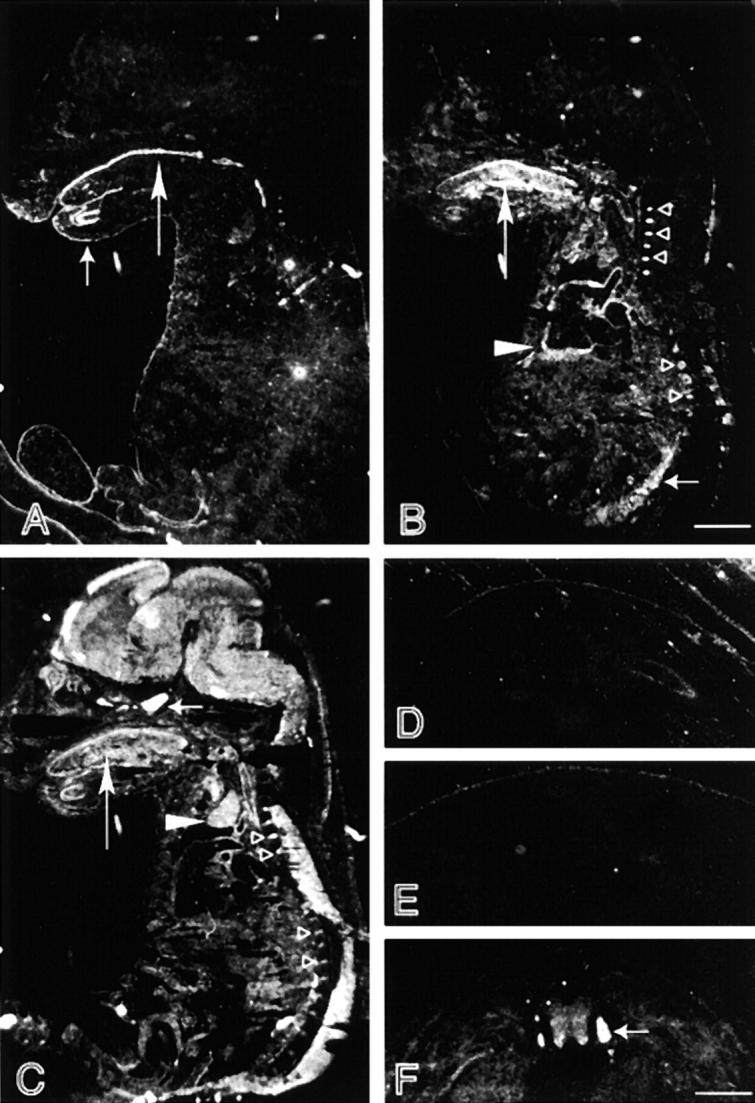
In situ hybridization of E14.5 embryos. (A) Sagittal section of mouse embryo hybridized with probe specific for the IFBD1. Hybridization signal was detected in the skin (short arrow) and mucosal epithelia of the digestive tract (long arrow). The weaker signal inside the trunk was apparently background hybridization, since it did not display any structural pattern. An identical hybridization pattern was obtained with a probe against the CC rod domain. (B) Sagittal section of mouse embryo hybridized with probe specific for the IFBD2. Strong hybridization signal was detected in the tongue (long arrow), heart (▸), skeletal muscle masses at the back (short arrow), and bone cartilage of the vertebrae (▹). Background hybridization was also apparent in the trunk. (C) Sagittal section of mouse embryo hybridized with probe specific for the MTBD. Similar hybridization patterns were also found with probes against the SR-containing rod domain and the ABD. High expression levels of BPAG1 isoforms that contain these domains were observed in the tongue (long arrow), the thymus (▸), and bone cartilage of the vertebrae (▹). In the nervous system, particularly strong signal was detected at the pituitary primordium (short arrow). Adjacent transverse sections hybridized with probes against the CC rod domain (D), IFBD1 (E), and MT-binding domain (F). Probes against the CC rod domain and IFBD1 detected BPAG1-e mRNA in the skin only. BPAG1-a labeled by the MTBD probe is highly expressed in the DRG (arrow). Bars: (A–C) 2 mm; (D–F) 0.5 mm.
We also compared the tissue distributions of MACF and BPAG1-a by in situ hybridization. Adjacent transverse sections of E14.5 embryos were hybridized with the MTBD probes from MACF and BPAG1-a (note that this BPAG1-a probe will not distinguish between BPAG1-a and BPAG1-b). The expression of BPAG1-a in the spinal cord was in a gradient with higher levels in the ventral horn, as compared with the homogenous expression pattern of MACF (Fig. 5, A and B) . Of note is the observation that BPAG1-a was expressed in much higher quantities than MACF in the DRG. In the vertebrae, BPAG1-a and/or BPAG1-b mRNAs were detected in developing bone cartilage, whereas MACF expression appeared to be more confined in the surrounding mesenchymal tissues (Fig. 5, C and D). Inside the thoracic cage, higher expression levels of BPAG1-b were detected in the heart, whereas MACF was more dominant in the lung.
Figure 5.
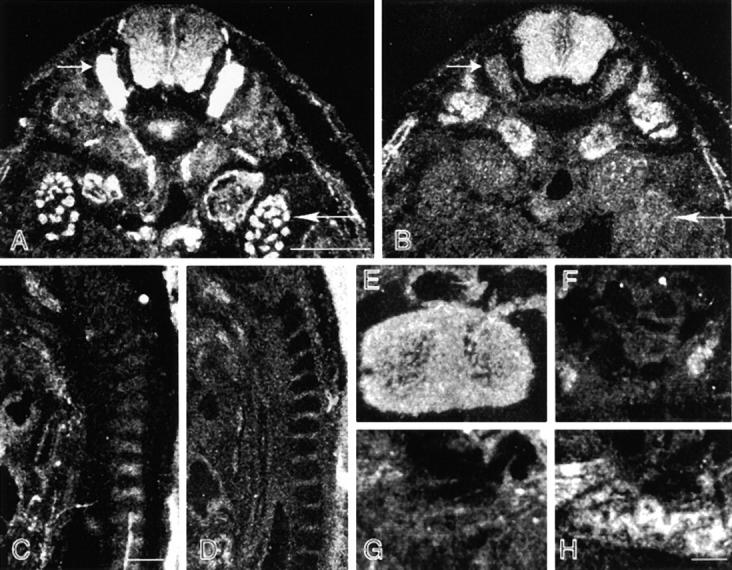
Differential distribution of MACF and BPAG1-a/b. Adjacent transverse (A, B, and E–H) and sagittal (C and D) sections of embryonic-day-14.5 embryos were hybridized with probes prepared for the MTBD of BPAG1-a /b (A, C, E, and G) and MACF (B, D, F, and H). Hybridization signal of BPAG1-a was stronger than that of MACF in the DRG (short arrows, A and B) and metanephros (long arrows, A and B). Interestingly, there is a gradient of BPAG1-a/b distribution in the spinal cord with stronger signals detected on the ventral side (A). Note that BPAG1-a mRNA was expressed in the cartilage of the vertebrae, whereas MACF mRNA was expressed mostly in the mesenchymal tissues surrounding the developing vertebrae (C and D). Strong signals for BPAG1-b and MACF were found in the heart (E) and the lungs, respectively (H). Bars: (A and C) 0.5 mm; (H) 0.1 mm.
Putative functions of BPAG1 isoforms
BPAG1-a is the primary isoform of BPAG1 expressed in the nervous system, including the DRGs that are severely degenerated in dt mice. The dt DRG sensory neurons display abnormal accumulations of neuronal IFs and perturbed MTs (Dalpe et al., 1998; Yang et al., 1999). The disruption of the cytoskeleton network in these defective sensory neurons cannot be rescued by the removal of neurofilaments, suggesting that axonal swellings packed with neurofilaments are the result instead of of the cause of the sensory neuron degeneration in dt mice (Yang et al., 1999). As BPAG1-a possesses a well-defined MTBD and is the predominant form of BPAG1 expressed in the nervous system, it is likely that the disorganization of the MT network in dt neurons is due to the absence of BPAG1-a.
Like MACF, BPAG1-a is a mammalian homologue of the Drosophila protein kakapo/short stop. Mutations in the short stop/kakapo gene result in defects in axonal outgrowth, as well as in the local development of dendritic processes (Prokop et al., 1998; Lee et al., 2000). During early development, the growth cones of both sensory and motor neurons fail to continue advancing after formation of the normal trajectory. By analogy, the neuropathology of dt mice could be the result of defects in axonal outgrowth and/or dendritic sprouting in sensory neurons. However, even though BPAG1-a is expressed broadly in the nervous system, only sensory neurons of the DRG degenerated in the dt mice. A possible explanation is that MACF can carry out the same functions as BPAG1-a. As DRG neurons express less MACF, there is less compensation from MACF for the loss of BPAG1-a, thus resulting in degeneration.
BPAG1-b is structurally similar to BPAG1-a, except that it has an additional putative IFBD in the middle of the molecule. Hence, BPAG1-b could potentially associate with microfilaments, IFs, and MTs; however, this remains to be shown. BPAG1-b is more confined to muscles, and its absence may be responsible for the muscle weakness observed in dt mice (Dalpe et al., 1999). The transcripts for the epithelial-specific BPAG1-e can be detected in the epidermis and mucosal epithelia of the digestive tracts (Fig. 4 A). BPAG1-e anchors keratin filaments to hemidesmosomes and the skin of BPAG1-null mice is more fragile in its absence (Guo et al., 1995).
We did not detect mRNAs of the proposed BPAG1-n isoforms in the central nervous system by Northern blot analyses, RPA, and in situ hybridization. However, when we performed 35 cycles of RT-PCR, we detected trace amounts of BPAG1 transcripts that have the plakin domain connected to the CC rod domain, presumably the BPAG1-n isoforms. Previously, independent studies have reported that BPAG1-n is widely expressed in the nervous system. However, the probes and antibodies used in these studies recognize not only BPAG1-n, but also BPAG1-a and BPAG1-b (Bernier et al., 1995b; Dowling et al., 1997; Dalpe et al., 1998; Yang et al., 1999). In conclusion, we propose that BPAG1-a is the primary form of BPAG1 expressed in the nervous system, and that its deficiency could account for the neurological phenotype observed in dt mice.
Materials and methods
Molecular cloning
cDNAs of BPAG1-a and BPAG1-b were obtained from QUICK-Clone™ cDNA (CLONTECH Laboratories, Inc.) by PCR using Advantage 2 polymerase (CLONTECH Laboratories, Inc.) or Pfu polymerase (Stratagene). To isolate cDNAs of BPAG1-e, RT-PCR was carried out on purified mouse skin total RNA using OneStep RT-PCR kit (QIAGEN). All procedures were conducted according to manufacturers' protocols. Genomic PCR was performed on purified mouse 129SvJ genomic DNA using Pfu polymerase (Stratagene). All PCR products were cloned into pCR2.1-TOPO vector (Invitrogen) for sequencing. Mouse 129SvEvTacfBR lambda phage genomic library (Stratagene) was screened with a human cDNA probe that encoded the IFBD of BPAG1-b. After screening 5 × 10⁷ plaques, one positive clone was recovered and characterized.
Northern blot analysis
The boundaries of the probes used were: ABD probe (nt 1–915 of BPAG1-a); plakin probe (nt 2549–3184 of BPAG1-a); CC rod domain probe (nt 4870–5383 of BPAG1-e); IFBD1 probe (nt 6491–7601 of BPAG1-e); IFBD2 probe (nt 5937–6655 of BPAG1-b); SR-containing rod domain probe (nt 11987–12660 of BPAG1-a); and MTBD probe (nt 15241–16143 of BPAG1-a). 30 μg of total RNA was resolved by electrophoresis in 0.8% formaldehyde agarose gel. To enhance the transfer of large-size RNAs, gels were treated with 0.05 M sodium hydroxide for 20 min before blotting onto nylon membranes. Hybridization was carried out at 68°C in hybridization buffer (6× SSC, 2× Denhardt's reagent, and 0.1% SDS) overnight. The membranes were washed once with SSC and 0.1% SDS at room temperature, and three times with 0.2× SSC and 0.1% SDS at 68°C.
RPA
Riboprobes were synthesized and labeled with biotinylated UTP using MAXIscript in vitro transcription kit (Ambion). The IFBD1 antisense probe included nt 7675–7852 of BPAG1-e, whereas the IFBD2 and SR-containing rod domain antisense probes encompassed nt 6352–6583 and nt 18401–18688 of BPAG1-b, respectively. The template for the actin riboprobe was supplied by the manufacturer. RPAs were performed according to the manufacturer's protocol (RPA III; Ambion).
RT-PCR analysis
RT-PCR was performed using Titanium OneStep RT-PCR kit (CLONTECH Laboratories, Inc.). The forward primer recognized the plakin domain, 5′-ATTCAAGAGTTCATGGACCTACGGACAC-3′. The isoform-specific reverse primers were: BPAG1-a, 5′-TAATTAGGCGGTTTTCAGTCTGGGTGAG-3′; BPAG1-b, 5′-CAATAAGGCCTCTTAAAACTGCCTGAAA-3′; and BPAG1-e/n, 5′-TTTCCTGCAGCTGGCTCCGGAAGTTGCG-3′. The actin primer set was provided by the manufacturer. 0.2 μg of the total RNAs from various tissues was used for each reaction. The RT-PCR cycling parameters included an RT incubation step at 50°C for 60 min, followed by an RT step at 94°C for 5 min, 25 cycles at 94°C for 30 s and at 68°C for 2 min, and a final extension step of 68°C for 5 min. 3 μl of the reaction products was subjected to electrophoresis. For the skin samples, 20 μl of the reaction products was used. The PCR products were sequenced to confirm their identities.
In situ hybridization
Both sagittal and transverse cryostat sections were prepared from E14.5 mouse embryos. Templates used for the generation of riboprobes were constructs obtained by cloning the Northern blot probes described above into pGEM7 vectors (Promega). Both sense and antisense [35S]UTP–labeled cRNA transcripts were synthesized in vitro using Riboprobe Gemini Systems (Promega) and purified using Sephadex G-50 columns (Roche). In situ hybridization was conducted as described previously (Zheng et al., 1998). Hybridization with sense control probes yielded low background staining in all cases.
Online supplemental material
The primary deduced amino acid sequences of the three major isoforms of mouse BPAG1 described in this paper, BAG1-a, BAG1-b, and BAG1-e, are available online as Fig. S1 at http://www.jcb.org/cgi/content/full/200012098.
Supplemental Material
Acknowledgments
We thank Victor Gan for technical assistance, and Dr. Anne Messer for helpful discussions.
This work was supported by grant NS15182 from the National Institutes of Health, and a grant from the Muscular Dystrophy Association. C.L. Leung was supported in part by training grant AG00189 from the National Institute on Aging.
The online version of this article contains supplemental material.
Footnotes
Abbreviations used in this paper: ABD, actin-binding domain; BPAG1, bullous pemphigoid antigen 1; CC, coiled coil; DRG, dorsal root ganglia; dt, dystonia musculorum; IF, intermediate filament; IFBD, IF-binding domain; MACF, MT actin cross-linking factor; MT, microtubule; MTBD, MT-binding domain; RPA, ribonuclease protection assay; RT, reverse transcriptase; SR, spectrin repeat.
References
- Bernier, G., A. Brown, G. Dalpe, Y. De Repentigny, M. Mathieu, and R. Kothary. 1995. a. Dystonin expression in the developing nervous system predominates in the neurons that degenerate in dystonia musculorum mutant mice. Mol. Cell. Neurosci. 6:509–520. [DOI] [PubMed] [Google Scholar]
- Bernier, G., A. Brown, G. Dalpe, M. Mathieu, Y. De Repentigny, and R. Kothary. 1995. b. Dystonin transcripts are altered and their levels are reduced in the mouse neurological mutant dt24J. Biochem. Cell Biol. 73:605–609. [DOI] [PubMed] [Google Scholar]
- Bernier, G., Y. De Repentigny, M. Mathieu, S. David, and R. Kothary. 1998. Dystonin is an essential component of the Schwann cell cytoskeleton at the time of myelination. Development. 125:2135–2148. [DOI] [PubMed] [Google Scholar]
- Brown, A., G. Bernier, M. Mathieu, J. Rossant, and R. Kothary. 1995. The mouse dystonia musculorum gene is a neural isoform of bullous pemphigoid antigen 1. Nat. Genet. 10:301–306. [DOI] [PubMed] [Google Scholar]
- Dalpe, G., N. Leclerc, A. Vallee, A. Messer, M. Mathieu, Y. De Repentigny, and R. Kothary. 1998. Dystonin is essential for maintaining neuronal cytoskeleton organization. Mol. Cell. Neurosci. 10:243–257. [DOI] [PubMed] [Google Scholar]
- Dalpe, G., M. Mathieu, A. Comtois, E. Zhu, S. Wasiak, Y. De Repentigny, N. Leclerc, and R. Kothary. 1999. Dystonin-deficient mice exhibit an intrinsic muscle weakness and an instability of skeletal muscle cytoarchitecture. Dev. Biol. 210:367–380. [DOI] [PubMed] [Google Scholar]
- Dowling, J., Y. Yang, R. Wollmann, L.F. Reichardt, and E. Fuchs. 1997. Developmental expression of BPAG1-n: insights into the spastic ataxia and gross neurologic degeneration in dystonia musculorum mice. Dev. Biol. 187:131–142. [DOI] [PubMed] [Google Scholar]
- Guo, L., L. Degenstein, J. Dowling, Q.C. Yu, R. Wollmann, B. Perman, and E. Fuchs. 1995. Gene targeting of BPAG1: abnormalities in mechanical strength and cell migration in stratified epithelia and neurologic degeneration. Cell. 81:233–243. [DOI] [PubMed] [Google Scholar]
- Lee, S., K.L. Harris, P.M. Whitington, and P.A. Kolodziej. 2000. Short stop is allelic to kakapo, and encodes rod-like cytoskeletal-associated proteins required for axon extension. J. Neurosci. 20:1096–1108. [DOI] [PMC free article] [PubMed] [Google Scholar]
- Leung, C.L., D. Sun, and R.K.H. Liem. 1999. a. The intermediate filament protein peripherin is the specific interaction partner of mouse BPAG1-n (dystonin) in neurons. J. Cell Biol. 144:435–446. [DOI] [PMC free article] [PubMed] [Google Scholar]
- Leung, C.L., D. Sun, M. Zheng, D.R. Knowles, and R.K. Liem. 1999. b. Microtubule actin cross-linking factor (MACF). A hybrid of dystonin and dystrophin that can interact with the actin and microtubule cytoskeletons. J. Cell Biol. 147:1275–1286. [DOI] [PMC free article] [PubMed] [Google Scholar]
- Prokop, A., J. Uhler, J. Roote, and M. Bate. 1998. The kakapo mutation affects terminal arborization and central dendritic sprouting of Drosophila motor neurons. J. Cell Biol. 143:1283–1294. [DOI] [PMC free article] [PubMed] [Google Scholar]
- Ruhrberg, C., and F.M. Watt. 1997. The plakin family: versatile organizers of cytoskeletal architecture. Curr. Opin. Genet. Dev. 7:392–397. [DOI] [PubMed] [Google Scholar]
- Sawamura, D., K. Li, M.L. Chu, and J. Uitto. 1991. Human bullous pemphigoid antigen (BPAG1). Amino acid sequences deduced from cloned cDNAs predict biologically important peptide segments and protein domains. J. Biol. Chem. 266:17784–17790. [PubMed] [Google Scholar]
- Sun, D., C.L. Leung, and R.K. Liem. 2001. Characterization of the microtubule binding domain of microtubule actin crosslinking factor (MACF): identification of a novel group of microtubule associated proteins. J. Cell Sci. 114:161–172. [DOI] [PubMed] [Google Scholar]
- Yang, Y., J. Dowling, Q.C. Yu, P. Kouklis, D.W. Cleveland, and E. Fuchs. 1996. An essential cytoskeletal linker protein connecting actin microfilaments to intermediate filaments. Cell. 86:655–665. [DOI] [PubMed] [Google Scholar]
- Yang, Y., C. Bauer, G. Strasser, R. Wollman, J.P. Julien, and E. Fuchs. 1999. Integrators of the cytoskeleton that stabilize microtubules. Cell. 98:229–238. [DOI] [PubMed] [Google Scholar]
- Zheng, M., C.L. Leung, and R.K. Liem. 1998. Region-specific expression of cyclin-dependent kinase 5 (cdk5) and its activators, p35 and p39, in the developing and adult rat central nervous system. J. Neurobiol. 35:141–159. [DOI] [PubMed] [Google Scholar]
Associated Data
This section collects any data citations, data availability statements, or supplementary materials included in this article.


