Abstract
The common perception that hemoglobin is involved solely in the transport of oxygen and carbon dioxide has been challenged by recent studies with nitric oxide (NO). These studies have shown that the primordial bacterial flavohemoglobin functions to consume NO enzymatically (to protect from nitrosative stress), whereas mammalian hemoglobin functions to deliver NO (thus maximizing oxygen delivery in the respiratory cycle). Here we report that murine macrophages stimulated to produce NO with lipopolysaccharide and interferon-γ express the βminor hemoglobin subunit. Consumption of NO, however, was not increased by cytokines or by hemoglobin expression. These data suggest alternative functions for globins in mammalian cells, and they challenge the prevailing view that the expression of α- and β-globin genes is always balanced and coordinated.
The common perception of hemoglobin is that it is selectively expressed in cells of erythroid lineage and involved solely in the transport of oxygen from the lungs to the tissues and of carbon dioxide from the tissues to the lungs. The function of hemoglobin has been interpreted in terms of an equilibrium between two alternative structures, one with high affinity for oxygen and the other with low affinity (1). Although the position of this equilibrium is governed by the spin state of the heme iron, it is a structural change in the heme pocket rather than a change in oxidation state of the iron that is thought to trigger deoxygenation (1). Thus, hemoglobins have been functionally distinguished from the heme-containing cytochromes, which carry out redox reactions with their ligands (2).
These general principles have been challenged by recent studies with nitric oxide (NO). First, hemoglobin transports not only oxygen but also NO, which it releases in tissues to dilate blood vessels (3, 4). Second, the binding and release of NO involves redox chemistry (5), blurring the functional distinction between hemoglobins and cytochromes. Third, it has been shown recently that a bacterial flavohemoglobin consumes NO enzymatically (6, 7). NO increases both oxygen consumption and NAD(P)H utilization by the flavohemoglobin (6), proving that it functions as an oxygenase that metabolizes NO (6), rather than as an oxidase that generates NO-scavenging superoxide (8). In addition, the flavohemoglobin reduces NO to N2O anaerobically (6, 9). Thus, the primordial function of hemoglobin—a protein found not only in erythrocytes but also in microorganisms, invertebrates, and plants—may well be to protect against nitrosative stress (6, 7, 10).
In this new light, we questioned the remaining tenet that mammalian globin genes are normally expressed only in erythroid cell lineages. Cytokine-activated murine macrophages are a well-studied model of NO production (11–16). Specifically, treatment with cytokines leads to induction of NO synthase, activation of the NADPH oxidase, and inhibition of cell respiration. The mechanism by which these cells survive the high-level production of reactive oxygen and nitrogen species is not well understood. Here we show that treatment with lipopolysaccharide (LPS) and interferon (IFN)-γ leads to activation of the βminor-globin gene. It is likely, however, that hemoglobin carries out different functions in macrophages than in erythrocytes or bacteria.
MATERIALS AND METHODS
Cell Culture.
Mouse macrophage RAW264.7 cells from the American Type Culture Collection were cultured in DMEM supplemented with 10% heat-inactivated fetal bovine serum. The cells were activated by addition of 200 ng/ml LPS (Escherichia coli O128:B12; Sigma) and 200 units/ml IFN-γ to the culture medium.
Harvesting of Peritoneal Macrophages.
Peritoneal macrophages from BALB/c mice were elicited by i.p. injection of 2 ml of 4% brewer thioglycollate (Difco). Four days later, cells were harvested by peritoneal lavage with 20 ml of DMEM. After culture for 2 hr at 37°C, nonadherent cells were removed by extensive washing. The absence of red blood cells was confirmed by microscopic examination.
Western Blotting.
Whole cell lysates were subjected to SDS/PAGE and probed with rabbit antiserum to mouse hemoglobin from either Research Plus (Bayonne, NJ) or ICN Pharmaceuticals (Aurora, OH) and antiserum to human myoglobin (Sigma). Native hemoglobin (Sigma) or βmajor and βminor chains synthesized by in vitro transcription and translation with the TNT wheat germ system (Promega) were used as the controls. All primary antisera were used at 1:3000 dilution. The Immun-Star chemiluminescent protein detection system, which employs a goat anti-rabbit secondary antibody (Bio-Rad), was used to detect the antigen–antibody complex.
Detection of Hemoglobin Transcripts by Reverse Transcription (RT)-PCR.
Total RNA was isolated from macrophage cells with an RNeasy minikit (Qiagen, Santa Clarita, CA). Total RNA was treated with RQ1 DNase (Promega) in some cases to safeguard against genomic DNA contamination. cDNA was generated from 2.5 μg of the purified total RNA in 40-μl reaction volumes with the RT system (Promega). One microliter of RT products was used in PCR with AmpliTaq Gold DNA polymerase (PE Applied Biosystems). The lowest annealing temperature used in stringent PCR was 3°C below the melting temperature of the primers.
Oligonucleotides α/ζ250se (5′-CTGAGCGAG/CCTGCATGCC) and α3′ (5′-TTAACGGTACTTGGAGGTCAG) were used for detection of hemoglobin α subunits (17); α/ζ250se and ζ3′ (5′-TTAGCGGTACTTCTCAGTCAG) were used for the ζ subunit (GenBank accession no. M26898) (18); the β3′ (5′-TTAGTGGTACTTGTGAGCCA) and β1se (5′-ATGGTGCACCTGACTGATGC) pair as well as the β3′ and β291se (5′-CATGC/TGGATCCTGAGAACTTCA) pair were used for both βmajor (J00413) and βminor (V00722); in addition, βmajor 218se (5′-ACGATGGCCTGAATCACTTG) and β3′ were used for βmajor, and β150se (5′-CTCTGCCTCTGCTATCATGC) and β550as (5′-GCTAGATGCCCAAAGGTCTTC) were used for βminor; β291se (5′-CATGC/TGGATCCTGAGAACTTCA) and y/ζ3′ (5′-TC/TAA/GTGGTACTTGTGGGACAG) were used for y, βh0, and βh1 subunits; GAPDH-F (5′-AATGTGTCCGTCGTGGATCT) and GAPDH-R (5′-CCCTGTTGCTGTAGCCGTAT) were used for glyceraldehyde-3-phosphate dehydrogenase (GAPDH).
Cloning and Sequencing βminor cDNA.
The complete coding region of βminor was obtained by RT-PCR using β1se and β3′ as PCR primers. The PCR product was cloned into the pCR3.1 vector with the Eukaryotic TA cloning kit (Invitrogen, Carlsbad, CA). The DNA insert was entirely sequenced on both strands by Duke University DNA Sequencing Facility.
NO Metabolism.
Four million RAW264.7 cells or 240 μg (protein) of whole cell lysate, supplemented in some cases with NADH, NADPH, FMN, FAD, and tetrahydrobiopterin alone or in combination, were incubated in 2 ml of PBS containing 0.1 mM diethylenetriamine pentaacetic acid (DTPA). NO was added from purified stock solutions (final concentrations ranging from 50 nM to 10 μM), and its consumption was measured with an NO electrode as described previously (6).
RESULTS
Analysis of Hemoglobin Expression by Western Blotting.
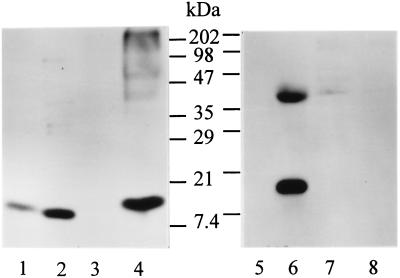
The α-like globin gene cluster on mouse chromosome 11 consists of the genes ζ, α1, and α2 (19, 20), and the β-like cluster of the diffuse haplotype on chromosome 7 consists of the genes y, βh0, βh1, βmajor, and βminor (21). These globin genes are active at various stages of development. Rabbit antisera to mouse hemoglobin were used in Western blots to detect hemoglobin expression in macrophage RAW264.7 cells that had been stimulated with IFN-γ and LPS. Antiserum (from Research Plus) strongly recognized a protein in IFN-γ/LPS-treated RAW264.7 cells, but not in unstimulated cells (Fig. 1). The size of the protein was very close to that of purified hemoglobin. This protein or a protein of about the same size was also strongly recognized by a second antiserum (from ICN Pharmaceuticals) to mouse hemoglobin in Western blots (data not shown) but was not recognized by an anti-myoglobin antiserum. These data suggest the presence of hemoglobin in IFN-γ/LPS-activated macrophages.
Figure 1.
Detection of hemoglobin by Western blotting. Antiserum against hemoglobin (Research Plus) was used in lanes 1–4 and antibody against myoglobin in lanes 5–8. Lanes 1 and 5, purified hemoglobin (100 ng, Sigma); lanes 2 and 6, mouse muscle extract (15 μg); lanes 3 and 7, lysate (50 μg) of resting RAW264.7 cells; lanes 4 and 8, lysate (40 μg) of RAW264.7 cells stimulated with IFN-γ/LPS for 16 hr. (An unidentified protein of ≈40 kDa is recognized by the anti-myoglobin antibody in lane 6.)
Expression of Hemoglobin βminor Subunit in RAW264.7 Cells.
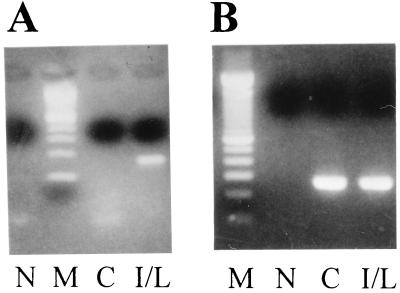
The identity of the globin expressed in IFN-γ/LPS-treated macrophages was assessed by RT-PCR. When primers specific for β subunits were used, a fragment of the size predicted for the mRNA substrate (≈150 bp) but not the genomic DNA (≈800 bp) was detected in the cells treated with IFN-γ/LPS (Fig. 2A). This fragment was not detected in the untreated cells, from which GAPDH cDNA products (control) were successfully synthesized (Fig. 2B). Direct DNA sequencing of the β fragment indicated that it was the βminor transcript (see below). cDNA products of correct size were not obtained when a pair of βmajor-specific primers were used, with either stringent or decreased PCR annealing temperatures (data not shown), nor were they obtained for α, ζ, y, βh0, or βh1 subunits, from either untreated or IFN-γ/LPS-treated RAW264.7 cells. These data indicate that the βminor gene alone was activated by IFN-γ/LPS treatment in RAW264.7 cells.
Figure 2.
Expression of hemoglobin βminor mRNA in IFN-γ/LPS-treated RAW264.7 cells. (A) RT-PCR was carried out with hemoglobin β-specific primers (β291se and β3′) at an annealing temperature of 55°C for 40 cycles. (B) RT-PCR was performed with GAPDH primers at an annealing temperature of 60°C for 40 cycles. N, no DNA templates; M (molecular weight markers), 100-bp DNA ladder; C (control), RAW264.7 cells without stimulation; I/L, RAW264.7 cells stimulated with IFN-γ/LPS for 12 hr.
The complete ORF of the β subunit was obtained by PCR with a pair of primers that recognize both βmajor and βminor. The PCR fragment was cloned and four independent clones were completely sequenced. The four clones had identical sequences (Fig. 3), which differed only at position 417 from the βminor cDNA sequence deduced from its gene (GenBank accession no. V00722). The macrophage cDNA is G at this position instead of A (22). However, numerous βminor cDNA sequences in the expressed sequence tag (EST) database of GenBank have G rather than A at this position. Therefore, the macrophage hemoglobin transcript is βminor.
Figure 3.
Nucleotide and deduced amino acid sequence of macrophage hemoglobin.
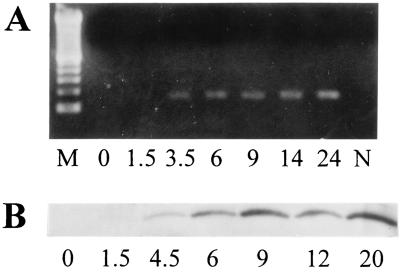
To elucidate the temporal pattern of globin expression, RAW264.7 cells were stimulated with IFN-γ/LPS for various lengths of time. The βminor transcript was clearly detected 3.5–24 hr after addition of both IFN-γ and LPS (Fig. 4A) and after 12 hr of stimulation by either IFN-γ or LPS alone (data not shown). A similar temporal pattern was seen on a Western blot for the protein recognized by the anti-hemoglobin antibodies (Fig. 4B). Therefore, induction of β-globin requires at most 3.5 hr and lasts for at least 24 hr. Treatment of the cells with the NO synthase inhibitor Ng-monomethyl-l-arginine (1 mM) did not modify the level of globin expression (data not shown).
Figure 4.
Time course of globin mRNA and protein induction. RAW264.7 cells were incubated with IFN-γ/LPS for the times indicated (1.5–24 hr), after which equal amounts of RNA were used in RT-PCR with the primers β291se and β3′ at an annealing temperature of 60°C for 40 cycles (A), and cellular proteins were probed with hemoglobin antiserum as in Fig. 1 (B). N, no DNA templates; M (molecular weight markers), 100-bp DNA ladder; time 0, RAW264.7 cells without stimulation.
βminor Expression Induced in Peritoneal Macrophages.
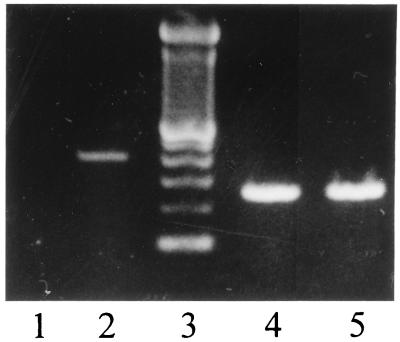
RAW264.7 is a cell line transformed by Abelson leukemia virus (23). It has been reported that herpes simplex virus infection activates transcription from the α-globin gene in normal human fibroblasts and HeLa cells (24), and that Rous sarcoma virus transformation of chicken embryonic fibroblasts activates unidentified globin gene(s) (25). Although expression of β-globin genes in nonerythroid cells is unprecedented, we wanted to exclude the possibility that βminor induction in macrophages was merely the result of virus transformation or some other cell line effect. Globin expression was therefore studied in peritoneal macrophages from BALB/c mice. A cDNA fragment of expected size was detected by RT-PCR with a pair of βminor-specific PCR primers in peritoneal macrophages treated with IFN-γ/LPS, but not in untreated cells (Fig. 5). DNA sequence analysis showed that this cDNA was identical to the βminor cDNA of RAW264.7 cells. We conclude that transcription of βminor is activated by IFN-γ/LPS in peritoneal macrophages.
Figure 5.
Induction of βminor-globin in peritoneal macrophages. Macrophages treated (lanes 2 and 5) or not treated (lanes 1 and 4) with IFN-γ/LPS were probed by RT-PCR for βminor transcripts (lanes 1 and 2) with primers β150se and β550as, and for GAPDH (lanes 4 and 5), at the PCR annealing temperature of 60°C. The 100-bp DNA ladder is shown in lane 3.
NO Metabolism.
The Escherichia coli flavohemoglobin metabolizes NO in the presence of NADH and protects against nitrosative stress (6). To determine whether hemoglobin in macrophages plays a similar role, NO decay was measured in the presence of either intact cells (Fig. 6A) or cell lysates (supplemented in some experiments with cofactors as described in Materials and Methods) (Fig. 6 B and C). Lysates from resting cells tended to accelerate decay of low amounts of NO in an NADH-dependent manner (Fig. 6B); however, decay rates were not accelerated further by IFN-γ/LPS treatment in either cells or lysates. In addition, we found no relationship between the level of hemoglobin expression after cytokine treatment and NO decay rates (not shown). Taken together, these data suggest that the macrophage hemoglobin does not function to metabolize NO, or at least exogenous NO.
Figure 6.
NO consumption by IFN-γ/LPS-activated macrophages. (A) NO (≈250 nM) was added to buffer (solid line), to a suspension of resting RAW264.7 cells (dotted line), or to RAW264.7 cells that had been previously treated with IFN-γ/LPS for 16 hr (dashed line). Decay of NO was monitored with an NO electrode (6). (B and C) NO was added at 100 nM (B) or 500 nM (C) to buffer (solid line) or to lysates of cells that had (dashed line) or had not (dotted line) been previously stimulated with IFN-γ/LPS, in the presence of 200 μM NADH and NADPH. Similar results were obtained in the added presence of flavins and/or biopterin.
DISCUSSION
Globin gene expression has been intensively studied. It is generally accepted that the expression of the α and β genes is balanced and coordinated. That is, both genes are expressed at comparable levels in erythrocytes and both are reportedly silenced in nonerythroid cells (24, 26, 27). However, the α- and β-globin genes are found on different chromosomes in entirely different genomic contexts (26). In particular, the β-globin gene cluster is packaged into inactive heterochromatin in nonerythroid cells, whereas the α genes are imbedded in open chromatin conformations in all cell types. Thus, alternative mechanisms of α gene silencing have been invoked. It is somewhat of a mystery why the α and β (like) genes are regulated so differently if, in fact, their expression is always tightly linked. This complexity would make sense, on other hand, if the individual globin genes could be selectively expressed in various cell types. Our data at least raise this possibility.
The transcriptional regulation responsible for selective activation of the βminor gene in macrophages is likely to be different from that regulating the β genes in adult erythroid cells, where the βmajor gene probably competes with βminor for common factors (28) and is much more active. Expression of the β genes in erythroid cells depends on their linkage with the upstream locus control region (LCR), which functions as both a chromatin-opener and an enhancer (27). It would therefore be of interest to know whether the chromatin is open or closed around the βminor gene in IFN-γ/LPS-treated macrophages, and whether the set of transcription factors present in resting macrophages is sufficient for βminor promoter activity. In this regard, the erythroid-specific transcription activator, erythroid Krüppel-like factor (EKLF), recognizes a CACCC motif in the promoter of the βmajor gene and is critical for its expression in erythrocytes (29–31). The βminor promoter contains a similar EKLF recognition sequence (around −150), and two different CACCC sequences (−140 and −90) that are absent from the βmajor promoter. These latter motifs provide a potential mechanism for differential responsiveness and raise the possibility that a member of the EKLF family (32, 33) selectively activates the βminor promoter in macrophages.
The erythropoiesis-inducing transcription factor hypoxia-inducible factor 1 (HIF-1) has also been implicated in the activation of macrophages by IFN-γ (34). It would be intriguing if globin gene induction turned out to be a response shared by multiple cells to HIF-1, or to the hypoxia- or oxidant-related stresses with which it has been associated (35). This possibility may not be far-fetched: electrophilic lipid peroxidation products increased the amount of γ-globin transcript in erythroleukemia cells (36) and a putative antioxidant (electrophile)-response element has been identified in both the β-globin and myoglobin transcriptional regulatory elements (37, 38).
The βminor-globin was identified by virtue of its parallel induction by cytokines at the level of protein and mRNA. However, the apparent size of the putative βminor-globin on Western blots (as recognized by two anti-hemoglobin antibodies) was slightly larger than the β-globin chains of native hemoglobin (Fig. 1A) and of the βminor- and βmajor-globin controls that were generated by in vitro transcription/translation (data not shown). Although these small differences are best rationalized by a posttranslational modification of macrophage βminor, it remains possible that our immunological probes identified a closely related protein.
What is the function of βminor-globin in activated macrophages? We did not observe increases in NO consumption by whole cell lysates or intact cells expressing the hemoglobin. These data argue against a function in protection from nitrosative stress analogous to the bacterial enzyme. Isolated β chains do not exhibit the ligand-binding cooperativity characteristic of the α,β heterotetramer. Thus the function of macrophage hemoglobin is also predictably different from the protein in erythrocytes. A monomeric globin might function to facilitate oxygen transfer to sites of use. But recent studies in mice lacking myoglobin challenge this notion (39). One is left to speculate on alternative enzymatic functions that have been identified with hemoglobins (5, 40), on alternative NO-related effects of hemoglobins, on associated proteins that might regulate globin activity, and on the intriguing possibility that the protein serves as an oxygen or NO sensor.
Acknowledgments
We thank Russel Kaufman for helpful comments and Alfred Hausladen for help with NO assays.
ABBREVIATIONS
- IFN
interferon
- LPS
lipopolysaccharide
- RT-PCR
reverse transcription–PCR
- GAPDH
glyceraldehyde-3-phosphate dehydrogenase
Footnotes
Data deposition: The sequence reported in this paper has been deposited in the GenBank database (accession no. AF149782).
References
- 1.Perutz M F. In: Molecular Basis of Blood Diseases. Stammatayanopoulos G, editor. Philadelphia: Saunders; 1987. pp. 127–178. [Google Scholar]
- 2.Poole R K. Antonie Leeuwenhoek. 1994;65:289–310. doi: 10.1007/BF00872215. [DOI] [PubMed] [Google Scholar]
- 3.Jia L, Bonaventura C, Bonaventura J, Stamler J S. Nature (London) 1996;380:221–226. doi: 10.1038/380221a0. [DOI] [PubMed] [Google Scholar]
- 4.Stamler J S, Jia L, Eu J P, McMahon T J, Demchenko I T, Bonaventura J, Gernert K, Piantadosi C A. Science. 1997;276:2034–2037. doi: 10.1126/science.276.5321.2034. [DOI] [PubMed] [Google Scholar]
- 5.Gow A J, Stamler J S. Nature (London) 1998;391:169–173. doi: 10.1038/34402. [DOI] [PubMed] [Google Scholar]
- 6.Hausladen A, Gow A J, Stamler J S. Proc Natl Acad Sci USA. 1998;95:14100–14105. doi: 10.1073/pnas.95.24.14100. [DOI] [PMC free article] [PubMed] [Google Scholar]
- 7.Gardner P R, Gardner A M, Martin L A, Salzman A L. Proc Natl Acad Sci USA. 1998;95:10378–10383. doi: 10.1073/pnas.95.18.10378. [DOI] [PMC free article] [PubMed] [Google Scholar]
- 8.Poole R K, Ioannidis N, Orii Y. Microbiology. 1996;142:1141–1148. doi: 10.1099/13500872-142-5-1141. [DOI] [PubMed] [Google Scholar]
- 9.Kim S O, Orii Y, Lloyd D, Hughes M N, Poole R K. FEBS Lett. 1999;445:389–394. doi: 10.1016/s0014-5793(99)00157-x. [DOI] [PubMed] [Google Scholar]
- 10.Crawford M J, Goldberg D E. J Biol Chem. 1998;273:12543–12547. doi: 10.1074/jbc.273.20.12543. [DOI] [PubMed] [Google Scholar]
- 11.Stuehr D J, Cho H J, Kwon N S, Weise M F, Nathan C F. Proc Natl Acad Sci USA. 1991;88:7773–7777. doi: 10.1073/pnas.88.17.7773. [DOI] [PMC free article] [PubMed] [Google Scholar]
- 12.Drapier J C, Hibbs J B., Jr J Immunol. 1988;140:2829–2838. [PubMed] [Google Scholar]
- 13.Drapier J C, Pellat C, Henry Y. J Biol Chem. 1991;266:10162–10167. [PubMed] [Google Scholar]
- 14.Brune B, Gotz C, Messmer U K, Sandau K, Hirvonen M R, Lapetina E G. J Biol Chem. 1997;272:7253–7258. doi: 10.1074/jbc.272.11.7253. [DOI] [PubMed] [Google Scholar]
- 15.Zhuang J C, Wogan G N. Proc Natl Acad Sci USA. 1997;94:11875–11880. doi: 10.1073/pnas.94.22.11875. [DOI] [PMC free article] [PubMed] [Google Scholar]
- 16.Miesel R, Kurpisz M, Kroger H. Free Radic Biol Med. 1996;20:75–81. doi: 10.1016/0891-5849(95)02026-8. [DOI] [PubMed] [Google Scholar]
- 17.Erhart M A, Piller K, Weaver S. Genetics. 1987;115:511–519. doi: 10.1093/genetics/115.3.511. [DOI] [PMC free article] [PubMed] [Google Scholar]
- 18.Wilkinson D G, Bailes J A, Champion J E, McMahon A P. Development (Cambridge, UK) 1987;99:493–500. doi: 10.1242/dev.99.4.493. [DOI] [PubMed] [Google Scholar]
- 19.Zhao Q Z, Liang X L, Mitra S, Gourdon G, Alter B P. Mamm Genome. 1996;7:749–753. doi: 10.1007/s003359900225. [DOI] [PubMed] [Google Scholar]
- 20.Leder A, Swan D, Ruddle F, D’Eustachio P, Leder P. Nature (London) 1981;293:196–200. doi: 10.1038/293196a0. [DOI] [PubMed] [Google Scholar]
- 21.Jahn C L, Hutchison C A, 3rd, Phillips S J, Weaver S, Haigwood N L, Voliva C F, Edgell M H. Cell. 1980;21:159–168. doi: 10.1016/0092-8674(80)90123-3. [DOI] [PubMed] [Google Scholar]
- 22.Konkel D A, Maizel J V, Jr, Leder P. Cell. 1979;18:865–873. doi: 10.1016/0092-8674(79)90138-7. [DOI] [PubMed] [Google Scholar]
- 23.Raschke W C, Baird S, Ralph P, Nakoinz I. Cell. 1978;15:261–267. doi: 10.1016/0092-8674(78)90101-0. [DOI] [PubMed] [Google Scholar]
- 24.Cheung P, Panning B, Smiley J R. J Virol. 1997;71:1784–1793. doi: 10.1128/jvi.71.3.1784-1793.1997. [DOI] [PMC free article] [PubMed] [Google Scholar]
- 25.Groudine M, Weintraub H. Proc Natl Acad Sci USA. 1975;72:4464–4468. doi: 10.1073/pnas.72.11.4464. [DOI] [PMC free article] [PubMed] [Google Scholar]
- 26.Hardison R. J Exp Biol. 1998;201:1099–1117. doi: 10.1242/jeb.201.8.1099. [DOI] [PubMed] [Google Scholar]
- 27.Baron M H. Biochim Biophys Acta. 1997;1351:51–72. doi: 10.1016/s0167-4781(96)00195-9. [DOI] [PubMed] [Google Scholar]
- 28.Fraser P, Gribnau J, Trimborn T. Curr Opin Hematol. 1998;5:139–144. doi: 10.1097/00062752-199803000-00009. [DOI] [PubMed] [Google Scholar]
- 29.Nuez B, Michalovich D, Bygrave A, Ploemacher R, Grosveld F. Nature (London) 1995;375:316–318. doi: 10.1038/375316a0. [DOI] [PubMed] [Google Scholar]
- 30.Perkins A C, Sharpe A H, Orkin S H. Nature (London) 1995;375:318–322. doi: 10.1038/375318a0. [DOI] [PubMed] [Google Scholar]
- 31.Gillemans N, Tewari R, Lindeboom F, Rottier R, de Wit T, Wijgerde M, Grosveld F, Philipsen S. Genes Dev. 1998;12:2863–2873. doi: 10.1101/gad.12.18.2863. [DOI] [PMC free article] [PubMed] [Google Scholar]
- 32.Crossley M, Whitelaw E, Perkins A, Williams G, Fujiwara Y, Orkin S H. Mol Cell Biol. 1996;16:1695–1705. doi: 10.1128/mcb.16.4.1695. [DOI] [PMC free article] [PubMed] [Google Scholar]
- 33.Matsumoto N, Laub F, Aldabe R, Zhang W, Ramirez F, Yoshida T, Terada M. J Biol Chem. 1998;273:28229–28237. doi: 10.1074/jbc.273.43.28229. [DOI] [PubMed] [Google Scholar]
- 34.Melillo G, Taylor L S, Brooks A, Musso T, Cox G W, Varesio L. J Biol Chem. 1997;272:12236–12243. doi: 10.1074/jbc.272.18.12236. [DOI] [PubMed] [Google Scholar]
- 35.Huang L E, Willmore W G, Gu J, Goldberg M A, Bunn H F. J Biol Chem. 1999;274:9038–9044. doi: 10.1074/jbc.274.13.9038. [DOI] [PubMed] [Google Scholar]
- 36.Fazio V M, Barrera G, Martinotti S, Farace M G, Giglioni B, Frati L, Manzari V, Dianzani M U. Cancer Res. 1992;52:4866–4871. [PubMed] [Google Scholar]
- 37.Wasserman W W, Fahl W E. Proc Natl Acad Sci USA. 1997;94:5361–5366. doi: 10.1073/pnas.94.10.5361. [DOI] [PMC free article] [PubMed] [Google Scholar]
- 38.Hug B A, Moon A M, Ley T J. Nucleic Acids Res. 1992;20:5771–5778. doi: 10.1093/nar/20.21.5771. [DOI] [PMC free article] [PubMed] [Google Scholar]
- 39.Garry D J, Ordway G A, Lorenz J N, Radford N B, Chin E R, Grange R W, Bassel-Duby R, Williams R S. Nature (London) 1998;395:905–908. doi: 10.1038/27681. [DOI] [PubMed] [Google Scholar]
- 40.Giardina B, Messana I, Scatena R, Castagnola M. Crit Rev Biochem Mol Biol. 1995;30:165–196. doi: 10.3109/10409239509085142. [DOI] [PubMed] [Google Scholar]


