The overexpression, crystallization and preliminary diffraction analysis of E. coli YegS are reported.
Keywords: YegS
Abstract
yegS is a gene encoding a 32 kDa cytosolic protein with unknown function but with strong sequence homology to a family of structurally uncharacterized eukaryotic non-protein kinases: diacylglycerol kinases, sphingosine kinases and ceramide kinases. Here, the overexpression, crystallization and preliminary diffraction analysis of Escherichia coli YegS are reported. The crystals belong to space group P21, with unit-cell parameters a = 42.4, b = 166.1, c = 48.5 Å, β = 96.97°. The presence of a dimer in the asymmetric unit was estimated to give a Matthews coefficient (V M) of 2.5 Å3 Da−1 and a solvent content of 50.8%(v/v). Single-wavelength diffraction data were collected to a resolution of 1.9 Å using synchrotron radiation.
1. Introduction
Lipids are major and vital constituents of the cell, providing fuel for metabolism and a structural basis for cellular membranes. However, apart from these obvious roles, lipids also function in a number of crucial signalling cascades. These lipid mediators of cellular signalling are produced by enzymes such as phospholipases, lipid phosphatases and lipid kinases.
Diacylglycerols (DAGs) are glycerol derivatives in which two hydroxyl groups are substituted by fatty acids through ester bond formation. The physiologically relevant isomer is 1,2-diacyl-sn-glycerol, of which mammalian cells contain many structurally distinct species that differ with respect to the type and degree of saturation of their fatty-acid moieties. Without specific stimulation, biological membranes contain a very little amount of DAGs. Their production is stimulated upon activation of a multitude of cellular signalling cascades and DAGs produced by these mechanisms act as key second messengers to modulate the function of at least six different types of target protein, the most prominent of which belong to the protein kinase C (PKC) family. Diacylglycerol kinase (DGK) phosphorylates DAG to produce phosphatidic acid (PA) and is therefore a potential terminator of DAG signalling. By attenuating DAG levels, DGK may downregulate membrane localization of PKC and/or may terminate transient receptor-induced PKC activation and thereby the signalling pathways downstream of PKC. Furthermore, DGK may indirectly regulate small-molecular-weight G-proteins via DAG activation of their nucleotide-exchange factors or GTPase-activating proteins (Goto & Kondo, 2004 ▶).
YegS is a 299-amino-acid (32 kDa) cytosolic protein in Escherichia coli with unknown function that shows substantial sequence homology to eukaryotic diacylglycerol kinases (Labesse et al., 2002 ▶; Abe et al., 2003 ▶). The function of YegS has not been biochemically established, but based on its sequence homology to not only diacylglycerol kinases but also more remotely to sphingosine kinases and ceramide kinases, it can be presumed that YegS is involved in lipid biosynthesis and cell signalling. YegS has a multitude of homologues in prokaryotes, most of which are uncharacterized hypothetical proteins. YegS may be a close homologue to the structural archetype of all soluble lipid kinases and its structure will, apart from shedding light on the biochemical function of YegS in E. coli, provide important insights into the structure and function of its eukaryotic counterparts.
2. Methods and results
2.1. Cloning, expression and purification
The E. coli yegS gene was amplified by PCR using chromosomal DNA from strain K12 as a template. The amplified DNA was subcloned into the E. coli expression vector PT73.3 (Tobbell et al., 2002 ▶) using the Gateway system (Invitrogen, Carlsbad, CA, USA). The resulting vector, PT73.3-YEGS, encodes a polypeptide with the yegS gene and an N-terminal tail (N-MHHHHHHGSTSLYKKAGSETLYIQG-) encompassing an attB site for the Gateway recombination event and a hexahistidine sequence to simplify purification. A C-terminal hexahistidine tail (STHHHHHH-C) was also used to monitor full-length expression in a multi-well filtration dot-blot expression screening procedure (Knaust & Nordlund, 2001 ▶). The expression plasmid was transformed into BL21(DE3) and the cells were grown in Luria–Bertani (Miller) medium suppemented with tetracycline at 310 K. Protein overproduction was induced at an OD600 of 0.6 by addition of 0.1 mM isopropyl β-d-thiogalactopyranoside and was continued for 4 h at 293 K. Harvested cells were resuspended and sonicated in lysis buffer (0.1 M NaCl, 10 mM β-mercaptoethanol, 20 mM Tris buffer pH 7.4), 1 mg ml−1 lysozyme and Complete EDTA-free protease-inhibitor mixture (Roche Biosciences, Stockholm, Sweden). The cell lysate obtained by centrifugation at 50 000g for 20 min followed by an ultracentrifugation step at 100 000g for 1 h was loaded onto an Ni2+-loaded Hi-Trap Chelating column (GE Healthcare, Uppsala, Sweden) equilibrated in buffer A containing 20 mM Tris, 500 mM NaCl, 2 mM TCEP pH 7.4. His-tagged YegS was washed with 5% elution buffer (buffer A plus 500 mM imidazole) and eluted with a linear gradient. The peak fractions containing YegS were pooled and applied onto a HiPrep 26/60 Superdex 200 gel-filtration column (GE Healthcare, Uppsala, Sweden) equilibrated in GF buffer (20 mM Tris, 2 mM TCEP pH 7.5). Fractions containing YegS were concentrated to approximately 20 mg ml−1 using an Amicon Ultra device (Millipore, Bedford, MA, USA) and were stored in GF buffer. The 25-residue N-terminal and eight-residue C-terminal tags were not cleaved off prior to crystallization trials. The purified YegS exhibited a single band on SDS–PAGE analysis.
2.2. Crystallization
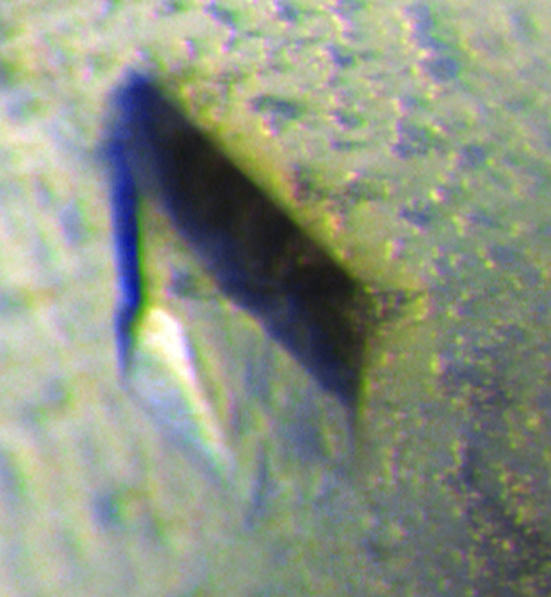
Initial crystals of YegS were obtained at 293 K by the sitting-drop vapour-diffusion method in Intelliplates (Art Robbins Enterprises, Mountainview, CA, USA) using the Index HT screen from Hampton Research (Laguna Niguel, CA, USA). Condition G10 [0.2 M magnesium chloride, 0.1 M Bis-Tris pH 5.5, 25%(w/v) PEG 3350] yielded numerous rod-shaped small crystals that grew in clusters. Optimization of crystal size and morphology were relatively unsuccessful, but after two months bipyramidal crystals (0.1 × 0.1 × 0.3 mm; Fig. 1 ▶) grew from old crystals apparently by epitaxial nucleation in a hanging-drop vapour-diffusion setup in which 20 mg ml−1 protein in GF buffer had been mixed in a 1:1 ratio with a reservoir containing 0.2 M magnesium chloride, 0.1 M Bis-Tris pH 5.5, 20%(w/v) PEG 3350.
Figure 1.
Crystal of recombinant E. coli YegS. The crystal shown is 0.3 mm in the largest dimension.
2.3. Data collection and analysis
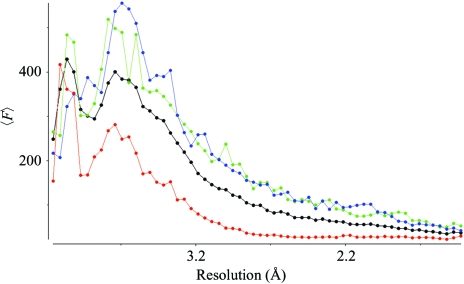
A single relatively large crystal (0.1 × 0.1 × 0.25 mm) was mounted in a nylon loop (Hampton Research, Laguna Niguel, CA, USA) and cooled directly by plunging into liquid nitrogen. Diffraction was at first streaky but improved after two rounds of annealing (Harp et al., 1998 ▶) by blockage of the cryostream for 3 s. Diffraction data were collected on beamline ID14-4 (ESRF, Grenoble, France) to a resolution of 1.9 Å (Table 1 ▶). YegS from E. coli crystallized in space group P21, with unit-cell parameters a = 42.4, b = 166.1, c = 48.5 Å, β = 96.97°, suggesting that there are two protein molecules in the asymmetric unit, giving a V M value of 2.5 Å3 Da−1 (Matthews, 1968 ▶) corresponding to a solvent content of 50.8%. Data integration was performed with MOSFLM (Leslie, 1992 ▶), scaling with SCALA (Evans, 1993 ▶) and conversion to amplitudes with TRUNCATE (French & Wilson, 1978 ▶). The fall-off plot from TRUNCATE showed a high degree of anisotropy (Fig. 2 ▶) with essentially 2.8 Å data in the direction of the a* axis. Since YegS displays no sequence homology to any protein with known structure, we are currently expressing selenomethionine-substituted YegS in E. coli with the aim of determining the structure by SAD or MAD phasing (Hendrickson, 1985 ▶).
Table 1. Data-collection statistics.
Values in parentheses are for the highest resolution shell.
| Wavelength (Å) | 0.9393 |
| Resolution (Å) | 48–1.9 (2.0–1.9) |
| Unique/observed reflections | 50910/132620 |
| Completeness (%) | 97.7 (96.0) |
| 〈I/σ(I)〉 | 12.0 (2.1) |
| Rsym† (%) | 5.8 (30.3) |
R
sym = 
 , where I
i(hkl) is the ith observation of the reflection I(hkl) and 〈I(hkl)〉 is the mean intensity of the reflection.
Figure 2.
The fall-off of mean F values as a function of resolution in three orthogonal directions as calculated by TRUNCATE from the CCP4 suite (Collaborative Computational Project, Number 4, 1994 ▶). The three mutually perpendicular directions are D1 (blue), b* axis; D2 (green), perpendicular to the a* and b* axes; D3 (red), perpendicular to b* and D2 (essentially the a* axis in this case). An overall fall-off for all reflections is shown in black.
Acknowledgments
We thank Joanne McCarthy for support during data collection at ID14-4, ESRF, Grenoble, France. We also thank the Swedish Research Council, the Wallenberg Consortium North and the EU Framework V Network SPINE for financial support.
References
- Abe, T., Lu, X., Jiang, Y., Boccone, C. E., Qian, S., Vattem, K. M., Wek, R. C. & Walsh, J. P. (2003). Biochem. J.375, 673–680. [DOI] [PMC free article] [PubMed] [Google Scholar]
- Collaborative Computational Project, Number 4 (1994). Acta Cryst. D50, 760–763. [Google Scholar]
- Evans, P. R. (1993). Proceedings of the CCP4 Study Weekend. Data Collection and Processing, edited by L. Sawyer, N. Isaacs & S. Bailey, pp. 114–122. Warrington: Daresbury Laboratory.
- French, S. & Wilson, K. (1978). Acta Cryst. A34, 517–525. [Google Scholar]
- Goto, K. & Kondo, H. (2004). Adv. Enzyme Regul.44, 187–199. [DOI] [PubMed] [Google Scholar]
- Harp, J. M., Timm, D. E. & Bunick, G. J. (1998). Acta Cryst. D54, 622–628. [DOI] [PubMed] [Google Scholar]
- Hendrickson, W. A. (1985). Trans. Am. Crystallogr. Assoc.21, 11–21.
- Knaust, R. K. & Nordlund, P. (2001). Anal. Biochem.297, 79–85. [DOI] [PubMed] [Google Scholar]
- Labesse, G., Douguet, D., Assairi, L. & Gilles, A. M. (2002). Trends Biochem. Sci.27, 273–275. [DOI] [PubMed] [Google Scholar]
- Leslie, A. G. W. (1992). Jnt CCP4/ESF–EACBM Newsl. Protein Crystallogr.26
- Matthews, B. W. (1968). J. Mol. Biol.33, 491–497. [DOI] [PubMed] [Google Scholar]
- Tobbell, D. A., Middleton, B. J., Raines, S., Needham, M. R., Taylor, I. W., Beveridge, J. Y. & Abbott, W. M. (2002). Protein Expr. Purif.24, 242–254. [DOI] [PubMed] [Google Scholar]


