Abstract
Atomic force microscopy in a force-spectroscopy mode has been used to investigate the kinetics of the adsorption process of fibrinogen molecules on a silica surface. An original “approach/retraction” cycle of the tip/surface was used for this purpose. Fibrinogen molecules were adsorbed on the atomic force microscopy tip and were brought into contact with the silica surface for different interaction times varying from 5 to 2,000 ms. Multiple consecutive ruptures were observed. The mean number of ruptures nr per cycle increases steadily with the interaction time as well as the mean strength fr which varies from 300 pN for 5 ms to 1,400 pN for 2,000 ms. The minimal interaction time for a fibrinogen molecule to bind strongly to a silica surface during an adsorption process appears to lie between 50 and 200 ms. The histograms of the distances between two consecutive ruptures in one cycle exhibit maxima around 20–25 nm. This length is comparable to the characteristic distance between D and E globules of one fibrinogen molecule and suggests that fibrinogen molecules mainly adsorb through their D and E globules.
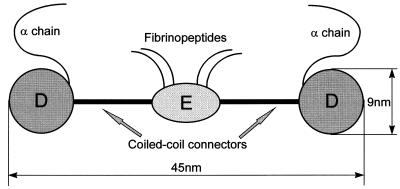
Protein adsorption plays a major role in the biocompatibility properties of any material, and many people have striven to find some general rules governing these processes. For example, proteins adsorb in general more strongly on hydrophobic surfaces than on hydrophilic ones (1–3). During adsorption processes globular proteins generally undergo some conformational changes (4, 5). However, it is still not possible to predict the behavior of a specific protein with a specific material. This fact is partly because each protein has a different structure, the forces contributing to the adsorption process are not clearly identified, and a precise picture does not exist of the way a given protein interacts with a surface. Moreover, to adsorb onto a surface, a protein must interact with it for a sufficiently long time to allow binding. The characteristic times of such binding processes are of primary importance in the adhesion processes of cells or bacteria on surfaces, but little is known about their orders of magnitude (6, 7). The aim of this report is to provide a molecular picture of a binding process during protein adsorption. Here we use atomic force microscopy (AFM) in a force-spectroscopy mode with an original “approach/retraction” cycle for the purpose. We have chosen fibrinogen for our study. Fibrinogen, which is schematically represented in Fig. 1, is a plasma protein, which has a major role in blood clotting (8–10).
Figure 1.
Schematic representation of the fibrinogen molecule. It is composed of three globules connected by two regions formed of supercoiled alpha helixes. The two terminal globules, called D fragments, are composed of two compactly folded chains (β and γ). Each terminal region also contains an α chain that is hydrophilic and floats loosely in the solution. The central globule is called the E fragment. The mean distance between the E and one D globule is approximately 22 nm. In the presence of thrombin the fibrinogen molecules polymerize to form a three-dimensional network, one E fragment being able to interact with the terminal D fragments of four other fibrinogen molecules.
MATERIALS AND METHODS
Human fibrinogen (F-4883) was purchased from Sigma. The purity of the sample was checked by AgNO3-stained SDS/PAGE. In particular, no band corresponding to thrombin could be detected. It thus was used without further purification. The protein solutions were prepared by dissolving 20 mg of fibrinogen in 100 ml of 50 mM PBS buffer in the presence of 150 mM NaCl with the pH adjusted to 7.5. All the chemicals were of analytical grade and used without further purification. The buffer solutions were prepared with deionized super Q Millipore water and systematically filtered through a membrane (Millex, Millipore) with a pore size of 0.22 μm and stored at 4°C until use.
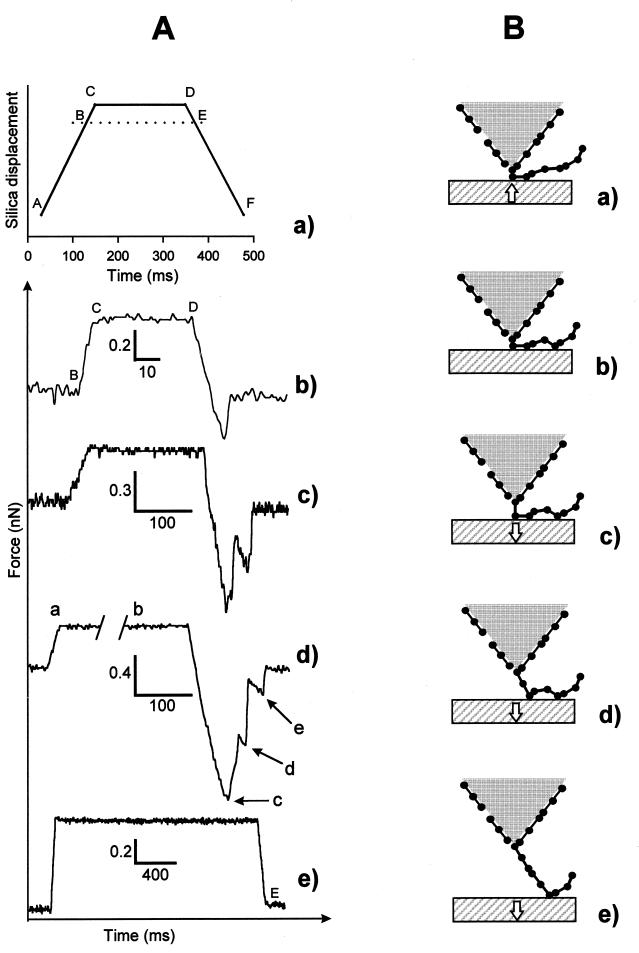
The experiments were performed on a homemade (European Molecular Biology Laboratory, Heidelberg) AFM working in a force-spectroscopy mode (11, 12). The cantilevers (model MLCT-AUHW, Park Scientific, Sunnyvale, CA) used for the different experiments came from the same row of the same wafer. By using the thermal fluctuation technique (13) we could verify that the spring constants used here were of 30 ± 5 mN⋅m−1 consistent with the value given by the manufacturer (30 mN⋅m−1). Our instrument allows to apply an approach/retraction cycle in which the interaction time between the tip and the surface can be varied. The typical evolution with time of the position of the surface mounted on the piezoelectric device is represented in Fig. 2Aa for a loading time of 200 ms. In Fig. 2Aa, AC, CD, and DF correspond respectively to the approach, loading, and retraction phases. Both the approach and the retraction are performed at a speed of 2 nm⋅ms−1 independent of the loading time.
Figure 2.
(A) A typical evolution of various quantities during one approach/retraction cycle. (a) The position of the silica surface as a function of time for a loading time of 200 ms. The curves b-d correspond to the force between the fibrinogen-coated tip and the bare silica surface as a function of time for various loading times: (b) δt = 50 ms, (c) δt = 200 ms, (d) δt = 1,000 ms. The curve e shows the force as a function of time (δt = 2,000 ms) measured between a bare silica surface and a bare tip. AC, CD, and DF correspond to the approach, loading, and retraction phases, respectively. Both the approach and the retraction are performed at a speed of 2 nm⋅ms−1 independent of the loading time. At point B the surface enters into contact with the tip and the force increases steadily until it reaches point C. The loading time δt = t(D) − t(C). At point E the tip looses contact with the surface when no attractive interaction exists between the tip and the surface, which is the case when the tip is uncoated (curve e). Thus, the contact time between the fibrinogen molecules adsorbed on the tip and the silica surface is not equal to the loading time but in fact to t(E) − t(B). Because t(C) − t(B) = t(E) − t(D) ⩬ 15 ms, the loading time is not equal to contact time, which is approximately t(E) − t(B), between the fibrinogen molecules adsorbed on the tip and the surface. The differences are small for longer loading times (>200 ms) but can become significant for small contact times. For a fibrinogen-coated tip, the measured force on the tip becomes negative after the point E, which indicates a binding between the protein and the surface. Points c, d and e in curve d correspond to various ruptures during one cycle. (B) Shown schematically is the postulated interaction process between the coated tip and the bare silica surface explaining our experimental results. This representation is made in correspondence with the force curve Ad. (a) The beginning of the loading phase where the first fibrinogen molecule from the polymeric chain is squeezed between the tip and the surface. (b) Other fibrinogen molecules from the polymeric chain can diffuse toward the surface and bind to it at a later time during the loading phase. c corresponds to the first observed rupture that takes place at the squeezed molecule during the retraction phase. (d and e) The second and third rupturing processes. The strength of the ruptures decreases usually, but not always, with their order of appearance because the further away a fibrinogen molecule is from the squeezed one, the longer it takes, on the average to diffuse to the surface.
The experiments were performed as follows: Fibrinogen was first adsorbed on the Si3N4 crystal, forming the AFM tip, by incubating the cantilevers in the fibrinogen solution for 3 hr. The coated tip then was brought into contact with an interaction surface, a hydrophilic silica surface (glass coverslip, Marienfeld, Bad Mergentheim, Germany), in pure buffer. Before use, the glass surface was in contact with pure buffer over 1 night for equilibration. The contact between the tip and the surface was indicated by a positive deflection of the cantilever (point B in Fig. 2Ab). Once point C in the approach/retraction cycle was reached (Fig. 2A a and b) the position of the surface was held fixed for a loading time δt = t(D)−t(C) before the surface was again retracted. Five values of δt were investigated (5, 50, 200, 1,000, and 2,000 ms) in five independent experiments. The loading force applied during the time δt was constant and equal to 650 ± 150 pN. Typical experimental force curves for different loading times are represented in Fig. 2A b–d. For each loading time, except for 2,000 ms, about 100 consecutive approach/retraction cycles were performed (see Table 1). For the experiment with a loading time of 2,000 ms, two sequences of about 50 cycles each were performed at two different locations on the silica surface. The total duration of an experiment was always of the order of a few minutes. It can be pointed out that the real contact time between the proteins on the tip and the surface were not rigorously equal to the loading time δt. Indeed, in our experiments, during the approach and the retraction procedure, proteins were in contact with the surface during approximately 30 ms (see Fig. 2Aa). The interaction time was thus of the order of δt + 30 ms, δt representing the loading time. This effect is especially important for the low δt(= 5 ms). It also can be pointed out that as fibrinogen is a molecule whose typical dimensions are 5 × 9 × 45 nm3 (8) and as the cantilever ends with a root-type shape not longer than 50 nm, only a small number of fibrinogen molecules are expected to interact with the surface.
Table 1.
Tabulation of the number of force curves carried out for the different loading times and their corresponding mean number of ruptures per cycle
| Loading time, ms | Number of force curves | Number of rupture forces | Number of rupture forces per cycle | Number of force curves with multiple ruptures |
|---|---|---|---|---|
| 5 | 148 | 176 | 1.19 | 17 |
| 50 | 97 | 116 | 1.20 | 12 |
| 200 | 88 | 194 | 2.20 | 65 |
| 1,000 | 97 | 251 | 2.59 | 89 |
| 2,000 | 110 | 331 | 3.00 | 104 |
RESULTS AND DISCUSSION
Fig. 2A b–d represents typical force curves between a fibrinogen-coated tip and a bare silica surface. They clearly show that the rupture between the protein-coated tip and the silica surface is a multiple-step process for loading times larger than 200 ms. Before going further into the analysis of the force curves, we have to examine some major points.
Control Experiments.
We first have to prove that during a whole sequence of approach/retraction cycles we are indeed measuring the interaction between the silica surface and the fibrinogen adsorbed on the tip. Indeed, after the first cycles, the protein could be adsorbed on the silica surface. The apparatus being not stabilized laterally, the tip could move slightly parallel to the surface over the whole sequence of cycles. One thus would end up in the configuration of the bare tip interacting with a bare silica surface. We thus first measured the force curve between a bare silica surface and a bare tip in the presence of pure buffer and no adhesion force can be detected (see Fig. 2Ae). This observation is consistent with the findings of Hoh et al. (14). We then performed two consecutive sequences of 50 cycles with a fibrinogen-coated tip by translating the tip parallel to the silica surface between the two sequences. The loading time was chosen equal to 2,000 ms. Both sequences exhibit the same characteristic force curves with multiple ruptures that are definitely different from the force curves measured with an uncoated tip. This finding proves that we are indeed always measuring the force curve between a fibrinogen-coated tip and a bare silica surface. Moreover, the mean loading forces were equal to 691 pN and 796 pN, respectively, during the first and second sequences of cycles. Both exhibit rupture forces of the same magnitude (1,436 pN and 1,267 pN, respectively), which are statistically indistinguishable, indicating that a 15% change of the loading force does not affect significantly our results.
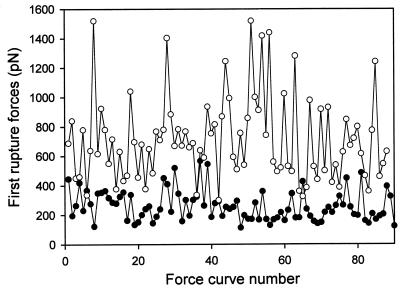
We also have to prove that there is no “aging” effect of the proteins on the surface during the whole sequence of approach/retraction cycles. This is demonstrated by the fact that the values of the measured rupture forces remain constant on the average over the entire experiment and do not show a systematic deviation (see Fig. 3).
Figure 3.
Typical evolution of the strength of the first rupture forces during one sequence of approach/retraction cycles as a function of their appearance number in the sequence for two experiments: ● for δt = 50 ms; ○ for δt = 200 ms. Because no systematic deviation of the strength of forces occurs during the whole sequence of cycles proves that there is no aging during the experiment.
Analysis of the Adsorption Process.
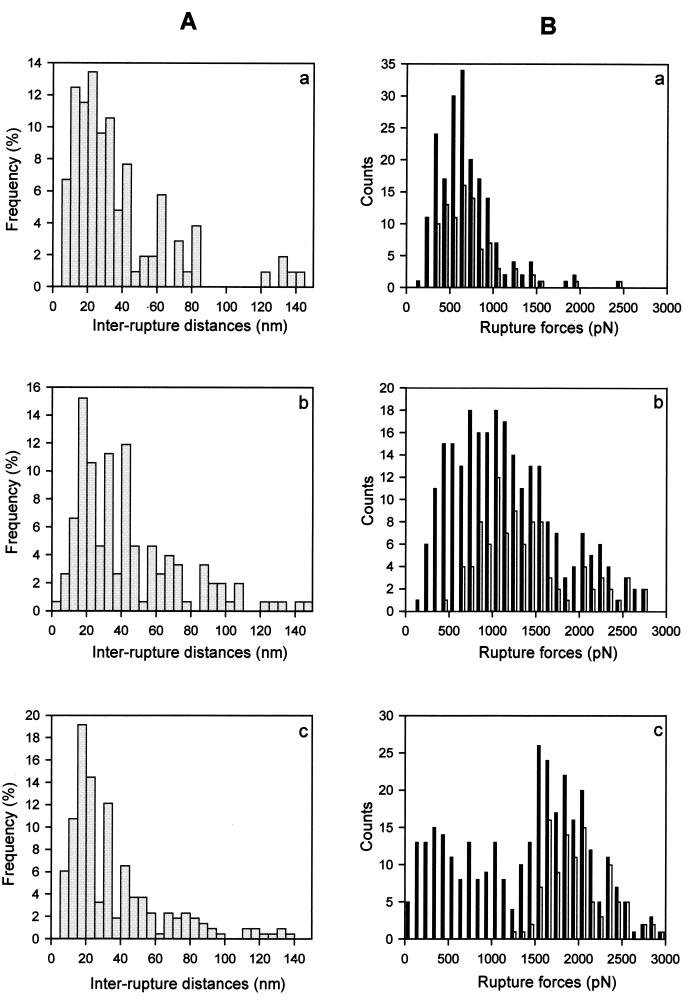
The number of ruptures per measurement cycle increases with the interaction time, as summarized in Table 1. For the interaction times of 5 and 50 ms usually only one rupture is observed per measurement cycle whereas larger loading times mainly exhibit multiple ruptures. Fig. 4 shows the histograms of the distances between these consecutive ruptures for loading times larger then 200 ms. For δt = 5 ms and 50 ms, the number of multiple ruptures is too small for a histogram to be statistically significant. In each histogram a maximum is observed for inter-rupture distances between 15 and 25 nm. These distances are typical for the spacing between the D and the E fragments of the fibrinogen molecule. Moreover almost no inter-rupture distances smaller than 10 nm are observed, which seems to indicate that fibrinogen molecules interact with the silica surface mainly through their D and E fragments.
Figure 4.
(A) Histograms of the inter-rupture distances during multiple rupture events for the three loading times for which a significant number of multiple ruptures occurred: (a) 200 ms, (b) 1,000 ms, (c) 2,000 ms. Each of these histograms exhibits a maximum for an inter-rupture distance on the order of 20–25 nm, which corresponds to the typical distance between D and E fragments of a fibrinogen molecule. (B) Histograms of the rupture forces corresponding to different loading times: (a) 200 ms, (b) 1,000 ms, (c) 2,000 ms. Filled bars correspond to all the measured rupture forces, and the empty bars correspond only to the first rupture force.
Two possible ways of interaction might be considered for the forces between the silica surface and the coated tip: the forces could act either in parallel or in series. However, the parallel model must be discarded because (i) during one cycle the total distance of surface displacement over which ruptures were measured can be as large as 200 nm, which is much larger than the largest dimension of a single fibrinogen molecule. (ii) If the forces acted in parallel there would be no reason for two consecutive ruptures not to be separated by an inter-rupture distance smaller than 10 nm. (iii) Force curves have been observed where the strengths of the consecutive rupture forces during one cycle do not decrease with the rupture number. Moreover, the first observation implies that more than one fibrinogen molecule must be involved in the cycles in which multiple ruptures are exhibited, indicating that the proteins form a kind of “polymeric chain” attached on the surface and dangling into the solution (Fig. 2B). Such a polymerization process would be expected in the presence of thrombin. However, the fibrinogen solution appeared to be pure by gel electrophoresis, and no thrombin could be detected. The “polymerization” mechanism noted in our experiment is thus unclear. A kind of polymer network has been observed previously in the absence of thrombin for fibrinogen molecules adsorbed on hydrophobic surfaces for 15 days (15). Yet whether the process involved here is of similar nature needs further study.
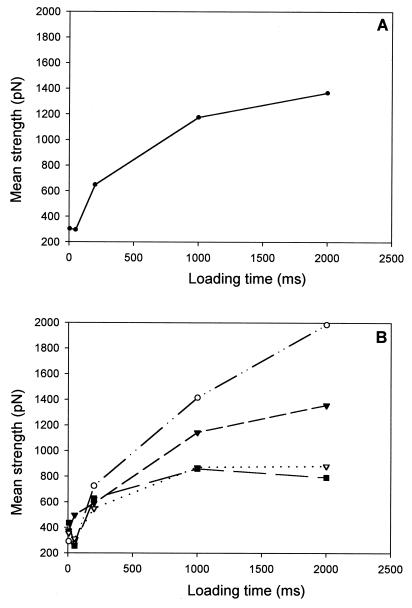
Our experiments show that the mean rupture forces increase in strength with the loading time (see Fig. 5A). For small contact times the rupture forces are of the order of 300 pN, which corresponds typically to the strength of hydrophobic interaction forces (16). For interaction times of 2,000 ms, the mean strength of the rupture forces is of the order of 1,400 pN. This large value may explain why fibrinogen adsorbs so readily on most surfaces. Fig. 5B shows, for multiple ruptures during one cycle, that the average force decreases with each consecutive rupture and that, for a given rupture appearance number during a cycle, the strength of the force increases with the interaction time. This work provides a visualization at a molecular level of the anchoring process of proteins on a solid surface during adsorption.
Figure 5.
Evolution of the mean values of the rupture forces as a function of the loading times. (A) All the measured rupture forces. (B) ○, first rupture force; ▾, second rupture force; ▿, third rupture force; ■, fourth rupture force.
The experimental results can be interpreted as follows: for long interaction times, it can be assumed that the multiple interactions all do not form simultaneously. Because of the shape of the tip one can imagine that the proteins on the top of the tip-crystal interact first with the silica whereas molecules that lie slightly further away need more time to reach the surface for interaction (see Fig. 2B). The distribution of the measured forces thus should become broader as the loading time increases and this is indeed observed experimentally (see Fig. 4B). In contrast, the first rupture force measured during an approach/retraction cycle exhibits a much more narrow force distribution whose average value increases systematically with the interaction time. This finding is indeed expected from our interpretation in terms of a polymeric chain interacting with the surface. The fragment of the chain that first interacts with the silica surface, and thus has the longest interaction time (close to δt), will be the one that is partially squeezed between the tip and the surface and the one that will break off first (see Fig. 2B). Because of the squeezing, this first rupture force does not provide the characteristic time of interaction required for a fibrinogen molecule to bind to the surface during a normal adsorption process. The curvature radius of the tip and the length of a fibrinogen molecule being similar, adsorption conditions should merely be satisfied for the second and even more for the third and subsequent ruptures. However, multiple ruptures per cycle are mainly observed for contact times strictly larger than 50 ms (Table 1). Our experiments thus suggest that the minimal interaction time needed for a fibrinogen molecule to bind strongly to a silica surface lies between 50 and 200 ms. This value also is confirmed by the fact that for an interaction time of 200 ms no great variation of the rupture forces can be observed in consecutive ruptures (Fig. 5B). All of the links must have approximately the same existence time, which is of the order of 200 ms.
In addition, from our interpretation in terms of a polymeric chain one would expect that the further a fragment of a fibrinogen molecule (from one polymer chain) is located from the fragment interacting first with the surface, the longer it will take on the average to reach the silica surface, thus also reducing its interaction time. This hypothesis implies that the average rupture force should decrease with its rupture appearance number, which is effectively observed in Fig. 5B.
We do not have a direct access to the binding free energy through AFM, the rupture force corresponding rather to the steepest slope on the free energy profile along the binding pathway (17). By assuming a typical interaction distance di of the order of 0.5 nm between the residues interacting with the silica surface and the surface itself, one nevertheless can obtain a rough estimate of the binding Gibbs free energy ΔGb = Fr⋅di from our values of the rupture force Fr. This free energy is of the order of 40 kT (resp. 200 kT) for a rupture force of 300 pN (resp. 1,400 pN). The number of residues per fibrinogen molecule interacting with a silica surface was estimated to vary between 180 and 700 (18). If one assumes that one of the three globules of a molecule is involved in a rupture measured in our experiments, one obtains a binding Gibbs free energy per residue that is of the order of 0.2 kT.
CONCLUSIONS
By using AFM in a force-spectroscopy mode we could visualize the anchoring process of fibrinogen on a silica surface during adsorption. The minimal interaction time for a protein to establish a strong interaction appears to lie between 50 and 200 ms, and the fibrinogen molecules seem to adsorb through their D and E globules.
Acknowledgments
P.S. acknowledges the Institut Universitaire de France for financial support. This work was supported by the program “Matériaux” (98N42) of the Centre National de la Recherche Scientifique and the Institut National de la Santé et de la Recherche Médicale.
ABBREVIATION
- AFM
atomic force microscopy
References
- 1.Prime K L, Whitesides G M. Science. 1991;252:1164–1167. doi: 10.1126/science.252.5009.1164. [DOI] [PubMed] [Google Scholar]
- 2.Haynes C A, Norde W. Colloids Surf B Biointerfaces. 1994;2:517–566. [Google Scholar]
- 3.Sagvolden G, Giaever I, Feder J. Langmuir. 1998;14:5984–5897. [Google Scholar]
- 4.Buijs J, Norde W, Lichtenbelt J W T. Langmuir. 1996;12:1605–1613. [Google Scholar]
- 5.Hlady V, Buijs J. In: Biopolymers at Interfaces. Malmstem M, editor. New York: Dekker; 1998. pp. 181–220. [Google Scholar]
- 6.Pierres A, Benoliel A M, Bongrand P, van der Merwe P A. Proc Natl Acad Sci USA. 1996;93:15114–15118. doi: 10.1073/pnas.93.26.15114. [DOI] [PMC free article] [PubMed] [Google Scholar]
- 7.Pierres A, Feracci H, Delmas V, Benoliel A M, Thiery J-P, Bongrand P. Proc Natl Acad Sci USA. 1998;95:9256–9261. doi: 10.1073/pnas.95.16.9256. [DOI] [PMC free article] [PubMed] [Google Scholar]
- 8.Doolittle R F. Sci Am. 1981;245:92–101. doi: 10.1038/scientificamerican1281-126. [DOI] [PubMed] [Google Scholar]
- 9.Spraggon G, Everse S J, Doolittle R F. Nature (London) 1997;389:455–462. doi: 10.1038/38947. [DOI] [PubMed] [Google Scholar]
- 10.Everse S J, Spraggon G, Doolittle R F. Thromb Haemost. 1998;80:1–9. [PubMed] [Google Scholar]
- 11.Moy V T, Florin E-L, Gaub H E. Science. 1994;266:257–259. doi: 10.1126/science.7939660. [DOI] [PubMed] [Google Scholar]
- 12.Radmacher M, Fritz M, Cleveland J P, Walters D A, Hansma P K. Langmuir. 1994;10:3809–3814. [Google Scholar]
- 13.Florin E-L, Rief M, Lehmann H, Ludwig M, Dornmair C, Moy V T, Gaub H E. Biosens. Bioelectron. 1995. , 895–901. [Google Scholar]
- 14.Hoh J H, Revel J-P, Hansma P K. Nanotechnology. 1991;2:119–122. [Google Scholar]
- 15.Wigren R, Elwing H, Erlandsson R, Welin S, Lundström I. FEBS Lett. 1991;280:225–228. doi: 10.1016/0014-5793(91)80298-h. [DOI] [PubMed] [Google Scholar]
- 16.Vinckier A, Gervasoni P, Zaugg F, Ziegler U, Lindner P, Groscurth P, Plücktun A, Semenza G. Biophys J. 1998;74:3256–3263. doi: 10.1016/S0006-3495(98)78032-4. [DOI] [PMC free article] [PubMed] [Google Scholar]
- 17.Grubmüller H, Heymann B, Tavan P. Science. 1996;271:997–999. doi: 10.1126/science.271.5251.997. [DOI] [PubMed] [Google Scholar]
- 18.Morrissey B W, Stromberg R R. J Colloid Interface Sci. 1974;46:152–164. [Google Scholar]


