Abstract
Two surfaces that come in close contact in a solution with macromolecules present experience an attractive force caused by the osmotic pressure. We present a measurement of this effect by using a micrometer-sized sphere bound to a flat plate through a single molecular attachment in an albumin-containing solution. We obtain the osmotic part of the interaction potential with a resolution of <1 nm and a fraction of kTroom. This attractive interaction is seen to have a range comparable to the size of the albumin molecule. The results are broadly in agreement with a geometric model first proposed by Asakura and Oosawa.
Osmotic pressure is a subtle, ubiquitous phenomenon that is relevant at scales extending from molecules to cells and tissues. In polymer physics, osmotic pressure measurements provided a most elegant determination of molecular weights (1). For sufficiently low concentrations, the osmotic pressure follows an “ideal gas” (van’t Hoff) law
 |
1 |
where p is the osmotic pressure, N/V is the number of particles per unit volume, k is the Boltzmann constant, and T is the temperature. Writing this formula in terms of the concentration in weight per unit volume, one sees that through p, one can measure the molecular weight. For larger concentrations the next term in this expansion, α (N/V)2, may become important; in particular, for swollen polymers, the coefficient of this term, which is related to the excluded volume parameter, is large. Therefore, from a macroscopic measurement of osmotic pressure, one can obtain information on the molecular conformation of the dissolved polymer (1). In biological systems, a proper osmotic pressure balance is essential for the correct functioning of cells and tissues; in fact, cells have evolved special mechanisms (ion pumps) to regulate the osmotic pressure build-up that results from the presence in the cytoplasm of a large concentration of proteins and other charged molecules with their associated counterions (2).
The protein we use in this study, albumin, has a special role in regulating the osmotic pressure balance at the level of blood vessels, because it is the largest protein constituent of plasma and is present at a concentration of ≈40 mg/ml (≈0.6 mM). Indeed, an abnormal deficiency of albumin can lead to water passing from the bloodstream into the tissues (edema). The classic situation in which one views osmotic pressure involves two compartments separated by a semipermeable membrane. However, the effect is present whenever there is a concentration gradient; for instance, the electrostatic attraction between similarly charged surfaces in an electrolyte solution is actually an osmotic pressure effect because of the counterion’s concentration profile (3). Another situation, which is the one we study here, is when two surfaces come so close that they exclude the solute particles from the gap between them. The osmotic pressure acting on the excluded area gives rise to an attractive force. Thus, the addition of polymers to colloidal suspensions can lead to flocculation and generally to changes the phase behavior of the system (4–6). This effect is important with deformable surfaces also; one of us has shown that the lamellar Lα phase of surfactant–water systems is strongly affected by the addition of polymers, leading to a reduction of the interlamellar spacing because of the osmotic pressure attraction (7, 8). Thus, a red blood cell that comes close (≈5 nm) to the blood vessel wall presumably experiences an attractive force because of the osmotic pressure.
This depletion interaction has been addressed by several studies that used different techniques allowing a direct measurement of forces between surfaces: the surface force apparatus (9–11), the atomic force microscope (12), and tracking of the motion of a microscopic bead using optical techniques [video microscopy (13), evanescent wave optics (14, 15), optical tweezers (16, 17)]. By using a micrometer-sized bead attached to an atomic force microscope tip, Milling and Biggs (12) measured the distance dependence of the depletion force with swollen neutral polymers in solution. Their results compare favorably with the Asakura–Oosawa model (18). Other measurements on swollen polymer systems are those of Kuhl et al. (10), who used the surface force apparatus and, like Milling and Biggs (12) and ourselves, worked at close distances (<20 nm), as did Rudhardt et al. (15) and Oshima et al. (16). Previously, Richetti and Kekicheff (9) had measured depletion forces with the surface force apparatus by using charged micelles in solution. They also observed oscillatory forces at larger separations caused by particle-packing effects. Kaplan et al. (13) used charged polystyrene beads, and Sharma and Walz (14) used charged silica beads, to create the osmotic pressure. The former observed the depth of the interaction potential under conditions of relatively high screening, the latter the whole distance dependence of the potential in a regime where long-range electrostatic effects are important. Recently, Verma et al. (17) used long DNA strands (λ-DNA) and observed the depletion interaction at micrometer-size separations between two spheres.
In the present study, we work at close separations (≈5–15 nm), in the physiologically relevant regime of nanometer-sized solute particles (globular proteins) and high ionic strength (small electrostatic screening length). To do this, we work with a micrometer-sized sphere bound to a plate through a single molecular attachment. We present detailed measurements of how the interaction potential between the sphere and the flat surface is modified by the osmotic pressure because of BSA in solution. As mentioned earlier, albumin is a physiologically relevant molecule with respect to this effect.
The basic experimental setup we use has been described (19, 20) in the context of different measurements. It centers on following the (confined) Brownian motion of a micrometer-sized bead close to a plate by using an evanescent wave optical technique to achieve subnanometer resolution in displacement. We measure the vertical (i.e., perpendicular to the plate) position of the bead (a 4- to 6-μm diameter glass sphere) relative to the plate in the course of time, h(t). From this time series, we obtain the probability distribution p(h) for the bead to be a distance h from the plate. This is related to the interaction potential φ between the bead and the plate by p(h) α exp(−φ(h)/kT). One can thus measure φ(h) with a resolution of a fraction of 1 kT in energy and a fraction of 1 nm in distance. The glass bead is in a flow cell formed between a microscope slide and coverslip separated by 0.4-mm-thick spacers. The evanescent wave is created by total internal reflection of a He–Ne laser beam off the glass–water interface that forms the bottom of the cell. One measures the intensity of the light scattered by the bead, which is illuminated by the evanescent wave. Because the incident intensity drops off exponentially with distance h, the scattered intensity also varies exponentially: Isc α exp(−h/Δ); here, h is the distance between the plate and the bead, and Δ is the penetration depth of the evanescent wave, which in our setup is Δ = 86 nm. Thus, the scattered intensity is a sensitive measure of the distance h; in our setup we have a resolution of 2 Å in a bandwidth of 100 Hz. The scattered light is collected by a microscope objective and focused on a photodiode. There are many beads in the cell, but only one bead at a time in the field of view of the photodiode.
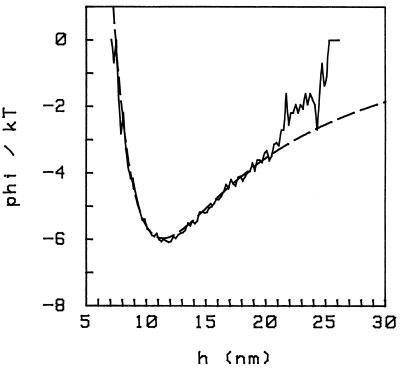
The interaction between the sphere and the plate is, at large enough distances, described well by the Derjaguin–Landau–Verwey–Overbeek (DLVO) potential (3), which is a sum of Van der Waals attraction, α 1/h caused by the geometry (sphere against a plate), and electrostatic repulsion, α exp(−h/δ) caused by the screening effect of ions in solution. δ is the Debye length, which varies with the square root of the ionic strength. In Fig. 1 we show a measured interaction potential, together with the fit to a DLVO form:
 |
2 |
G depends on the surface charge and ionic strength, and A depends on the Hamaker constant; both G and A are linear in the size of the sphere.
Figure 1.
Interaction potential for a 6-μm-diameter glass sphere close to a glass plate, in units of kT , where T is room temperature and h is the distance between the bottom of the sphere and the plate in nm. The conditions are: PBS at an ionic strength of [Na+] = 25 mM (PBS/6), pH 7.4.
The data shown were obtained with a glass sphere 3 μm in radius (Polysciences); both the sphere and the plate were covered with a monolayer of albumin to prevent sticking; the solution is PBS at pH 7.4 with an ionic strength ([Na+]) of 25 mM (called PBS/6 in the following, as it is standard PBS diluted 1:6); the corresponding Debye length is δ ≈ 1.87 nm. Because we work at close distances, we don’t need to take into account retardation in the Van der Waals interaction to have a good fit; the gravitational force is also weak. The discrepancy between the experimental and theoretical curves for h > 21 nm comes because the sphere is not entirely free, as we describe below.
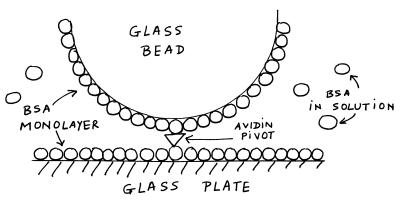
To compare the interaction potentials with and without the osmotic pressure effect, it is desirable that the sphere remains over the same patch of surface: we are working at close distances (≈10 nm), and the surfaces are not homogeneous at this scale. However, the flow necessary to change solution in the cell displaces an unbound sphere, and in addition, there is the lateral Brownian motion. To surmount this difficulty, we bind the sphere to the plate at a single point, through a single biotin–avidin–biotin contact, as depicted in Fig. 2. Namely, the plate is prepared with a very low surface coverage of biotinylated BSA (Sigma), about 1 molecule per μm2 and then saturated with a monolayer of normal BSA. The spheres are prepared in a similar way, except with a ≈100-fold larger surface concentration of biotinylated BSA. Avidin (Sigma) is introduced in the cell and then washed off, and then the spheres are introduced. We thus achieve a configuration that is a “sphere on a pivot” (Fig. 2); the sphere can still rock around the pivot, and we therefore observe height fluctuations; because the angle of this rocking motion is small (as a result of the geometry), the pivot does not provide an appreciable extra stiffness except for a constraint on the maximum height, hmax, that the sphere can reach.§ The data of Fig. 1 (and all data in the paper) were taken with this configuration; in the case of Fig. 1, hmax ≈ 25 nm. The constraint is the cause for the departure from the DLVO potential (Fig. 1, dashed line) for h > 21 nm.
Figure 2.
The geometry giving rise to the osmotic pressure attraction. The glass sphere is bound to the glass plate at a single point through a biotin–avidin–biotin connection (“pivot”). The surfaces are covered with a monolayer of BSA, and we introduce BSA in solution. We work in a range of pH in which BSA is negatively charged.
To verify that we have indeed achieved this configuration for a given sphere, we drive a flow through the cell: a sphere attached by a single point will rock down toward the plate, whereas a sphere that is not attached will move laterally and a sphere attached at several points will not rock. We show this effect in Fig. 3, where the flow is switched on and off repeatedly. Incidentally, because we measure the interaction potential and know the flow velocity, we can from this effect obtain a measurement of the drag on the sphere, which in this geometry is a nontrivial fluid mechanics problem. However, we will not detail this here.
Figure 3.
Pivoting sphere in a flow. The flow is switched on and off alternately: it is on at times (approximately) 30 < t < 60 s and 90 < t < 110 s. The effect of the flow is to press the sphere closer to the plate (by about 4 nm in this case). The vertical fluctuations are correspondingly reduced.
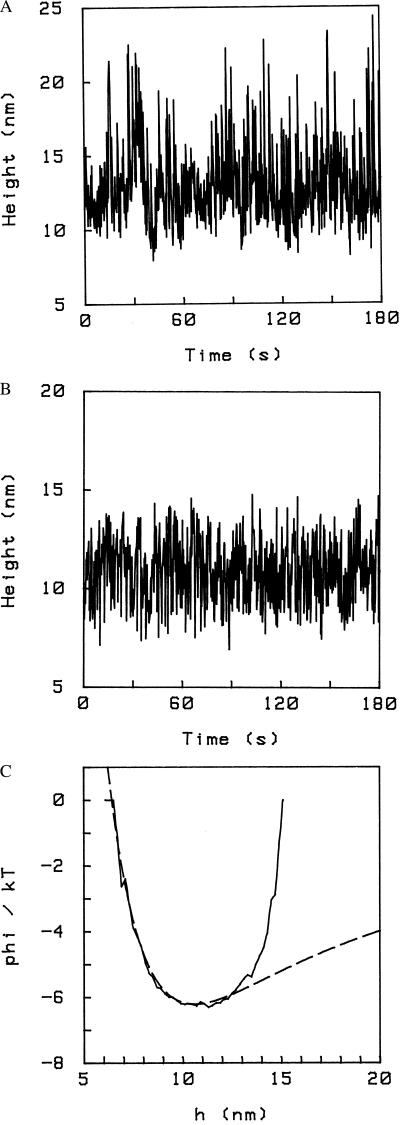
Because the surfaces are rough at the nanometer scale, the maximum height imposed by the constraint, hmax, depends on where on the surfaces the pivot lies (i.e., on top of a hill or in a valley), but typically hmax lies around the minimum of the DLVO potential corresponding to the ionic strength of the solution with which the spheres are introduced in the cell and allowed to bind: this is because the spheres spend most of their time at that height. In this case, the existence of the constraint h ≤ hmax is obvious even from the time series h(t). Fig. 4A shows a time series for a particle bound in such a way that hmax ≈ 25 nm; the corresponding potential is the one of Fig. 1. The distribution of fluctuations is skewed toward upward fluctuations, which is reflected in the shape of the potential. Fig. 4B shows a time series for a particle also attached by a single pivot under the same conditions of ionic strength and surface charge (i.e., same DLVO potential) as in Fig. 4A, but with hmax ≈ 14 nm. Obviously the upward fluctuations are impeded. In Fig. 4C we show the corresponding potential: the part to the left of the minimum is unaffected by the pivot, as shown by the dashed line, which represents the DLVO potential, but now there is a cutoff, corresponding to the constraint h ≤ hmax (the height of this “wall” is the binding energy of one biotin–avidin pair, which is ≈35 kT).
Figure 4.
(A) Time series for a pivoting particle (i.e., bound to the surface at a single point). The corresponding potential is shown in Fig. 1. Here, hmax ≈ 25 nm. The conditions are PBS/6, pH 7.4. (B) Time series for a pivoting particle. Upward fluctuations are suppressed by the constraint (h ≤ hmax ) imposed by the pivot. In this case, hmax ≈ 14 nm. Conditions are otherwise the same as in A. (C) The interaction potential corresponding to B. The cutoff h ≤ hmax is evident; hmax ≈ 14 nm. Also shown is the (unconstrained) DLVO potential (dashed line).
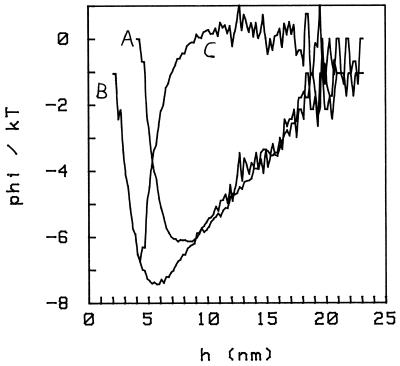
When we introduce free BSA in the cell, even at concentrations much below the physiological level in the blood, the interaction potential is significantly altered. We show the effect in Fig. 5, where we display the potential in the absence of BSA in solution (curve A) and with BSA 5 mg/ml in solution (curve B). The two curves were obtained from the same sphere, which is bound to the plate at a single pivoting point as explained above; this constraint is not seen in the potentials because, in this case, the attachment is such that hmax ≥ 23 nm. From the comparison, we conclude that (i) with BSA in solution, there is an additional attractive interaction; consequently, the minimum of the potential deepens and moves closer to the plate; and (ii) this additional interaction is present only at short distances, h ≤ h0; it is zero for h > h0 (h0 ≈ 9 nm in the case shown).
Figure 5.
Interaction potentials with (curve B) and without (curve A) 5 mg/ml BSA in solution. The osmotic pressure introduces an additional attractive force at short distances (h < 9 nm here), increasing the depth of the potential and shifting the minimum toward the plate. Curve C is the difference between the two potentials A and B, representing the osmotic contribution only. Conditions are PBS/6, pH 6.
We can be more quantitative. The simplest model for the osmotic pressure effect is purely geometric (18). Consider a sphere of radius R at a distance h from a flat surface (i.e., h is the minimum distance between the sphere and the surface), with a concentration c = N/V (number of particles per unit volume) of smaller spheres (radius a) in solution; a ≪ R. It is easy to find the excluded volume (the volume not accessible to the small spheres because they don’t fit in the gap), which is a cubic form in h , and the interaction potential is the osmotic pressure p times this excluded volume. One obtains
 |
3 |
with φ1 = p × πR2(2a − R/3) chosen so that φosmo = 0 at large distances. p is the osmotic pressure corresponding to the concentration c , which in first approximation is given by the ideal gas law (Eq. 1). For heights larger than the diameter of the small spheres (h > 2a), there is no effect because the small spheres can fit in the gap. The depth of the potential is φosmo(h = 0) ≈ − p × 4π × a2R.
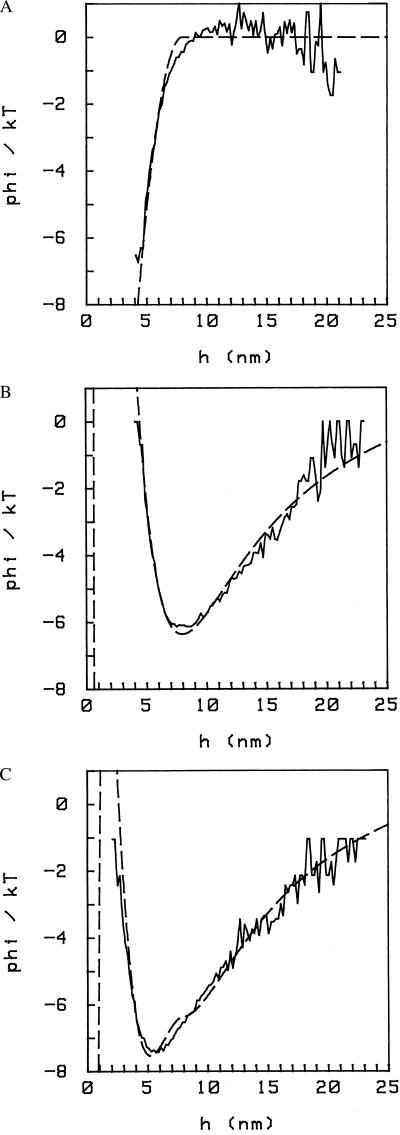
In Figs. 5 and 6, we compare this model to the experimental data. We take the difference of the two curves, A and B (Fig. 5), to isolate the contribution because of the osmotic pressure only; the result is an attractive potential which is 0 for distances beyond ≈9 nm, as expected (Fig. 5, curve C). In Fig. 6A we show again this difference potential and a fit with the form φ = φosmo given by Eq. 3; the resulting parameters are P = 2.5 × 10³ dynes/cm2 (1 dyne = 10 μN) and a = 4.0 nm. The value of p is to be compared with Eq. 1, which for BSA = 5 mg/ml gives c kT = 1.9 × 10³ dynes/cm2. This difference with our value is not significant because it can be accounted for by the indeterminacy in the sphere’s size (e.g., in the case of the data in Fig. 5, R = 3.0 ± 0.5 μm).
Figure 6.
(A) Fit of the osmotic part of the potential (curve C of Fig. 5) with a cubic form (Eq. 3) as described in the text. The resulting parameters are a = 4.0 nm (“radius” of the albumin) and P = 2.5 × 10³ dynes/cm2 (osmotic pressure). (B) Fit of the potential in the absence of BSA in solution (curve A of Fig. 5) with a DLVO form (Eq. 2). (C) Fit of the potential with BSA in solution (curve B of Fig. 5) by using Eq. 4. The repulsive part of the potential is less steep in the experiment compared to the model.
In taking the difference between the two curves A and B in Fig. 5, we are implicitly making the assumption that the presence of BSA in solution does not affect the DLVO part of the potential. We expect this to be true for the Van der Waals part of the interaction (the BSA in solution being only a small perturbation on the Hamaker constant), but the electrostatic part could well be affected by the addition of large charged macromolecules. We can check this on the data. First, we fit the potential with no BSA in solution, i.e., we determine φDLVO (Fig. 6B); this is a two-parameter fit; physically, the two parameters are the surface charge and the Hamaker constant (both terms in φDLVO are linear in the size of the sphere R). Then we fit the potential with BSA in solution, by using
 |
4 |
where φDLVO and φosmo are given by Eqs. 2 and 3 (Fig. 6C). For φDLVO, we keep the same parameters as determined previously. We then have again to fit only two parameters, namely p and a. We see already from Fig. 5 that the attractive part of the potential at large distances is the same in the two cases, whereas we note that the fit with Eq. 4 (Fig. 6C) departs from the data slightly in the repulsive part of the potential at short distances when BSA is present in solution. Another discrepancy between the simple model (Eq. 3) and the measurements can be seen in Fig. 6A. Our data consistently depart from Eq. 3 (the experiment lying below the fit) near h = 2a. It is not immediately clear which part of the model needs to be refined to obtain a better agreement here.
Returning to the values for p and a that we extract from the data, we find that in different experiments, p is consistent with Eq. 1, but a detailed comparison requires a more accurate determination of the size of the sphere, which we will undertake in the future. For a, we find values between 4 and 6 nm. This is comparable to the size of the albumin. In discussing these numbers, one has to realize that there are several complications. For the pressure, the surfaces are rough at the nanometer scale, which means that the area over which the osmotic pressure acts to produce a force can be different from the ideal geometric projection assumed in Eq. 3; that is, BSA may be able to penetrate into regions that are forbidden by the “geometric” model or, on the contrary, may be excluded from regions that are “allowed” by the model. For a, the first complication is that albumin is not a sphere, but rather a cigar-shaped object, with diameters of 8 × 4 × 4 nm (21). The second complication is that the effective size is in our context determined by electrostatic interactions (because BSA is charged), so that one should add to the geometric size a a length which, for high surface charge, will be proportional to the Debye screening length, which is not small compared with a in our case (for example, in the conditions of Fig. 5, δ ≈ 1.9 nm).
In Fig. 7, we show another case; depending on the exact conditions (size of the sphere, surface charge, ionic strength, concentration of albumin), one can go from a situation where the effect of osmotic pressure is to deepen the DLVO minimum and move it closer to the plate (Fig. 5), to a double-well situation (adumbrated in Fig. 7) where the outer minimum (farthest from the plate) is the original DLVO minimum, and the combined effect of osmotic attraction and electrostatic repulsion produces a second minimum closer to the plate. To see this, one has to choose conditions carefully; in particular, the situation is experimentally complicated by the fact that there is really also a third minimum, namely at contact (h = 0), and if the barrier that prevents the sphere from falling into it is lowered too much by the osmotic attraction, then the sphere will stick to the plate.
Figure 7.
Interaction potentials with and without 5 mg/ml BSA in solution. Conditions are PBS/6, pH 7.4. In this case, we obtain something close to a double-well potential, the outer minimum being caused by DLVO forces and the inner one by osmotic forces.
Referring to the above discussion of the effective size a, we note that from the data shown in Fig. 7, we extract the value a = 5.2 nm , larger than the value a = 4 nm of Fig. 5. This is consistent with the fact that the data in Fig. 7 are taken at pH 7.4, where BSA is more charged than at pH 6 (data in Fig. 5), the isoelectric point being pH ≈ 5.5.
In conclusion, we have obtained detailed measurements of an osmotic pressure-induced interaction at the scale of a globular protein (a few nanometers). The range of this depletion interaction is set by the size of the protein in solution. A change of pH results in a change of the apparent size of the protein, because of the different charge. The results are basically in agreement with the theoretical expectations.
ABBREVIATION
- DLVO
Derjaguin–Landau–Verwey–Overbeek
Footnotes
This paper was submitted directly (Track II) to the Proceedings Office.
The amplitude of the angular motion of the sphere with respect to the pivot is <50. Apparently, this is small enough not to introduce an extra elastic term in the interaction potential, because we can always fit our curves, in the region of interest for this study, with a DLVO form. Furthermore, to get the osmotic part of the potential, we subtract two curves (with and without BSA in solution) obtained with the same pivot, so a contribution from the stiffness of the pivot would cancel out.
References
- 1.Flory P J. Principles of Polymer Chemistry. Ithaca, NY: Cornell Univ. Press; 1953. [Google Scholar]
- 2.Alberts B, Bray D, Lewis J, Raff M, Roberts K, Watson J D. Molecular Biology of the Cell. New York: Garland; 1994. [Google Scholar]
- 3.Israelachvili J. Intermolecular and Surface Forces. London: Academic; 1991. [Google Scholar]
- 4.Gast A P, Hall C K, Russell W B. J Colloid Interface Sci. 1983;96:251–267. [Google Scholar]
- 5.Gast A P, Russell W B, Hall C K. J Colloid Interface Sci. 1986;109:161–171. [Google Scholar]
- 6.Russell W B, Saville D A, Schowalter W R. Colloidal Dispersions. Cambridge, U.K.: Cambridge Univ. Press; 1991. [Google Scholar]
- 7.Singh M, Kleman M. C R Acad Sci Ser III. 1994;318:887–892. [Google Scholar]
- 8.Singh M, Ober R, Kleman M. J Phys Chem. 1993;97:11109–11114. [Google Scholar]
- 9.Richetti P, Kekicheff P. Phys Rev Lett. 1992;68:1951–1954. doi: 10.1103/PhysRevLett.68.1951. [DOI] [PubMed] [Google Scholar]
- 10.Kuhl T L, Berman A D, Hui S W, Israelachvili J N. Macromolecules. 1998;31:8250–8257. [Google Scholar]
- 11.Perez E, Prost J E. J Phys Lett. 1985;46:L79–L84. [Google Scholar]
- 12.Milling A, Biggs S. J Colloid Interface Sci. 1994;170:604–606. [Google Scholar]
- 13.Kaplan P D, Faucheux L P, Libchaber A J. Phys Rev Lett. 1994;73:2793–2796. doi: 10.1103/PhysRevLett.73.2793. [DOI] [PubMed] [Google Scholar]
- 14.Sharma A, Walz J Y. J Chem Soc Faraday Trans. 1996;92:4997–5004. [Google Scholar]
- 15.Rudhardt D, Bechinger C, Leiderer P. Phys Rev Lett. 1998;81:1330–1333. [Google Scholar]
- 16.Ohsima Y N, Sakagami H, Okumoto K, Tokoyoda A, Igarashi T, Shintaku K B, Toride S, Sekino H, Kabuto K, Nishio I. Phys Rev Lett. 1997;78:3963–3966. [Google Scholar]
- 17.Verma R, Crocker J C, Lubensky T C, Yodh A G. Phys Rev Lett. 1998;81:4004–4007. [Google Scholar]
- 18.Asakura S, Oosawa F. J Chem Phy. 1954;22:1255–1256. [Google Scholar]
- 19.Zocchi G. Europhys Lett. 1996;35:633–638. [Google Scholar]
- 20.Prieve D C, Frej N A. Langmuir. 1990;6:396–403. [Google Scholar]
- 21.He X M, Carter D C. Nature (London) 1992;358:209–215. doi: 10.1038/358209a0. [DOI] [PubMed] [Google Scholar]


