

Abstract
In alveolar type II cells, the release of surfactant is considerably delayed after the formation of exocytotic fusion pores, suggesting that content dispersal may be limited by fusion pore diameter and subject to regulation at a postfusion level. To address this issue, we used confocal FRAP and N-(3-triethylammoniumpropyl)-4-(4-[dibutylamino]styryl) pyridinium dibromide (FM 1-43), a dye yielding intense localized fluorescence of surfactant when entering the vesicle lumen through the fusion pore (Haller, T., J. Ortmayr, F. Friedrich, H. Volkl, and P. Dietl. 1998. Proc. Natl. Acad. Sci. USA. 95:1579–1584). Thus, we have been able to monitor the dynamics of individual fusion pores up to hours in intact cells, and to calculate pore diameters using a diffusion model derived from Fick's law. After formation, fusion pores were arrested in a state impeding the release of vesicle contents, and expanded at irregular times thereafter. The expansion rate of initial pores and the probability of late expansions were increased by elevation of the cytoplasmic Ca2+ concentration. Consistently, content release correlated with the occurrence of Ca2+ oscillations in ATP-treated cells, and expanded fusion pores were detectable by EM. This study supports a new concept in exocytosis, implicating fusion pores in the regulation of content release for extended periods after initial formation.
Keywords: alveolus; exocytosis; lamellar bodies; lung; surfactant secretion
Introduction
Exocytosis of secretory granule contents proceeds via formation of a continuity between the vesicular lumen and the extracellular fluid, the fusion pore. In a variety of cells, it has been demonstrated that these pores develop in distinct phases, some of which have features typical of membrane channels (Almers, 1990). Fusion starts with the opening of a small-diameter, water-filled pore. This initial pore may persist for short intervals, fluctuate for several rounds between an open and/or closed state, or even close again. However, in most cases this initial phase is followed by a rapid and irreversible enlargement of the pore to diameters allowing bulk release of stored substances (Monck and Fernandez, 1992; Betz and Angleson, 1998). These dynamic aspects of fusion pores are important, as any modulation of release processes could have impacts on specific physiological functions. However, unlike membrane channels, current knowledge of regulatory mechanisms at the postfusion level is still very limited (Monck and Fernandez, 1992; Rahamimoff and Fernandez, 1997). Fernandez-Chacon and Alvarez de Toledo (1995) pointed to an important role of the intracellular Ca2+ concentration ([Ca2+]i)* in accelerating serotonin release from mast cells by reducing the fusion pore expansion time, and independently, Hartmann and Lindau (1995) found a similar, marked Ca2+ sensitivity in eosinophils. In addition to the role of Ca2+, Scepek et al. (1998) demonstrated that, after formation, fusion pores in eosinophils are regulated by protein phosphorylation levels. All of these pioneer studies, based on patch clamp techniques, reveal an important, novel site of regulation in the exocytotic process.
Less attention is drawn to exocytosis in epithelial cells than to excitable cells, although the basic mechanisms (involving Ca2+ and PKC) turn out to be very similar (Frick et al., 2001). The alveolar type II cell has its predominant role in synthesizing pulmonary surfactant, which is essential to maintain normal lung function (Clements, 1997). The release from the cells proceeds by exocytosis of large vesicles containing surfactant in characteristic arrangements, the lamellar bodies (LBs) (Fig. 2 A illustrates the distinction we made between vesicles and LBs). Consequently, fusion of vesicles with the plasma membrane and formation of exocytotic fusion pores are the key steps linking cellular synthesis of surfactant to its delivery into the alveolar space. The initial opening of fusion pores can be visualized by entry of extracellular N-(3-triethylammoniumpropyl)-4-(4-[dibutylamino]styryl) pyridinium dibromide (FM 1-43), an amphiphilic fluorescent dye (Betz et al., 1996), into the lumen of fused vesicles. Intercalation of this dye into LBs leads to localized fluorescence (Haller et al., 1998), its onset coinciding with step capacitance changes (Mair et al., 1999). Importantly, fluorescence-labeled LBs remain closely attached to the cellular surface. Occasionally, stained protrusions are clearly discernible, which we interpreted as LBs undergoing release (Dietl and Haller, 2000). Both observations suggested that LBs reside within a fused vesicle for a certain period of time, and prompted us to investigate whether fusion pore geometry is rate limiting for their release. This seems quite reasonable in that LBs are hydrophobic and not subject to the rapid dispersal characteristics of the more soluble vesicle constituents found in other cells.
Figure 2.
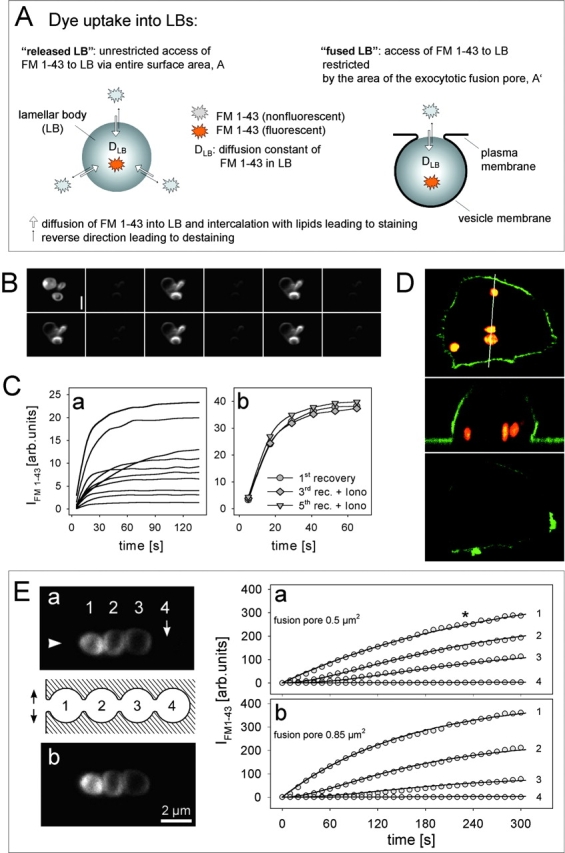
Fusion pore modeling and validation of FRAP. (A) In a released LB of a given volume, FM 1-43 staining rate depends on the diffusion constant of FM 1-43 in LBs (DLB), whereas in exocytotic fusion staining is additionally determined by diffusive flux of FM 1-43 through the fusion pore. Therefore, according to our analytical solution of Fick's law (Eq. A4), experimental determination of DLB in released LBs allows to calculate the fusion pore area in exocytotic fusions (all other factors are known). (B) For determination of DLB, repeated de- and restaining of released LBs by confocal FRAP was tested (consecutive images from upper left to lower right). Dark images were acquired 6 s, bright images (at identical gain settings) 30 s after bleaching, followed by the next cycle (5 out of 12 are shown). (Upper left) LBs fully saturated with dye before the measurements. (C) Recovery rates (a) of single released LBs demonstrating exponential slopes of fluorescence staining after photobleaching (at time 0). Fitting 51 experiments by Eq. A3 allowed to determine the diffusion constant DLB. Ionomycin had no significant effect on recovery rates (b) in a single released LB. (D) Lack of fluorescence recovery in transiently fused vesicles (no accessibility of FM 1-43 from the extracellular space) demonstrates irreversibility of the photobleaching effect. Confocal z sectioning (top and bottom) and x sectioning (center, along the indicated line) of a cell labeled with FM 1-43 (vesicles; red) and SP–DiOC18(3) (membrane; green) before (top and center) and after photobleaching (bottom). (E) Validation of the model Eq. A4 by FRAP experiments on a compound exocytosis. Arrowhead denotes the presumptive site of the fusion pore in a row of homotypic fusions (LB 2–4). Experimental recovery rates (a; image and data) could be fit best (solid lines through circles) by extending the diffusion model to a linear coupled system, and by introducing particular contact areas between adjacent LBs (see text). Treatment of the cell with ionomycin (b) further increased recovery rate of LB 1, which is described best (solid lines) by the indicated expansion of the fusion pore. LSM images were taken at the time indicated by the asterisk. Bar, 2 μm.
The extracellular appearance of secretory compounds following fusion can be measured by amperometry (Travis and Wightman, 1998). The spike-like current produced at the tip of a monitoring carbon fiber can be interpreted in terms of diffusion processes of the released molecules through the fusion pore, with subsequent dispersal in the extracellular solution. The delay between the onset of an amperometric spike and a preceding capacitance step has been used to calculate fusion pore diameters in mast cells (Fernandez-Chacon and Alvarez de Toledo, 1995). In contrast to this classical approach which can only be used for oxidable/reducible substrates, we took advantage of the secretory product itself (LBs) as a selective fluorescence activator of FM 1-43 to obtain information about fusion pore geometry. In other words, LBs were used as intravesicular “sensors,” and their reversible interactions with FM 1-43 as a measure of diffusive flux of this dye through the fusion pore. This approach, combined with FRAP and diffusion analysis, allowed repeated estimation of fusion pore diameters over times far exceeding those accessible to the patch clamp technique.
Results
LB fusion and FM 1-43 fluorescence
Formation of an aqueous fusion pore is the earliest detectable postfusion event. In a previous study combining the capacitance technique with fluorescence microscopy (Mair et al., 1999), we demonstrated that FM 1-43 has fast access to fused vesicles, enabling measurements of fusion pore formation with a negligible delay (≪ 1 s). As demonstrated (Fig. 1, A–C), entry of FM 1-43 into fused vesicles proceeds until FM 1-43 partitioning between water and lipids is in equilibrium, causing the fluorescence intensity of FM 1-43 (IFM 1-43) to increase until it reaches a plateau. In most cases these data could be fit by a single exponential, with a time constant correlated to the amplitude of capacitance steps, and hence to the volume of fused vesicles and the dye concentration (Mair et al., 1999). Previously, we interpreted this to indicate that the IFM 1-43 pattern is mainly determined by the kinetics of dye interaction with LBs, rather than by diffusive flux through the fusion pore. However, extending the fluorescence studies, we now demonstrate that the conditions are more complex; therefore, we applied a widely proved solution of Fick's law (Muhr and Blanshard, 1982; see ), which generally describes diffusive dynamics for a situation as depicted in Fig. 2 A.
Figure 1.

Initial fusion events and their relation to [Ca2+]i. (A) Example of a secreting cell (overlay of FM 1-43 fluorescence and DIC-Nomarski images). Arrow, fused vesicle; arrowhead, nonfused vesicle. (B) Series of FM 1-43 fluorescence (a–f) of one vesicle undergoing fusion. Images correspond to data in C, and were selected at times indicated in C by the filled circles. (C) Stimulation of exocytosis by photolysis of caged Ca2+ (flash arrow) and simultaneous recordings of IFM 1-43 (circles) and the fura-2 ratio (solid line); rising phase of [Ca2+]i could not be recorded (dotted line). IFM 1-43 was fit by a single exponential, yielding the time constant τ. (D) Plot of the fura-2 ratios at the time of initial, single fusion events (straight arrow in C) and the corresponding τ values. Binning fura-2 ratios into two uniform groups (n = 40 each; left ratios < 1.04 < right ratios) revealed a significantly faster filling rate (= lower τ; P = 0.018; ± SD) of vesicles undergoing fusion at elevated [Ca2+]i. Bars, 10 μm.
Fusion pore modeling and validation of FRAP experiments
To apply our diffusion model (Eqs. 3 and 4), the diffusion constant of FM 1–43 in LBs (DLB) has first to be determined; this was done using the results of FRAP experiments on released LBs. Although most of these particles are floating in the bath preventing successive measurements, some of them adhere to the glass surface and can be investigated without loss of focus. As shown in Fig. 2 B, IFM 1-43 in released LBs is bright compared with the surrounding bath. Scanning the entire region with the unattenuated laser diminished IFM 1-43 close to zero, followed by recovery to prebleach levels. Importantly, bleaching could be repeated multiple times without a change in the amplitude or rate of successive recoveries in individual LBs, indicating that an immobile fraction of the dye (i.e., dye molecules occupying binding sites on a target) (Elson and Qian, 1989) does not exist, or that it is below the detection limit under these conditions. These experiments indicate a free redistribution of bleached and unbleached FM 1-43 between LBs and solution by a diffusional process. However, the possibility that photobleaching itself is reversible has to be excluded as well. In that case, the recovery would be the result of a spontaneous, intramolecular reorganization rather than a result of dye redistribution between two compartments. This was tested using LBs following transient fusion (Dietl and Haller, 2000). These vesicles internalized FM 1-43 during the process of transient fusion pore formation, but lacked a connection to the bath after closure of the fusion pore. Laser scanning microscopy (LSM) images of cells, with the plasma membrane visualized by staining with SP-DiOC18(3), revealed LBs at a distance from the cell periphery (Fig. 2 D). Under condition of a constant FM 1-43 concentration in the bath, IFM 1–43 remained at a very low level after photobleaching, demonstrating that IFM 1-43 recovery in LBs (unless released) indeed is restricted to the existence of fusion pores.
The rate of IFM 1-43 recovery in released LBs and the time needed to reach completion varied considerably (Fig. 2 Ca). The mean correlation coefficient of curve fits, applying Eq. A3 to 51 of these recovery experiments, was 0.967 ± 0.006, and the mean diameter of these LBs was 1.45 + 0.07 μm (0.68 < d < 3.24). These data strongly suggest that released LBs behave like a homogeneous sphere with respect to FM 1-43 uptake; therefore, DLB could be calculated from these experiments to be 9.37 ± 1.04 × 10⁻¹¹cm2/s. This value seems to be low, but may be due to the complicated arrangement of the highly packed lipids in LBs. However, even this small value allows FM 1-43 to pass the distance of a membrane (10 nm) in ∼1 s, and fits quite well with the observations that a typical FRAP lasts ∼1 min for an LB of 1 μm in diameter.
The determination of DLB enables to describe FM 1-43 uptake into fused LBs, and therefore to calculate the fusion pore area by Eq. A4 (see ). The validity of this extended model was checked again by fitting experimental data of the FM 1-43 uptake into fused LBs revealing r values ≥0.99. In addition, by measuring corresponding LB diameter from LSM images, the pore area of fused LBs have been calculated. Finally, as shown in Fig. 2 E, this model also applies to the complex situation of a compound exocytosis (see Discussion).
Initial states of fusion pores
Fluorescence of initially fused LBs developed in four distinct phases, as illustrated in Fig. 3. The IFM 1-43 increase could be very fast (small LB with 1.2 μm ∅), resulting in a rapid exponential rise to a maximum (Fig. 3 a; τ = 48 s; fit of the experimental result by Eq. A4 reveals a relatively large pore area of 1.09 μm2, r = 0.996). In contrast, a large LB (Fig. 3 b; ∅ = 2.7 μm) showed a much slower increase. The fit of these data by the model with r = 0.995 predicts a pore area of only 0.34 μm2. Occasionally, a faster rise in IFM 1-43 was preceded by a “foot” (Neher, 1993; Betz and Angleson, 1998; Travis and Wightman, 1998), lasting up to several min (Fig. 3 c). This biphasic pattern was not observed with released LBs, indicating that it reflects transitions between different states of dye accessibility into fused LBs pointing to the expansion of a formerly smaller pore. The model predicts a small pore area of 0.15 μm2 for the preceding foot, followed by a small expansion of the pore up to 0.18 μm2 (LB ∅ = 1.3 μm, r = 0.998). In contrast to the observation of pore expansion, other experiments demonstrated dramatic spontaneous pore size reductions (Fig. 3 d; LB ∅ = 1.7 μm). This LB has probably already been released to a great extent (predicted pore area = 4.52 μm2, r = 0.983), but for unknown reasons was retracted and the pore area has been restricted down to 0.34 μm2 (r = 0.98).
Figure 3.

Initial states of fusion pores in caged Ca2+-stimulated fusions. Fast exponential (a), slow gradual (b), and biphasic (c and d) IFM 1–43 developments were observed at the indicated frequencies (n = 80; flash photolysis was done at time 0). Data (gray circles) were fit by Eq. A4 (solid lines), allowing to calculate fusion pore diameters for each experiment (see text).
Initial increase in IFM 1-43 is related to [Ca2+]i
Fusion events as demonstrated in Fig. 1 were stimulated by the flash photolysis of caged Ca2+. Simultaneous recordings of the fura-2 ratio showed fusion events occurring at various times after peak [Ca2+]i, allowing us to relate the time constants of IFM 1-43 increase with the fura-2 ratio at the time of fusion pore formation (straight arrow in Fig. 1 C). This analysis reveals that fusion events occurring during elevated [Ca2+]i are characterized by significantly (P = 0.018) lower time constants compared with conditions of low [Ca2+]i (Fig. 1 D). This suggests that the fusion pore expansion is triggered by Ca2+, allowing faster access and intercalation of dye molecules with LBs.
Late states of fusion pores
An example of a type II cell after stimulation is shown in Fig. 1 A. As demonstrated, FM 1-43–stained LBs remain located at the site of vesicle fusion, suggesting that fusion pore restriction impedes their release into the extracellular space. In analogy to IFM 1-43 measurements of initial fusion pores as described above, and after careful validation of the feasibility of FRAP measurements (Fig. 2, B–D), we sought to restore destained conditions of fused LBs for repeated IFM 1–43 recovery measurements. The LSM images in Fig. 4 A show part of an ATP-stimulated cell exhibiting four fused LBs. Scanning the same region with the unattenuated laser led to a disappearance of IFM 1–43, followed by recoveries of different rates that were quite stable during several repeats (Fig. 4, B and C). However, fluorescence of some LBs (LB no. 3 in Fig. 4 A and data in Fig. 4 D) developed progressively from a slow initial into a fast recovery in subsequent measurements. The model (Eq. A4) describes best (r > 0.995) the characteristics of this particular LB (1.8 μm ∅) by the supposition of a variable pore area in the observation interval of 34 min. At the beginning of the first FRAP measurement (10 min after initial fusion), the pore area is calculated to be 0.07 μm2, raising linearly to 0.48 μm2 after 200 s. 10 min later, when starting an additional FRAP experiment, the pore area was enlarged to 0.58 μm2 followed by a further expansion (arrow) up to 2.24 μm2 during the next 3 min. After beginning the last experiment in this series (30 min), full expansion of the pore (3.14 μm2) occurred. Such very large areas during late stages of secretion most likely reflect LBs during the process of release, which is accompanied by large scale surface expansions as seen by transmission electron microscopy (TEM) (see Fig. 8 C). Under these conditions (dramatic change in LB morphology), model calculations will inevitably lead to a pore area overestimation.
Figure 4.

Late states of fusion pores. (A) LSM images of fused LBs at the cell periphery before (a) and at different times (b–d, corresponding to the asterisks in B; bleaching was at time 0) after a FRAP measurement. (B) Minor changes in IFM 1–43 recovery rates of LBs 1, 2, and 4, measured at ∼10, 20, and 30 min after initial fusion. (C) Mean time constants of individual LBs (n = 8 ± SD) after repeated FRAP measurements. (D) Progressive increase in IFM 1-43 recovery of LB no. 3 in A within three subsequent measurements. Data were fit by Eq. A4 (solid lines). Arrow denotes transition of the fusion pore diameter (see text). Bar, 10 μm.
Figure 8.

SEM and TEM of stimulated cells. (A) Surface structures of two adjacent cells (*, cell border), fixed 10 min after stimulation by ATP. Manifold LB protrusions are visible out of a cluster of differently sized pores. Even small structures could be interpreted as fusion pores (arrow) considering their distinct appearance in comparison to specimen preparation artifacts (arrowheads). (B) Prominent LB release out of a fused vesicle. (C) Compound exocytosis and LB release visualized by rapid freezing/freeze substitution/TEM. Arrow indicates membrane transition of two fused vesicles (*, smaller one). In contrast to intracellular LBs (inset), LB appear loosely packed during release. (D) Change in the number of pores per cell exceeding 0.75 μm ∅, 10 min after stimulation by ATP. Bar (inset), 0.5 μm.
Continuous photobleaching
Although FRAP could be applied repeatedly, we aimed at a more continuous approach to record fusion pore dynamics (Fig. 5 A). IFM 1-43 data were obtained from LSM image stacks of FM 1-43–stained LBs, acquired at regular intervals using intermediate laser transmission (32%). At this light intensity, each image stack should lead to partial bleaching only. Indeed, in released LBs (Fig. 5 A), IFM 1-43 dropped initially, followed by a steady state, which most likely corresponds to a dynamic equilibrium between bleaching and replenishment of unbleached dye. When the same protocol was applied to transiently fused vesicles lacking access to extracellular FM 1-43 (Fig. 2 D), IFM 1-43 dropped to zero. Correspondingly, in the intermediate situation (exocytotic fusion), IFM 1-43 attained a value >0 indicating a limited rate of dye replenishment through the fusion pore. Thus, it has to be concluded that any change in the status of the fusion pore (both closure or expansion) should result in a corresponding shift in the steady-state IFM 1-43. This modified FRAP protocol provides a continuous assessment of fusion pore dynamics. For each data point, a stack of eight confocal images was captured within a defined space below and above the measured LB. This excludes the possibility that IFM 1-43 changes are due to changes in LB location relative to the focal plane, or to exocytosis of additional vesicles in the vicinity of the one observed.
Figure 5.

Fusion pore dynamics revealed by continuous photobleaching. (A) Exemplified IFM 1-43 recordings obtained from released LBs, LBs within fused vesicles, and LBs within transiently (as in Fig. 2 D) fused vesicles. Steady-state IFM 1-43 reflects a balanced rate between dye bleaching and replenishment. (B) Confocal z sections of a single fused LB at times indicated in the upper diagram during a continuous photobleaching experiment (identical LSM gain setting in 1–3). Despite the apparent disappearance of fluorescence during steady state, the LB was still visible by contrast enhancement (IFM 1-43 >0). The shift in steady-state IFM 1-43 reflects spontaneous fusion pore expansion. (Bottom right) IFM 1-43 tracings of two LBs from the same cell, demonstrating the differential effect of ionomycin on the steady-state IFM 1-43.
Fusion pore dynamics
As demonstrated above (Fig. 5 A), the steady-state IFM 1-43 of fused LBs remained constant in most cases, and for periods longer than 30 min. Accordingly, no (or only minor) changes in LB morphology could be detected within that time. Only on rare occasions (∼5% of all experiments) did the steady–state IFM 1-43 spontaneously shift towards higher levels at irregular times after the initial fusion pore opening (Fig. 5 B, pictures and upper graph). Although steady-state IFM 1-43 was low, it was still >0, and no noticeable change in shape and apparent diameter of this particular LB was observed before and after IFM 1-43 shift. These data demonstrate that a spontaneous opening of the fusion pore accelerates net diffusion of FM 1-43, thereby shifting the balance between bleaching and replenishment towards the latter.
Ca2+: a key regulator of fusion pore dynamics
Ionomycin leads to cytoplasmic Ca2+ transients and stimulates exocytosis (Sano et al., 1987; Pian et al., 1988). Furthermore, perfusion with ionomycin caused the steady-state IFM 1-43 of fused LBs to shift to higher levels (Fig. 5 B, lower graph), indicating fusion pore dilation. The effect of ionomycin-induced increase in [Ca2+]i on fusion pores was further analyzed by FRAP (Fig. 6). The frequency distribution of time constants of constitutive fusion events (i.e., without exogenous stimulation = control) was assessed. In comparison to released LBs (Fig. 6 C, right), this distribution indicates limitation of FM 1-43 access into fused LBs due to the restricted area of the fusion pore. Treatment of the cells with ionomycin significantly increased IFM 1-43 recovery rates (Fig. 6, A–C). This effect was not observed in the cell-free situation (Fig. 2 Cb), excluding that ionomycin per se affects the partition characteristics of FM 1-43 with LBs. Applying Eq. A4 on the results of Fig. 6 A, a fusion pore area of 1.17 μm2 was calculated for this particular LB (1.66 μm ∅, r = 0.999) shifting to the pore area of 2.43 μm2 after treatment with ionomycin (r = 0.998). In the summary of the experiments (Fig. 6 B), the model predicts a fusion pore area dilation by ionomycin from 0.55 to 1.41 μm2 (mean ∅ of fused LBs was 1.62 μm). Therefore, the mean time constant decreased from 231 ± 31 s to 95 ± 10 s. Additional theoretical opening of the fusion pore area up to the entire surface of the LB causing unlimited access of FM 1-43 to the LB (representing the configuration of released LBs) predicts a time constant of 17 s, which is in the range of the experimentally determined τ (29 ± 3 s) of released LBs (Fig. 6 B).
Figure 6.

Ca2+ effect on fusion pores. (A) Repeated FRAP of a single LB before (control) and after treatment with ionomycin. Time of photobleaching is indicated by the laser symbol. Data were fit by Eq. A4, revealing a decrease in τ and, correspondingly, an increase in the pore area. (B) Averaged time constants derived from measurements exemplified in A (n = 68; P < 0.001), and from released LBs. According to our model, and using an experimentally determined mean LB ∅ of 1.68 μm, these values yield an increase in mean pore area (A′) after treatment with ionomycin as indicated. (C) Frequency distribution of time constants in fused (before and after ionomycin treatment) and released LBs. These data were used for the calculations shown in B.
Agonist-induced regulation of fusion pore dynamics
ATP is a potent agonist of surfactant secretion (Warburton et al., 1989). However, the ATP-induced exocytotic activities and the Ca2+ signals vary considerably among individual cells (Fig. 7), the fraction of nonsecreting cells often >50% (Frick et al., 2001). Because it is reasonable to assume that LB release is related to fusion pore expansion, and, as shown, fusion pore expansion is related to Ca2+, we investigated whether release is related to the course of the Ca2+ signal. We found that the incidence of LB protrusions (fluorescence-stained, floating structures extending from an intravesicular, immobile portion into the extracellular space; Fig. 7 C) is higher in cells responding to ATP with sustained [Ca2+]i elevations (Fig. 7, A and B). Therefore, we suggest that Ca2+ oscillations caused by physiological agonists like ATP may not only be linked with vesicle fusion, but are also related with fusion pore expansion, promoting release of LBs from fused vesicles.
Figure 7.

Differential cellular responses to ATP. (A) The fura-2 ratios (black lines) were determined from the respective areas shown by the continuous lines in B (bottom), and simultaneously, the FM 1-43 signals (red lines) were measured over the smaller encircled areas (dotted lines) in B (bottom), containing several fused LBs. (B) Top, 350 nm; bottom, 480-nm excitation image captured at 0.3 and 5 min after addition of ATP. Arrows indicate two (among several) floating LB protrusions from fused vesicles. Cell 1 has no [Ca2+]i plateau and no fused vesicles; cell 2 shows intermediate [Ca2+]i elevations and intermediate exocytotic response, but no protrusions; and cell 3 has marked [Ca2+]i oscillations, a high exocytotic activity with fast staining rates, and many LB protrusions. This example demonstrates that the course of the Ca2+ signal determines both fusion activity and occurrence of LB protrusions. The dotted lines in A (cells 2 and 3) denote individual fusion events coinciding with rising phases of [Ca2+]i oscillations. (C) Higher magnification view of LB protrusion by LSM. The floating extracellular portion of LB material (e) is still attached to the intravesicular, immobile portion (i), separated by a lace (arrow), presumably representing the site of the fusion pore. The image was captured at 488 nm excitation, and at emission settings of >515 nm (FM 1-43, red) and 510–525 nm (calcein, green), causing nonfused vesicles to appear as dark inclusions within the cytosol. Bar, 15 μm.
Further evidence of ATP-induced fusion pore expansion was found by scanning electron microscopy (SEM) (Fig. 8). Following stimulation, type II cells exhibited numerous cell surface–associated pores. Based on the following findings we identified these structures as exocytotic fusion pores. Consistent with fluorescence microscopy, we observed a marked cellular heterogeneity (0 to ∼20 pores/cell), and a location preferably at perinuclear regions (Haller et al., 1998). Furthermore, many pores showed an intimate association with irregularly shaped structures that most likely represent protrusion of LBs caught in the process of release (compare to Fig. 7 C), an interpretation also supported by our TEM studies from rapid-frozen, freeze-substituted samples (Fig. 8 C). Importantly, exposure to ATP significantly increased the number of pores/cell, exceeding a threshold diameter of 0.75 μm (Fig. 8 D). This value was chosen because it was necessary to minimize contributions of small artifactual holes resulting from critical point drying (Fig. 8 C, arrowheads) to this type of analysis. As demonstrated by the micrographs, fusion pores are abundant, observable even long after stimulation (i.e., 1 h) and variable in size, suggesting that they are persistent structures that expand rather slowly.
Discussion
Fusion pore formation and LB release
LBs in the process of exocytosis have been successfully captured by TEM (Mason et al., 1985; Rooney et al., 1994; Williams, 1977). As a general feature emerging from these studies, LBs are connected with the extracellular space through a single pore (Kliewer et al., 1985), formed by the limiting membrane of the vesicles and the plasma membrane. By three-dimensional reconstruction of serial TEM sections from rat lungs, Kliewer et al. (1985) found that these pores (elliptical by 0.4 × 0.2 μm) were about half of the average diameter of the associated LBs. The authors suggested that the restricted size of these pores imposes a deformation of LBs during secretion, which could be important for unraveling of LB material, or even for the transformation into its active forms. In addition, this model implies that the rate of LB release into the cell supernatant should be considerably slower compared with the release through a fully dilated pore. However, this important issue, has not been investigated thus far.
In line with this assumption, fusion pore formation significantly precedes surfactant release. The time course of lipid accumulation in cell supernatants is usually gradual and in the range of hours following application of secretagogues like ATP (Gilfillan and Rooney, 1987; Griese et al., 1993). In contrast, vesicle fusion as determined by the FM 1-43 and capacitance techniques (Haller et al., 1998; Mair et al., 1999) starts within seconds and terminates after several minutes. Because these methods record the time of fusion pore formation with a minimum delay (≪1 s), we proposed that the release process has to be considerably slower than the fusion events with the plasma membrane (Haller et al., 1998). Consistently, we found that most exocytosed LBs remain closely attached to the cellular surface at the site of fusion (Fig. 1 A). Stirring, perfusion, or other forms of mechanical perturbation led to removal of only a portion, if at all, of stained LBs, suggesting that the remainder is retained by a structural component, presumably the fusion pore. This is supported by LSM, demonstrating floating, tubular protrusion of stained material out of fused vesicles (Fig. 7 C), resembling LB material caught in the process of release by our EM studies (Fig. 8). All of these findings are consistent with the idea that a narrow pore slows down or even prevents LB release. In fact, the LSM images are intriguing because LBs seem to be virtually squeezed through these pores, consistent with published data using TEM (Williams, 1977; Mason et al., 1985; Rooney et al., 1994). Accordingly, fusion pores in type II cells are probably rather stable structures that do not readily collapse into the plasma membrane as is generally assumed for fast secretory cells (Betz and Angleson, 1998).
Fusion pore modeling
EM studies suggest a morphological situation of fused LBs as depicted in Fig. 2 A, showing a negligibly small space between LB and the surrounding vesicular membrane, and direct access of FM 1-43 into fused LBs via pores of the plasma membrane. From Fick's law we derived a solution (Eqs. 3 and 4) by which experimental results of FM 1-43 uptake into released and fused LBs could be well described (r > 0.96). Determination of DLB in released LBs, and measurements of LB diameters, enabled us to calculate pore areas by application of this diffusion model for each experiment. Although we cannot test the validity of our model with simultaneous patch clamp experiments (i.e., the prerequisite of a freely conducting granule content is probably not given; Monck and Fernandez, 1992), the extraordinarily high correlation (r > 0.99) between measured dye uptake rates into fused LBs and model calculations (Eq. A4) strongly supports the validity of our model. Additional confirmation raised from an experiment demonstrating FRAP on a compound exocytosis (Mair et al., 1999) as shown in Fig. 2 E. The fused LB 1 (∅ 1.48 μm) has access to extracellular dye by a pore area of 0.5 μm2 (r = 0.99), whereas the following LBs (LB 2, ∅ 1.6 μm; LB 3, ∅ 1.8 μm; LB 4, ∅ 1.66 μm) are coupled to the first one in a linear row. Extending the diffusion model to such a linear coupled system, where the access to FM 1-43 is dependent on the outer adjacent LBs, the experimental data can be fit best by introducing particular contact areas between adjacent LBs. Furthermore, these calculated areas (2 μm2 between LB 1 and 2; 3.1 μm2 between LB 2 and 3; 1.5 μm2 between LB 3 and 4) fairly agree with estimations derived from the LSM pictures, thereby providing a direct reference of calculated pore areas by the model. Finally, TEM of compound exocytosis (Fig. 8 C) indeed demonstrate that these contact areas are in the range of the respective LB sizes. The extended model should also be able to predict dye uptake rates into all four LBs after ionomycin-induced pore dilation of LB 1. As demonstrated in Fig. 2 Eb, this is indeed the case, and for LB, a pore area enlargement to 0.85 μm2 could be calculated (r = 0.995). Taken together, the fairly good description of all experimental results indicates a correct estimation of fusion pore areas by our model.
Fusion pore dynamics
In many cells, fusion pores undergo transitions from initially small to expanded states (Monck and Fernandez, 1992). Owing to the potentially high physiological importance of fusion pore dynamics, this issue is intensively discussed (Rahamimoff and Fernandez, 1997). However, major emphasis has been put on secretion of small, highly diffusive solutes in various specialized cell types, making a generalization on exocytotic processes, in particular with regard to release of macromolecular compounds difficult. Fusion pores in expanded states, often referred to as Ω-shaped profiles, have been shown for example in pancreatic acinar cells to persist for up to 8 min (Nemoto et al., 2001). Similar persisting structures have been described in neuroendocrine cells, probably retaining the FM 1-43–stained contents of dense core vesicles for considerable time after fusion (Cochilla et al., 2000). In the present study, we show that fusion pores in alveolar type II cells are stable for even longer periods, which might allow mechanistic insights of pore growth to be gained more readily than for other cells. Furthermore, the study of pore dynamics by FM 1-43 may be applied for a variety of other cell types containing some amount of lipophilic materials, in a way similar to the studies on compound exocytosis performed in lactotrophs (Cochilla et al., 2000).
In addition to the arguments above, the concept of slowly developing pores in alveolar type II cells is supported by the fact that a swift expansion of fusion pores would certainly tend to lead to a homogeneous pore size distribution. However, this was neither observed in our SEM and TEM studies, nor by reevaluating the available literature (Williams, 1977; Hollingsworth and Gilfillan, 1984; Mason et al., 1985; Risco et al., 1994; Rooney et al., 1994; Dobbs et al., 1997). Also, the probability of detecting fusion pores would be considerably lower if fusion pore expansion and vesicle collapse into the plasma membrane are instantaneous events. Instead, fusion pores of different sizes could be observed by SEM even 1 h after stimulation. These findings are in favor of slowly, though discontinuously expanding pores, arrested at various stages of the expansion process, and entirely consistent with the repeated and continuous photobleaching measurements reported in this study. In particular, the continuous photobleaching assay revealed spontaneous shifts in the steady-state IFM 1-43 of single fused LBs (Fig. 5 B). Perhaps these results are the most convincing evidence for late fusion pore expansion, as all potential sources of artifacts are minimized in these protocols.
The Ca2+ dependence of fusion pore expansion is supported by several observations. (A) The flash photolysis experiments using caged Ca2+ revealed a significant Ca2+ dependence of the time constants of fluorescence staining during initial fusion pore formations (Fig. 1 D), pointing to an accelerated pore expansion under conditions of high [Ca2+]i. (B) Perfusion with ionomycin increased the frequency of IFM 1–43 shifts during continuous photobleaching measurements (Fig. 5 B). As these changes occurred closely after ionomycin treatment, they are not likely caused by spontaneous fusion pore expansions, which occurred rarely. (C) Ionomycin enhanced the recovery rates of single fused LBs (Fig. 6). Although highly significant, this was not uniformly seen in all experiments (i.e., some LBs showed no response). However, the ionomycin effect was most pronounced at high values (τ > 6 min; Fig. 6 C), which is in agreement with the finding that the ionomycin effect seemed to be inversely related to the level of steady-state IFM 1-43 during continuous photobleaching measurements (Fig. 5 B). This suggests that small fusion pores are more susceptible to changes in [Ca2+]i than those in an already expanded state. (D) ATP is a potent physiological agonist of surfactant secretion (Warburton et al., 1989), and that its stimulatory effect is mediated primarily by an increase of [Ca2+]i although additional mechanisms are indicated (Rooney, 1998). By SEM, we found that ATP treatment significantly increased the number of expanded pores compared with unstimulated cells, corroborating the above results of Ca2+-induced fusion pore expansion (Fig. 8). To investigate how these expansion processes are related to the Ca2+ signals we applied combined FM 1-43 and fura-2 image analysis of ATP-stimulated cells. Previous investigations already disclosed that the number of fusion events is proportional to the [Ca2+]i integral over time (Frick et al., 2001). In addition, we found that fusion of many vesicles coincides with [Ca2+]i spikes during the late phase of Ca2+ entry into the cells, occurring as spike-like or oscillatory elevations, lasting for several min. Here we report that cells with marked oscillatory Ca2+ patterns showed many floating LB protrusions at the end of the measurements, most likely as a direct consequence of Ca2+-induced fusion pore expansion (Fig. 7). However, our experiments revealed that these protrusions develop only slowly (≫ min). It is therefore impossible to definitely relate each event with a Ca2+ spike. For that reason, the quantitative assessment of these processes is problematic. Thus, the correlation between Ca2+ oscillations and LB protrusions remains an observation, although a consistent one, and further investigations are required to definitely relate the dynamics of fusion pore expansion to LB release.
Mechanisms by which Ca2+ regulates fusion pores
LB-releasing vesicles are often surrounded by actin-like material (Kapanci et al., 1979; Tsilibary and Williams, 1983; Manabe and Ikeda, 1986). Presumably, it is this scaffold of cytoskeletal elements that stabilizes fusion pores as purse string–like invaginations (Becker and Hart, 1999), prompting speculation that fusion pores might be controlled by molecular motors and other cytoskeletal elements. Here, the effects of Ca2+ on fusion pores might be severalfold. By activating F-actin–severing proteins, Ca2+ could promote transformation of the cortical actin in its gel state. This “smoothing” effect could allow fusion pores to expand, presumably in response to forces exerted by other cytoskeletal components, by intravesicular factors (i.e., hydration and swelling of LB), or by forces of extracellular origin (i.e., membrane stretch). Despite other possible explanations, this model is plausible and would fit many published observations, implicating cytoskeletal components in the regulation of surfactant secretion (Tsilibary and Williams, 1983; Rice et al., 1984; Rose et al., 1999). This assumption is further strengthened in parallel studies applying optical tweezers to measure forces on cellular structures, in which we demonstrate the fusion pore being a Ca2+-dependent mechanical barrier for release (Singer, W., S. Bernet, M. Pitsch-Marte, M. Frick, T. Haller, and P. Dietl. 2001. Biophys. Soc. 80:140a.). In particular, our model emphasizes a dual role of the cytoskeleton/Ca2+ interactions with respect to exocytosis: Ca2+ facilitates vesicle movements by abrogating cytoskeletal “barriers,” and promotes fusion pore expansion. Both effects would assist in increased secretion, although by completely different mechanisms. Furthermore, it is widely accepted that mechanical factors acting on the alveolar epithelium during ventilation are major determinants of surfactant secretion in vivo (Wirtz and Dobbs, 1990; Liu et al., 1999; Ashino et al., 2000). In addition to initiating vesicle fusions, such mechanical factors could assist in widening fusion pore diameters, facilitating release of LBs into the alveolar space. Alternatively, alveolar distension could modify LB morphology by affecting fusion pore geometry, as originally proposed by Kliewer et al. (1985), explaining why the mode of mechanical ventilation would affect surfactant forms in vivo (Savov et al., 1999). That the well-established enhancement of surfactant turnover by high tidal volumes (Wirtz and Schmidt, 1992) is also mediated in part by fusion pore expansion, is a likely scenario and its elucidation a challenging issue in future lung physiology research.
Materials and methods
Cell preparation
Alveolar type II cells were isolated from Sprague-Dawley rats according to the procedure of Dobbs et al. (1986) with minor modifications as recently described (Haller et al., 1998). After isolation, cells were seeded on glass coverslips, cultured in DME, and used after 1 d.
Measurement of exocytosis
The method is described in previous studies (Haller et al., 1998; Mair et al., 1999). In brief, FM 1-43 is a fluorescent styryl dye intercalating at, but not penetrating, lipid/water interfaces due to its amphiphilic nature. The quantum efficiency of FM 1-43 is low in water but considerably enhanced by insertion into lipids. Because LBs predominantly consist of phospholipids, entry of this dye through fusion pores leads to bright, localized fluorescence intensity of FM 1-43 (IFM 1-43) at 480 nm excitation, exceeding the faint signal originating from the plasma membrane (Fig. 1 A). FM 1-43 was permanently present in the extracellular solution at a concentration of 1 μM.
Microscopy and image analysis
Coverslips with adherent cells were mounted into a perfusion chamber placed on the stage of an inverted microscope (Zeiss 100), equipped for polychromatic illumination and image analysis (TILL Photonics). [Ca2+]i is expressed as background-corrected fura-2 fluorescence ratio (350:380 nm excitation), measured from cells preincubated in DME with 1 μM fura-2 AM at 37°C for 15 min. IFM 1-43 was measured simultaneously to fura-2 at 480 nm excitation and >530 nm emission. Flash photolosis was performed on cells loaded with caged Ca2+ (NP-EGTA AM, 10 μM, 30 min in culture conditions) by a pulsed xenon arc lamp as described (Haller et al., 1999).
Confocal FRAP and continuous photobleaching measurements
These experiments were performed on a Zeiss Laser Scan Microscope (LSM 410 invert). FM 1-43 was excited at the 488-nm wavelength of the argon laser passing a Plan-Apochromat 100×/1.4 NA oil objective, and emitted light was directed through a 515-nm long pass filter. The nominal output power of the laser (60 mW) could be attenuated by neutral density filters in the light path. Each FRAP measurement was started by scanning a square of usually 8 × 8 μm in the specimen plane 20 times with the unattenuated laser (100% transmission) at a rate of one full frame/0.4 s in the nonconfocal mode. The high number of consecutive repeats was necessary for bleaching due to the high photostability of FM 1-43. Typically, a 20× scan yielded a bleach to <1% of original IFM 1-43. Subsequently (after 6 s; this time was required due to instrument handling), images were captured at regular intervals at a reduced intensity (0.32% transmission) to minimize bleaching during data acquisition. From these images, IFM 1-43 values were obtained by calculating mean pixel intensities within defined areas of vesicular fluorescence.
Continuous photobleaching was performed at 32% laser transmission. This value was selected because it caused partial bleaching of FM 1-43 stained LBs (Results). Partial bleaching can be considered as the result of an equilibrium between bleaching and restaining of LBs by FM 1-43. To avoid out of focus movements of LBs during measurement, stacks of eight horizontal scans in the confocal mode (8 × 8 μm each, one full frame/0.4 s, 1 μm step size, 8 s/stack, confocal setting = 40) were performed at regular intervals. IFM 1-43 was calculated as the sum of integrated pixel intensities from all scans in each stack, yielding one single data point of the IFM 1-43 tracings shown in Fig. 5. The confocal mode was chosen to enhance image contrast and resolution. This was also necessary to avoid shifts in steady-state IFM 1-43 due to additional fusion events within the observed region. Analysis of the point spread function using fluorescent beads revealed that this type of analysis yields sufficiently stable signals, even when LBs completely move through the focal planes. To exclude dye depletion within the scanned fluid volume and mechanical perturbations of the cells caused by pipetting, all measurements were performed under constant slow perfusion (0.8 μl/s) of the experimental chamber using a precision peristaltic pump. IFM 1-43 was normalized to 100% (LB intensity at the beginning of each experiment) and 0% (instrumental background).
Fluorescence data were analyzed with DatGraf (Cyclobios), TILLvisION, Adobe Photoshop and Excel (Microsoft). The time constant was uniformly calculated within the first 2 min following the onsets of IFM 1-43 increase. Statistics were performed by unpaired t tests, and data are reported as arithmetic mean ± SEM (unless otherwise indicated).
EM
For SEM, the cells were fixed with 2.5% glutardialdehyde in 0.15 M cacodylate buffer (pH 7.3). A brief washing in the same buffer was followed by 1 h of postfixation with 1% aqueous OsO4, gradual dehydration with ethanol, and critical point drying (Bal-Tec CPD 030; Balzers). Specimens were mounted with colloidal silver on aluminum stubs, sputtered with 10 nm Au/Pd (Balzers), and examined with a Zeiss scanning electron microscope (Gemini 982). Data analysis (Fig. 8 D) was performed by a technician unaware of the experimental protocol (“blind analysis”). Furthermore, selection of the microscopic areas for that analysis was done at random.
For TEM, the cells were rinsed with fresh culture medium, slam-frozen and freeze-substituted with acetone containing 1% OsO4 and 0.5% uranyl acetate as described (Hess and Siljander, 2001). For further fixation and contrast enhancement the samples were taken out of the substitution media at −65°C and immediately transferred into 2% aqueous OsO4 at room temperature for 1 h (Dalen et al., 1992). Finally the cells were embedded in Epon. 80-nm thin serial sections cut perpendicularly to the plane of the monolayer were viewed at 60 kV with a JEM-1200 EX (Jeol).
Solutions and materials
Bath solution contained, in mM: 140 NaCl, 5 KCl, 1 MgCl2, 2 CaCl2, 5 glucose, and 10 Hepes (pH 7.4). Fura-2 AM, NP-EGTA AM, FM 1-43, SP-DiOC18(3), and calcein AM were purchased from Molecular Probes. All other chemicals were obtained from Sigma-Aldrich. ATP and ionomycin were applied at 10 μM each. All experiments were performed at room temperature.
Appendix
Calculation of the diffusion constant DLB and the pore area A′
Diffusion processes (characterized, i.e., by the diffusion constant D and the concentration of the diffusible substance c) dependent on time (t) and distance (x) are generally described by Fick's law ∂c/∂t = D ∂2 c/∂x 2. However, analytical solutions of this complex differential equation, can only be achieved by introducing adequate start and boundary conditions, usually after simplification of the physical reality.
For determination of DLB of released LBs, we used an adapted solution of the problem derived previously, and proved for the measurement of many diffusion constants of molecules in variable matrices for technical applications (Muhr and Blanshard, 1982; Fergg, 1999). Leaving the beginning of FRAP experiments (i.e., the first few seconds) out of consideration, we can assume quasistable conditions leading to linearized concentration profiles with time dependent gradients. The material balances for FM 1-43 in both compartments (surrounding buffer and LB) are then given as:
(A1a)∂c Ve/∂t = 1/V e [–AD (c Ve− c LB)/r]
and
(A1b)∂c LB/∂t = –1/V LB [–AD (c Ve − c LB)/r]
where cVe represents the concentration of FM 1-43 in the extracellular volume Ve; cLB the concentration of FM 1-43 in an LB of the volume VLB; and A and r the surface and the radius of the LB, respectively. Having a closed system as used in our experimental design, these Eqs. are coupled because of mass conservation (the decrease of the FM 1-43 concentration in the buffer equals the uptake of FM 1-43 into the LB), and therefore we can solve:
(A2)∂(c Ve – c LB)/∂t = [1/V e +1/V LB ][–AD (c Ve – c LB)/r]
for (c Ve – c LB) simply by separation of the variables getting:
ln{[c Ve (t) – c LB (t)]/[c Ve (t 0) – c LB (t 0)]} = −AD (t − t 0)/(V LB r).
On the assumption of a spherical and homogeneous LB under the boundary and starting conditions of V e ≫ V LB, c Ve ≃ const = c Ve (t), c LB(t=0) = 0, t 0 = 0, we have the final solution for released LBs:
(A3)c LB(t) = c Ve [1 –exp(–3D LB t/r 2)].
From the fit of the experimental data obtained from FRAP experiments of released LBs, and the respective LB radius, D LB could be calculated from the slope of the trendline of each set of linearized data if the correlation coefficient of the fit was sufficiently high (r > 0.95). Extending the model to a situation where the diffusion area of the LB is not represented by the entire surface but restricted by a smaller area (the pore area A′), the concentration of FM 1–43 (IFM 1–43) in fused LBs is given by:
(A4)c LB(t) = c Ve {1 –exp[(–A′ D LB t)/(r V LB)]} .
Achieving a sufficient fit of the experimental data by this equation, the pore area A′ for a particular LB has been determined.
Acknowledgments
We thank J. Coorssen and B. Flucher for critically reading the manuscript, and I. Öttl, G. Siber, M. Lindman, and A. Strandell for technical assistance.
This work was supported by grants from the Austrian National Bank (7413 to T. Haller) and the Austrian Science Foundation (P–12974 to P. Dietl; P–12337 and P–13041 to M. Paulmichl). Parts of this work were presented at the Meeting of the American Society for Cell Biology (Washington, DC, 1999), the FASEB Summer Research Conference (Saxtons River, VT, 2000), and the Meeting of the Society for Experimental Biology (Cambridge, UK, 2000).
M. Paulmichl's present address is Department of Physiology and Biochemistry, University of Milan, I-20133 Milan, Italy.
Footnotes
Abbreviations used in this paper: FM 1-43, N-(3-triethylammoniumpropyl)-4-(4-[dibutylamino]styryl) pyridinium dibromide; [Ca2+]i, intracellular Ca2+ concentration; LB, lamellar body; LSM, laser scanning microscopy; SEM, scanning electron microscopy; TEM, transmission electron microscopy.
References
- Almers, W. 1990. Exocytosis. Annu. Rev. Physiol. 52:607–624. [DOI] [PubMed] [Google Scholar]
- Ashino, Y., X. Ying, L.G. Dobbs, and J. Bhattacharya. 2000. [Ca2+]i oscillations regulate type II cell exocytosis in the pulmonary alveolus. Am. J. Physiol. Lung Cell. Mol. Physiol. 279:L5–L13. [DOI] [PubMed] [Google Scholar]
- Becker, K.A., and N.H. Hart. 1999. Reorganization of filamentous actin and myosin-II in zebrafish eggs correlates temporally and spatially with cortical granule exocytosis. J. Cell Sci. 112:97–110. [DOI] [PubMed] [Google Scholar]
- Betz, W.J., F. Mao, and C.B. Smith. 1996. Imaging exocytosis and endocytosis. Curr. Opin. Neurobiol. 6:365–371. [DOI] [PubMed] [Google Scholar]
- Betz, W.J., and J.K. Angleson. 1998. The synaptic vesicle cycle. Annu. Rev. Physiol. 60:347–363. [DOI] [PubMed] [Google Scholar]
- Clements, J.A. 1997. Lung surfactant: a personal perspective. Annu. Rev. Physiol. 59:1–21. [DOI] [PubMed] [Google Scholar]
- Cochilla, A.J., J.K. Angleson, and W.J. Betz. 2000. Differential regulation of granule-to-granule and granule-to-plasma membrane fusion during secretion from rat pituitary lactotrophs. J. Cell Biol. 150:839–848. [DOI] [PMC free article] [PubMed] [Google Scholar]
- Dalen, H., P. Scheie, R. Nassar, T. High, B. Scherer, I. Taylor, N.R. Wallace, and J.R. Sommer. 1992. Cryopreservation evaluated with mitochondrial and Z line ultrastructure in striated muscle. J. Microsc. 165:239–254. [DOI] [PubMed] [Google Scholar]
- Dietl, P., and T. Haller. 2000. Persistent fusion pores but transient fusion in alveolar type II cells. Cell Biol. Int. 24:803–807. [DOI] [PubMed] [Google Scholar]
- Dobbs, L.G., R. Gonzalez, and M.C. Williams. 1986. An improved method for isolating type II cells in high yield and purity. Am. Rev. Respir. Dis. 134:141–145. [DOI] [PubMed] [Google Scholar]
- Dobbs, L.G., M.S. Pian, M. Maglio, S. Dumars, and L. Allen. 1997. Maintenance of the differentiated type II cell phenotype by culture with an apical air surface. Am. J. Physiol. 273:L347–L354. [DOI] [PubMed] [Google Scholar]
- Elson, E.L., and H. Qian. 1989. Interpretation of fluorescence correlation spectroscopy and photobleaching recovery in terms of molecular interactions. Methods Cell Biol. 30:307–332. [DOI] [PubMed] [Google Scholar]
- Fergg, F. 1999. Nitratreduktion mittels in Polyvinylalkohol-Hydrogelpellets immobilisierten Bimetallkatalysatoren. Ph.D. thesis. The University of Hamburg-Harburg, Hamburg, Germany. 187 pp.
- Fernandez–Chacon, R., and G. Alvarez de Toledo. 1995. Cytosolic calcium facilitates release of secretory products after exocytotic vesicle fusion. FEBS Lett. 363:221–225. [DOI] [PubMed] [Google Scholar]
- Frick, M., S. Eschertzhuber, T. Haller, N. Mair, and P. Dietl. 2001. Secretion in alveolar type II cells at the interface of constitutive and regulated exocytosis. Am. J. Resp. Cell. Mol. Biol. In press. [DOI] [PubMed] [Google Scholar]
- Gilfillan, A.M., and S.A. Rooney. 1987. Purinoceptor agonists stimulate phosphatidylcholine secretion in primary cultures of adult rat type II pneumocytes. Biochim. Biophys. Acta. 917:18–23. [DOI] [PubMed] [Google Scholar]
- Griese, M., L.I. Gobran, and S.A. Rooney. 1993. Signal-transduction mechanisms of ATP-stimulated phosphatidylcholine secretion in rat type II pneumocytes: interactions between ATP and other surfactant secretagogues. Biochim. Biophys. Acta. 1167:85–93. [DOI] [PubMed] [Google Scholar]
- Haller, T., K. Auktor, M. Frick, N. Mair, and P. Dietl. 1999. Threshold calcium levels for lamellar body exocytosis in type II pneumocytes. Am. J. Physiol. 277:L893–L900. [DOI] [PubMed] [Google Scholar]
- Haller, T., J. Ortmayr, F. Friedrich, H. Volkl, and P. Dietl. 1998. Dynamics of surfactant release in alveolar type II cells. Proc. Natl. Acad. Sci. USA. 95:1579–1584. [DOI] [PMC free article] [PubMed] [Google Scholar]
- Hartmann, J., and M. Lindau. 1995. A novel Ca2+-dependent step in exocytosis subsequent to vesicle fusion. FEBS Lett. 363:217–220. [DOI] [PubMed] [Google Scholar]
- Hess, M.W., and P. Siljander. 2001. Procoagulant platelet balloons: evidence from cryopreparation and electron microscopy. Histochem. Cell Biol. 115:439–443. [DOI] [PubMed] [Google Scholar]
- Hollingsworth, M., and A.M. Gilfillan. 1984. The pharmacology of lung surfactant secretion. Pharmacol. Rev. 36:69–90. [PubMed] [Google Scholar]
- Kapanci, Y., P.M. Costabella, P. Cerutti, and A. Assimacopoulos. 1979. Distribution and function of cytoskeletal proteins in lung cells with particular reference to “contractile interstitial cells.” Methods Achiev. Exp. Pathol. 9:147–168. [PubMed] [Google Scholar]
- Kliewer, M., E.K. Fram, A.R. Brody, and S.L. Young. 1985. Secretion of surfactant by rat alveolar type II cells: morphometric analysis and three-dimensional reconstruction. Exp. Lung Res. 9:351–361. [DOI] [PubMed] [Google Scholar]
- Liu, M., A.K. Tanswell, and M. Post. 1999. Mechanical force-induced signal transduction in lung cells. Am. J. Physiol. 277:L667–L683. [DOI] [PubMed] [Google Scholar]
- Mair, N., T. Haller, and P. Dietl. 1999. Exocytosis in alveolar type II cells revealed by cell capacitance and fluorescence measurements. Am. J. Physiol. 276:L376–L382. [DOI] [PubMed] [Google Scholar]
- Manabe, T., and H. Ikeda. 1986. Filamentary tubular inclusions in type II pneumocytes of the guinea pig. Anat. Rec. 216:55–59. [DOI] [PubMed] [Google Scholar]
- Mason, R.J., S.R. Walker, B.A. Shields, J.E. Henson, and M.C. Williams. 1985. Identification of rat alveolar type II epithelial cells with a tannic acid and polychrome stain. Am. Rev. Respir. Dis. 131:786–788. [DOI] [PubMed] [Google Scholar]
- Monck, J.R., and J.M. Fernandez. 1992. The exocytotic fusion pore. J. Cell Biol. 119:1395–1404. [DOI] [PMC free article] [PubMed] [Google Scholar]
- Muhr, A.H., and J.M.V Blanshard. 1982. Diffusion in gels. Polymer. 23:1012–1026. [Google Scholar]
- Neher, E. 1993. Cell physiology. Secretion without full fusion. Nature. 363:497–498. [DOI] [PubMed] [Google Scholar]
- Nemoto, T., R. Kimura, K. Ito, A. Tachikawa, Y. Miyashita, M. Iino, and H. Kasai. 2001. Sequential–replenishment mechanisms of exocytosis in pancreatic acini. Nat. Cell Biol. 3:253–258. [DOI] [PubMed] [Google Scholar]
- Pian, M.S., L.G. Dobbs, and N. Duzgunes. 1988. Positive correlation between cytosolic free calcium and surfactant secretion in cultured rat alveolar type II cells. Biochim. Biophys. Acta. 960:43–53. [DOI] [PubMed] [Google Scholar]
- Rahamimoff, R., and J.M. Fernandez. 1997. Pre- and postfusion regulation of transmitter release. Neuron. 18:17–27. [DOI] [PubMed] [Google Scholar]
- Rice, W.R., K.C. Osterhoudt, and J.A. Whitsett. 1984. Effect of cytochalasins on surfactant release from alveolar type II cells. Biochim. Biophys. Acta. 805:12–18. [DOI] [PubMed] [Google Scholar]
- Risco, C., C. Romero, M.A. Bosch, and P. Pinto da Silva. 1994. Type II pneumocytes revisited: intracellular membranous systems, surface characteristics, and lamellar body secretion. Lab. Invest. 70:407–417. [PubMed] [Google Scholar]
- Rooney, S.A. 1998. Lung Surfactant: Cellular and Molecular Processing. S.A. Rooney, editor. R.G. Landes Company, Austin, TX. 217 pp.
- Rooney, S.A., S.L. Young, and C.R. Mendelson. 1994. Molecular and cellular processing of lung surfactant. FASEB J. 8:957–967. [DOI] [PubMed] [Google Scholar]
- Rose, F., L.C. Kurth, U. Sibelius, K.H. Reuner, K. Aktories, W. Seeger, and F. Grimminger. 1999. Role of actin depolymerization in the surfactant secretory response of alveolar epithelial type II cells. Am. J. Respir. Crit. Care Med. 159:206–212. [DOI] [PubMed] [Google Scholar]
- Sano, K., D.R. Voelker, and R.J. Mason. 1987. Effect of secretagogues on cytoplasmic free calcium in alveolar type II epithelial cells. Am. J. Physiol. 253:C679–C686. [DOI] [PubMed] [Google Scholar]
- Savov, J., R. Silbajoris, and S.L. Young. 1999. Mechanical ventilation of rat lung: effect on surfactant forms. Am. J. Physiol. 277:L320–L326. [DOI] [PubMed] [Google Scholar]
- Scepek, S., J.R. Coorssen, and M. Lindau. 1998. Fusion pore expansion in horse eosinophils is modulated by Ca2+ and protein kinase C via distinct mechanisms. EMBO J. 17:4340–4345. [DOI] [PMC free article] [PubMed] [Google Scholar]
- Travis, E.R., and R.M. Wightman. 1998. Spatio-temporal resolution of exocytosis from individual cells. Annu. Rev. Biophys. Biomol. Struct. 27:77–103. [DOI] [PubMed] [Google Scholar]
- Tsilibary, E.C., and M.C. Williams. 1983. Actin and secretion of surfactant. J. Histochem. Cytochem. 31:1298–1304. [DOI] [PubMed] [Google Scholar]
- Warburton, D., S. Buckley, and L. Cosico. 1989. P1 and P2 purinergic receptor signal transduction in rat type II pneumocytes. J. Appl. Physiol. 66:901–905. [DOI] [PubMed] [Google Scholar]
- Williams, M.C. 1977. Conversion of lamellar body membranes into tubular myelin in alveoli of fetal rat lungs. J. Cell. Biol. 72:260–277. [DOI] [PMC free article] [PubMed] [Google Scholar]
- Wirtz, H., and M. Schmidt. 1992. Ventilation and secretion of pulmonary surfactant. Clin. Investig. 70:3–13. [DOI] [PubMed] [Google Scholar]
- Wirtz, H.R., and L.G. Dobbs. 1990. Calcium mobilization and exocytosis after one mechanical stretch of lung epithelial cells. Science. 250:1266–1269 [DOI] [PubMed] [Google Scholar]