

Abstract
Perceptual decisions are likely to be based on signals that are provided by populations of neurons in early sensory cortical areas. How these neural responses are combined across neurons and over time to mediate behavior is unknown. To study the link between neural responses and perceptual decisions, we recorded the activity of single units (SU) and multiple units (MU) in the primary visual cortex (V1) of monkeys while they performed a reaction-time visual detection task. We then determined how well the target could be detected from these neural signals. We found that, on average, the detection sensitivities supported by SU and MU in V1 are comparable with the detection sensitivity of the monkey even when considering neural responses during brief temporal intervals (median duration, 137 ms) that ended shortly before the monkey's reaction time. However, we observed systematic differences between the overall shape of the neurometric functions and the monkey's psychometric functions. We also examined the quantitative relationship between SU and MU activity and found that MU responses are consistent with the sum of the responses of multiple SU, most of which have low stimulus selectivity. Finally, we found weak but significant trial-to-trial covariations between V1 activity and behavioral choices, demonstrating for the first time that choice probability can be observed at the earliest stages of cortical sensory processing. Together, these results suggest that the activity of a large population of V1 neurons is combined suboptimally by subsequent processing stages to mediate behavioral performance in visual detection tasks.
Keywords: visual cortex, visual detection, neurometric function, choice probability, population coding, electrophysiology
Introduction
Stimuli in the environment elicit neural responses that are distributed over large populations of neurons in early sensory cortical areas. These distributed signals must then be read out, or decoded, by subsequent processing stages, to mediate behavior. The nature of this decoding process and, in particular, the identity and number of neurons that contribute to a given perception and the way signals from these neurons are combined to mediate behavior are unknown.
Hypotheses regarding the number of neurons that contribute to perception range from a handful of neurons to many thousands of neurons (for review, see Parker and Newsome, 1998). In several previous studies, the sensitivity of the subject was found to be comparable to the average sensitivity of single neurons (Britten et al., 1992; Celebrini and Newsome, 1994; Croner and Albright, 1999; Hernandez et al., 2000; Uka and DeAngelis, 2003; Heuer and Britten, 2004) or the sensitivity of the most selective neurons (Hawken and Parker, 1990; Vogels and Orban, 1990; Prince et al., 2000; Osborne et al., 2004; Liu and Newsome, 2005; Purushothaman and Bradley, 2005). However, even when the sensitivity of the neurons compared favorably with the sensitivity of the monkey, the trial-to-trial correlations between single-unit (SU) activity and behavioral choices were found to be weak (Britten et al., 1996), suggesting that perceptual decisions are based on a large number of neurons (Shadlen et al., 1996).
The current study examines the link between activity of primary visual cortex (V1) neurons and behavioral performance in a visual detection task. Determining the nature and quality of the signals carried by individual V1 neurons is a prerequisite for understanding how these signals might be combined to guide behavior. A central goal of the current study was therefore to characterize the detection performance of single V1 neurons. In contrast to most previous studies in which neuronal and behavioral performances were compared over a fixed and typically long stimulus presentation interval, in the current study we examined neural responses over a brief interval that ended shortly before the monkey's reaction time (RT), ensuring a more realistic comparison between neural and behavioral performances.
In addition, because perceptual decisions are likely to be based on signals from multiple neurons, multiple-unit (MU) activity may provide useful information regarding the quality of the signals in small pools of V1 neurons. It is commonly assumed that MU signals represent the summed spiking activity from multiple neighboring SU. This assumption, however, has not been examined quantitatively. A secondary goal of our study was therefore to determine the quantitative relationship between SU and MU activity in V1.
Finally, to determine the potential contribution of V1 neurons to detection, we examined choice probability (CP), which is the trial-to-trial covariation between V1 activity and behavioral choices.
Specifically, we addressed four primary questions: (1) How much task-related information is carried by V1 neurons? (2) How similar is the performance of simple models that base their decisions on the activity of V1 neurons to the monkeys' performance? (3) Are MU responses consistent with the sum of SU responses? and (4) Is variability in V1 responses correlated with variability in behavioral performance? Importantly, significant CP has not been observed in V1 in previous studies (Nienborg and Cumming, 2006).
Materials and Methods
Subjects and surgery
Three monkeys (Macaca mulatta) were used in this study. Monkeys underwent two surgical procedures. In the first procedure, a head-restraining device was implanted, and two custom-designed recording chambers were positioned over the skull above V1 in both hemispheres. After a recovery period, the animal went through an extensive period of training on the visual detection task. Animals were trained using standard operant conditioning techniques in which water and juice were used as positive rewards. During training and recording sessions (2–5 h long), each animal was seated comfortably in a primate chair with its head restrained. Once the animal reached a stable level of performance on the task, a second surgery was performed to prepare the monkey for optical and electrophysiological recordings. In this surgery, a cranial window was opened, and the dura was resected and replaced by a transparent artificial dura (Arieli et al., 2002). Within several weeks after this surgical procedure, the animal's dura healed and formed a tight seal around a silicone ring extending out from the artificial dura, leaving a central region clear for optical and electrophysiological recordings. The chamber was covered by a transparent plastic cover with a small hole plugged by a rubber gasket.
The animals used in this study were also used in voltage-sensitive dye (VSD) imaging experiments (Chen et al., 2006). Some electrophysiological recordings were conducted simultaneously with the imaging experiments, but most were conducted in separate sessions. We did not find significant differences in behavioral or neural performance between experiments in which electrophysiological recordings were conducted separately or simultaneously with VSD imaging. In addition, we did not observe any systematic changes in neuronal or behavioral sensitivities as a function of the number of VSD imaging sessions conducted before the electrophysiological recordings. These results suggest that VSD imaging does not have a short-term or a long-term effect on behavioral and neuronal detection sensitivities.
All surgical procedures were performed under deep anesthesia, using strictly sterile techniques, in a dedicated surgical suite. All procedures were approved by the University of Texas Institutional Animal Care and Use Committee and conformed to National Institutes of Health standards.
Task and visual stimulus
Each trial began when the animal achieved fixation in a small window (<2° full width) around a 0.1 × 0.1° central fixation point displayed against a uniform gray background (Fig. 1A, first panel). After the initial fixation period, the fixation point dimmed (Fig. 1A, third panel). In the target-absent trials (50% of trials), the monkey had to maintain gaze on the fixation point for an additional 1200 ms to receive the reward. In the target-present trials (50% of trials), the monkey was rewarded for making a saccade to the location of the Gabor target. The Gabor target appeared at a fixed location 300 ms after the dimming of the fixation point (Fig. 1A, fourth panel) and was removed 300 ms later or after the monkey detected the target. To get the reward, the monkey had to make a saccadic eye movement to the target within 600 ms of its onset (but at least 70 ms after target onset) and maintain gaze on the target location for 300 ms.
Figure 1.

Visual detection task. A, The monkey initially shifted gaze to a fixation point at the center of the screen. The fixation point then dimmed. Three hundred milliseconds later, a target could appear in the periphery. The monkey was allowed to make a saccade to the target location as soon as it had detected the target. Three hundred milliseconds later, the target was extinguished, but the monkey could still make a saccade to the target for another 300 ms. B, Time line for computing mean firing rates and spike counts. Mean firing rates and spike counts were computed over a period starting 36 ms after target onset and ending 20 ms before the monkey's saccade to the target [allowing for motor preparation (Motor Prep.) time] or 200 ms [maximal (max) integration time] after target onset, whichever came first. In this example, the rate/count was computed over just the light gray bar. The dark gray bar shows the overlap between the maximal integration interval and the motor preparation interval (black bar). C, Psychometric function describing how often the monkey reported the presence of the Gabor target as a function of the contrast of the target. The solid line is the best-fit Weibull function (see Materials and Methods). The dashed vertical line indicates the monkey's threshold. Note that threshold is defined as the contrast at which performance is 75% correct combined across target-present and target-absent trials. Because the false-alarm rate in this experiment was close to zero, threshold is the contrast at which the hit rate was ∼50%. The horizontal error bar is a 95% confidence interval of the threshold based on a bootstrap analysis (see Materials and Methods). The overall accuracy of the monkey in this experiment is indicated. Prob., Probability.
The parameters of the Gabor patch were adjusted to match the preferred parameters of the recorded SU or MU [mean eccentricity, 4.23°; range across experiments, 2.0–9.2°; mean ς of Gabor patch, 0.37°; range, 0.167–0.667°; mean spatial frequency, 1.90 cycles per degree (c.p.d.); range, 0.62–4.37 c.p.d.; no orientation bias seen]. These parameters were not changed within a block of trials. Four to seven contrast levels (minimum of 2% up to a maximum of 50%) were used for the target, encompassing the animal's detection threshold. Within a block of trials, target-present trials at different contrasts were randomly interleaved with an equal number of target-absent trials.
Visual stimuli were presented on a gamma-corrected high-end 21 inch color display at a fixed mean luminance of 30 cd/m2. The display subtended 20.5 × 15.4° at a viewing distance of 108 cm, had a pixel resolution of 1024 × 768, had 30-bit color depth, and had a refresh rate of 100 Hz.
Electrophysiology
A tungsten microelectrode (0.5–1.5 MΩ; Frederick Haer Company, Bowdoinham, ME) ensheathed in a protective metal guide tube was lowered to just above V1 through a rubber gasket positioned within a transparent plastic cover sealing the recording chamber. Once the guide tube penetrated the rubber gasket, we advanced the electrode until it extended out from the guide tube by 3–5 mm and then locked it in place. We then advanced the electrode through the artificial dura with a hydraulic microdrive (Narishige, Tokyo, Japan) until a single neuron and/or a cluster of MU was isolated. A dual slope/height window discriminator (Bak Electronics, Germantown, MD) was used to isolate spikes from single neurons. A second independent window was used to accept spikes from several neurons, so MU activity could be recorded concurrently with SU activity.
When recording SU and MU simultaneously, spikes from the SU channel were excluded from the events of the MU channel. Across experiments, the slope and the delay of the slope/height window discriminator were manually adjusted to maximize the chance of detecting spikes. We used the lower threshold of the height window to control the rate of acceptance of a voltage deflection as MU events. The position of this criterion is arbitrary. A high criterion is likely to lead to acceptance of spikes from a small number of single neurons that are near the tip of the electrode. A lower criterion is likely to lead to acceptance of spikes from a larger number of neurons but potentially also to acceptance of some voltage deflections that are not attributable to action potentials. One of the goals of the current study was to examine the effect of pool size on neural performance in the detection task. We therefore varied the level of the lower criterion of the height window across experiments, aiming to sample MU sites with a wide range of pool sizes. Because the number of neurons that contribute to the MU activity is likely to be related to the level of baseline (spontaneous) MU activity, we adjusted the criterion to obtain different levels of baseline MU activity at different recording sites. Across our data set, the range of MU baseline firing rates was ∼1.2 events/s to ∼160 events/s. The SU baseline firing rates obtained in our study ranged from ∼0.11 spikes/s to ∼3.67 spikes/s, with the median SU baseline firing rate at 1.70 spikes/s.
After isolation, we qualitatively analyzed the receptive field properties of the recorded neuron(s). If recording from both an SU and an MU cluster simultaneously, the stimulus was modified to maximize the single neuron responses. This was done using a custom software package (courtesy of G. DeAngelis, Washington University, St. Louis, MO) that allowed interactive variation of the parameters (location, size, orientation, and spatial frequency) of a sinusoidal grating while monitoring neural responses. Based on the initial analysis of the receptive field properties, we performed an additional quantitative assessment using a sine-wave grating presented for 300 ms for a minimum of five trials per condition to identify the preferred orientation of the neuron(s). At some of the sites, we also quantitatively assessed the preferred size (at a fixed spatial frequency of 3 c.p.d.) and spatial frequency (with size fixed at the preferred value) of the recorded neuron(s). To assess the preferred size and spatial frequency, a block of trials with Gabor patches of various sizes or spatial frequencies was run. The smallest size or lowest spatial frequency that gave the maximal response was used for the target detection block. In general, the size increased, and the spatial frequency decreased with increased receptive field eccentricity (supplemental Fig. 1, available at www.jneurosci.org as supplemental material). Bandwidth did not change systematically across eccentricity.
Analysis of behavioral data
For a target-present trial, the trial was scored a hit if the monkey made an eye movement to the target within the specified time frame (70–600 ms after target onset), and the trial was scored a miss if the monkey failed to shift its gaze out of the fixation window. For target-absent trials, the trial was scored a correct rejection if the monkey maintained fixation for the entire length of the trial. The trial was scored a false alarm if the monkey moved its gaze toward the target location. If the animal made a saccade outside of the specified time frame, or made a saccade to a non-target location, the trial was immediately aborted and not used for behavioral or neurophysiological analysis. RT for hits and false alarms was denoted as the duration of the interval between target onset and the time at which the monkey's gaze first left the fixation window (en route to the target location).
Behavioral performance was fitted using maximum likelihood estimation by a modified cumulative Weibull function (Green and Swets, 1966):
 |
where P(C) is the probability that the subject would report that the target was present as a function of target contrast C; α and β are the offset and slope terms, respectively; and γ is the false-alarm rate. The detection threshold (T) was defined as the target contrast at which the monkey was 75% accurate taking into account both the hit and the false-alarm rates. The overall accuracy was defined as the rate at which the monkey correctly performed the task across all of the trials: accuracy = (#hits + #correct rejects)/#total trials.
Behavior monitoring and data acquisition were performed by a personal computer (PC) running software for real-time neurophysiological recordings from alert animals (Tempo; Reflective Computing, St. Louis, MO). This computer interfaced with an infrared eye-tracker (Dr. Bouis Devices, Karlsruhe, Germany) for high-quality analog eye position monitoring. Eye position signals were sampled with 16-bit resolution at 250 Hz. Electrophysiological signals were sampled at 1 kHz. The data acquisition computer also interfaced with the system used to acquire electrophysiological data (Bak Electronics, Mount Airy, MD). In addition, this computer controlled a dedicated PC with a high-end graphics card that was used for stimulus presentation.
Analysis of physiological data
Integration period.
Neural responses were integrated during a short period that started 36 ms after stimulus onset and ended at variable times depending on the monkey's RT (Fig. 1B). We selected 36 ms for the beginning of the integration period because it was approximately the shortest latency of the response to high-contrast targets. The default maximal time for the integration interval was 200 ms after stimulus onset. However, if the RT for a trial was <220 ms, the integration period ended 20 ms before the monkey initiated the saccade to the target. We ended the integration period 20 ms before the saccade to allow for sufficient time between the formation of a decision and the monkey's actual eye movement. We refer to this 20 ms period as the minimal motor response time (MMRT). We also considered other possible values of MMRT and maximal integration time. In addition, we compared results obtained using variable integration times with results obtained using a fixed integration time.
Jackknife procedure.
We used a jackknife procedure to ensure that we did not overestimate the performance of the ideal observer (see Results). In this procedure, a separate analysis was performed for each of the n trials in an experiment. For each trial, an optimal criterion was established based on the remaining n − 1 trials. The criterion was then applied to the spike count/rate value from the single excluded trial. The trial was classified as correct if the spike count/rate exceeded the criterion for a target-present trial, or if it was below the criterion for a target-absent trial. This procedure was repeated for every trial in an experiment to obtain the neurometric function.
Bootstrap analysis.
We performed two types of bootstrap tests. In the first test, we determined whether a single parameter (overall accuracy, T, β, or γ) was significantly different between the neurometric and psychometric functions. In the second more stringent test, we asked whether the overall shapes of the two functions were significantly different, taking into account all of the parameters of the neurometric and psychometric functions simultaneously.
To generate new bootstrap samples for the behavioral and the neural performances, each point on the neurometric and psychometric functions was replaced by drawing a random number from a binomial distribution with parameters n and p, where n is the number of trials and p is the proportion of trials in which the subject reported that the target was present for that contrast level. The new data points were then fitted with the modified Weibull function to give new estimates for overall accuracy, T, β, and γ. This procedure was repeated 1000 times to give distributions of estimates for each parameter. To determine whether a given parameter was significantly different between the two functions, the 1000 bootstrap samples from each function were paired, and the distribution of the differences between them was computed. The p value was estimated as the proportion of the differences that fell below zero (if the median difference was positive) or above zero (if the median difference was negative).
To determine whether the overall shapes of the two functions were significantly different, we combined the three parameters used to describe the neurometric and psychometric functions (T, β, and γ) into a single variable using linear discriminant analysis (Duda et al., 2001). We then measured the distance (in units of d′) between these two distributions. To determine the statistical significance of this distance, we replaced the second function with another binomial draw from the values of the first function. We then used the same method to compute the distance between these two functions. We repeated this analysis 1000 times, to obtain a “null” distribution of distances. The p value for the distance between the two original functions was computed as the proportion of distances in the null distribution that exceeded the measured distance.
To find the criterion that minimizes the difference between the neurometric and psychometric functions, we used the procedure described above to compute d′ between the neurometric and psychometric functions for each possible criterion and selected the criterion that minimized d′.
Monte Carlo analysis of independent SU.
We simulated the performance of a pool of independent, similarly tuned SU using a simple Monte Carlo analysis. To simulate a pool of N units, N SU were randomly chosen (with replacement) from the set of recorded single neurons. To simulate a single trial, the response of each neuron was randomly selected from the responses of the neuron at that contrast, and the pooled response on that trial was computed as the sum of the responses from the N neurons. Each simulated experiment included 20 trials for each of five target contrasts and 100 blank trials. We then computed the neurometric function from these simulated pooled neural responses and extracted the fitted parameters of the neurometric function. These steps were repeated 100 times with different random pools of the same size, and the mean and SD of the parameters for the neurometric functions were noted. The above steps were repeated for pool sizes of two neurons up to 33 neurons.
Analysis of CP
We performed a separate CP analysis for target-present trials (hits vs misses) and for target-absent trials (correct rejects vs false alarms). For each SU and MU site, only target contrasts for which at least three trials were obtained in each behavioral category were analyzed. For a given contrast, firing rates in all trials (regardless of behavior) were first converted into z-scores by subtracting the mean response and dividing by the response SD. z-score values were then combined across contrasts to form two distributions for the two possible behaviors (say hits vs misses). CP values were computed for each site as the area under the receiver operating characteristic (ROC) curve (Green and Swets, 1966) between these two combined distributions. To equate the integration times of hits and misses, misses were randomly assigned integration times from the distribution of RTs on the hit trials from the same contrast condition. This procedure was repeated 1000 times, and the mean CP was reported for each site. The same method was used for the target-absent condition (correct rejects were assigned false alarm integration times). Significance of the CP was assessed using a permutation test (Britten et al., 1996).
Analysis of eye movements
We investigated the effects of four indicators of eye movements during the period in which neural responses were averaged: (1) average distance from the fixation point, (2) average distance from the target, (3) average velocity, and (4) maximal instantaneous velocity. The average distances are the mean distance between the center of gaze and the fixation point or the target location during the integration period. The average velocity is the overall distance the eye moved during the integration period divided by its duration. Instantaneous velocity is the maximum instantaneous velocity of the eye during the integration period.
To determine whether eye movements affect the relative neural and behavioral sensitivities, we split each experiment in half and computed overall accuracy for the half containing the trials with the lower-than-median eye movement values and the half with the higher-than-median eye movement values for each of the four indicators (Table 1). Ten experiments were excluded from this analysis because splitting the data to two halves left too few trials to evaluate the performances of the model and the monkey.
Table 1.
Effect of eye movements on neural and behavioral accuracies
| Overall accuracy | 50% best | 50% worst | Mean difference | p value (t test) |
|---|---|---|---|---|
| Monkey | ||||
| Mean distance from fixation | 79.25% | 78.50% | 0.75% | 0.50 |
| Mean distance from target | 78.45% | 79.44% | −0.99% | 0.35 |
| Mean velocity | 78.84% | 78.83% | 0.01% | 0.99 |
| Instant. velocity | 78.77% | 79.15% | −0.38% | 0.72 |
| Model | ||||
| Mean distance from fixation | 74.55% | 71.90% | 2.65% | 0.09 |
| Mean distance from target | 74.34% | 72.54% | 1.80% | 0.24 |
| Mean velocity | 73.71% | 73.00% | 0.71% | 0.63 |
| Instant. velocity | 73.77% | 72.41% | 1.36% | 0.40 |
Instant., Instantaneous.
To examine the potential contribution of eye movements to CPs, we determined whether neural responses were significantly correlated with the four eye movement indicators.
Neuron database
The results here are based on 62 MU recordings and 33 SU recordings. SU/MU recordings had to meet three criteria to be included in our analysis: (1) minimum of eight repetitions per condition; (2) overall behavioral accuracy within 70–95% (so that we could reliably estimate the parameters of the psychometric function); and (3) stable baseline neural activity across the entire block (discussed below). Of the 55 single neurons that were initially screened, 22 were excluded because isolation was not maintained for long enough to collect a minimum of eight repetitions per condition. All of the original 78 MU experiments resulted in eight repetitions per condition. Four experiments were excluded based on the behavioral accuracy falling outside of the accepted range. In addition, the recordings of 12 MU experiments were found to be unstable over time.
To assess the stability of the MU responses across a block of trials, baseline activity for each trial was computed as the spike rate in the 300 ms interval before the fixation point dimming. Baseline activity was averaged over bins of 10 consecutive trials. Then, the trial order was randomly shuffled, and again, baseline activity was averaged over bins of 10 consecutive trials. This was done 1000 times to obtain 95% confidence intervals on the baseline measurement. If a significant number of the original data points (bins of 10 trials) fell outside of the 95% confidence interval, then the block was considered unstable and removed from the database. We used the binomial distribution to determine how many times the data had to fall outside of the 95% confidence interval to be considered significantly unstable.
Results
Monkeys were trained to detect a small oriented visual target and indicate target presence by shifting gaze to the target location as soon as it was detected (Fig. 1A). The target appeared in half of the trials. In the remaining target-absent trials, the monkey was rewarded for maintaining fixation. Target contrast was randomly selected from several contrast levels spanning the monkey's detection threshold.
While the monkey performed the detection task, we used extracellular recording techniques to measure the activity of SU and MU in V1. The results reported here are based on recordings from 33 SU and 62 MU sites in five hemispheres of three monkeys. To maximize the probability that the recorded neurons would contribute to performance in the task, at each recording site, the stimulus was tailored to match the preferred stimulus parameters of the recorded neuron(s) (see Materials and Methods).
We started our analysis by assessing the behavioral sensitivity of the monkey and comparing it with the detection sensitivity that can be supported by the activity of SU and MU in V1. Next, we compared the shapes of the neurometric and psychometric functions. We then proceeded to analyze the quantitative relationship between the SU and the MU responses. Finally, we examined the trial-to-trial covariation between V1 activity and behavioral choices.
Assessing behavioral detection sensitivity
Figure 1C shows the behavioral performance of the monkey in one experiment. Each point represents the proportion of trials in which the monkey indicated that the target was present as a function of target contrast. Target contrast of zero represents the half of the trials in which the target was absent. Performance was fitted with a psychometric function (solid black line) derived from a modified Weibull function (Quick, 1974) (see Materials and Methods). We assessed the detection sensitivity of the monkey with two measures: detection threshold (T), which was defined as the target contrast at which performance was 75% correct (combined across target-present and target-absent trials), and overall accuracy (overall percentage correct across a block of trials). The monkey's detection threshold in this experiment is depicted with a vertical dashed line (Fig. 1C).
The time it took the monkey to initiate a saccade to the location of the target depended on the target contrast. Figure 2A shows the mean RT of the three monkeys at different target contrasts collapsed across all experiments. As target contrast was lowered, average RTs became significantly longer (significance test for regression slope; p = 0.008). These results suggest that longer durations are required to reach perceptual decisions regarding the presence of the target at lower target contrasts.
Figure 2.

Mean RTs. A, Mean RTs as a function of binned target contrast collapsed across all experiments (n = 74). Data points lie in the middle of the bin. B, Mean RTs for experiments in which the false-alarm rate was above 15% (n = 21). RTs at target contrast equal to zero correspond to false-alarm trials. Target contrast bins are (0, 2–3, 4–6, 7–10, 11–15, 16–20, 21+). Solid line represents best linear fit of mean RT as a function of log contrast in target-present trials. Error bars are SEs across experiments.
Interestingly, the average RT in target-absent trials (false alarms) was shorter than the average RT at low target contrasts. This difference, however, was attributable to the fact that in many experiments the monkey made almost no false alarms, and in those experiments RTs tended to be longer. In fact, in the subset of experiments with false-alarm rates >15%, RTs were very short even at the lowest target contrasts (Fig. 2B). In this subset of the experiments, average RTs were indistinguishable in false alarms and in target-present conditions with hit rates comparable to the false-alarm rates (paired t test, p = 0.74; n = 18). These results suggest that, in some experiments, the monkey tended to make fast saccades to the target location even in the absence of sufficient sensory evidence. Such “fast guesses” could explain the drop in the average RT in false-alarm trials.
Fast guesses could also lead to a drop in the monkey's detection sensitivity. This effect, however, appears to be small. In the two animals with significant false-alarm rates, behavioral thresholds in experiments with above the median false-alarm rates were not significantly different from behavioral thresholds in experiments with below the median false-alarm rates (paired t test, p > 0.1 for both monkeys).
Target eccentricities varied across sites from ∼2 to ∼9°. Across our data set as a whole, behavioral detection thresholds tended to increase with stimulus eccentricity (Fig. 3A). This was true despite the fact that the parameters of the visual target were matched to the preferred parameters of the neuron(s) at the recording site and therefore increased in size and decreased in spatial frequency with increasing eccentricities (supplemental Fig. 1, available at www.jneurosci.org as supplemental material).
Figure 3.
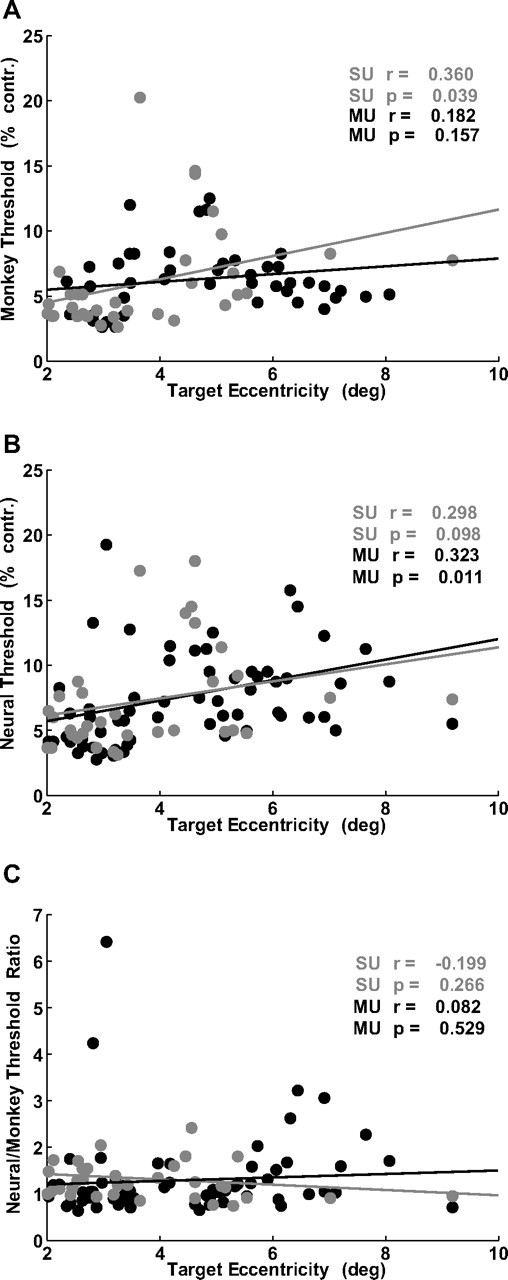
The relationship between target eccentricity and behavioral and neuronal detection thresholds. A, Scatter plot of behavioral thresholds as a function of target eccentricity. Because the target parameters were matched to the preferred parameters of the recorded V1 neuron(s), the size of the target increased with eccentricity, and the spatial frequency decreased with eccentricity (supplemental Fig. 1, available at www.jneurosci.org as supplemental material). B, Scatter plot of neural detection thresholds for the rate model versus target eccentricity. C, Scatter plot of the ratio of neural over behavioral detection thresholds versus target eccentricity. Black data points are MU, and gray data points are SU. Black lines show the best-fit linear regressions for the MU data, and the gray lines show the best-fit linear regressions for the SU data. The Pearson correlation coefficient r and its significance value p are indicated in each panel for SU and MU separately. contr., Contrast.
To compare the monkey's detection sensitivity with the detection sensitivity of SU and MU in V1, we next used an ideal observer analysis that allowed us to evaluate the neural responses with the same metrics used to describe the monkey's performance.
Ideal observer analysis of neural detection sensitivity
We used the responses of one SU site and one MU site as example experiments (Fig. 4). Both SU and MU responses in the example experiments increased monotonically with target contrast. We used a simple model based on signal detection theory (Green and Swets, 1966) to quantify the detection sensitivity that could be supported by these neural signals. Specifically, the model allowed spiking activity in single trials to be converted into decisions about the presence or the absence of the target.
Figure 4.

Peristimulus time histograms from two representative recording sites. A, SU. B, MU. Neural responses were averaged over repetitions (n = 10 for each target contrast; n = 50 for target-absent trials). Bin size is 25 ms, and data points lie in the middle of the bin period. Vertical blue lines denote stimulus onset (time 0) and offset (time 300 ms). For conditions with at least four hits, colored arrows indicate the median RT. Horizontal black lines denote typical times of neural integration. The key shows target contrasts; 0% contrast = target-absent trials. SU and MU recordings are from different sites. sp, Spikes.
Neural responses of SU or MU sites were first integrated over a short temporal window (median duration, 137 ms) that started 36 ms after stimulus onset and ended either 20 ms before the onset of the monkey's saccadic response, allowing for a MMRT, or 200 ms after stimulus onset, whichever occurred first (Fig. 1B) (see Materials and Methods).
We initially considered two models for detecting the target from the neural responses in single trials. The first model (summation) used the raw integrated responses to detect the target. In the second model (rate), the integrated responses in each trial were divided by the duration of the integration interval (which varied from trial to trial) to obtain an average spike/event rate.
Spike counts and spike rates were compiled into separate histograms for each target contrast (Fig. 5A,B, summation, C,D, rate), with target-present trials shown as filled bars alongside distributions of an equivalent number of target-absent trials (open bars). There was almost no overlap between the spike count and spike rate distributions in target-present and target-absent trials at the highest target contrast (Fig. 5A–D, top panels). As the target contrast was lowered, significant overlap was seen.
Figure 5.
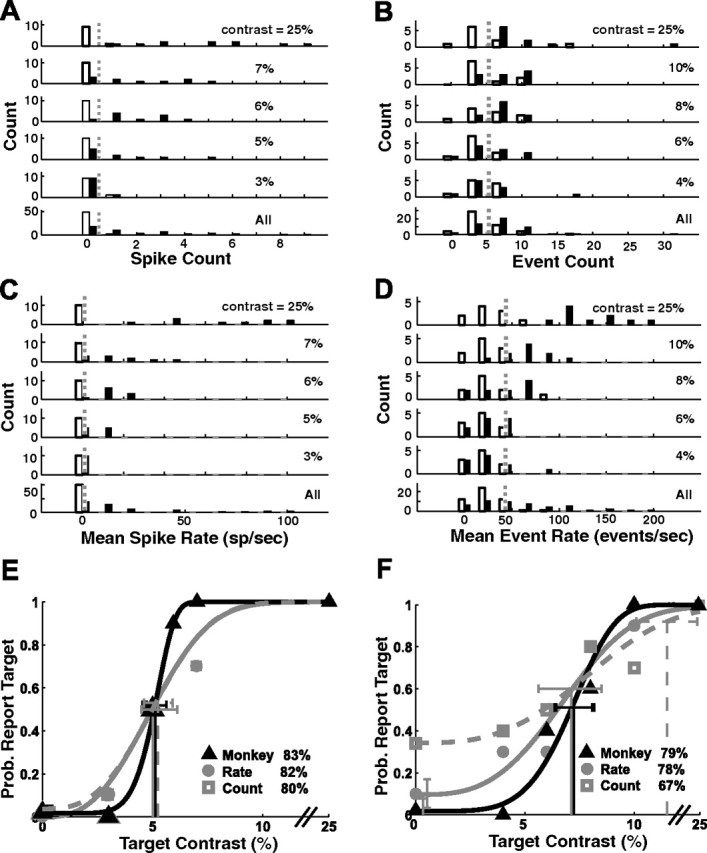
Response distributions and neurometric/psychometric functions. A, Distributions of spike counts for target-present trials (filled bars) and target-absent trials (open bars) from the SU recording session shown in Figure 4A. Spikes were counted during the integration period described in Figure 1B. B, MU spike counts from the recording session shown in Figure 4B. Dashed vertical lines in A and B are optimal criteria for the summation model. C, D, Same as A and B, but for spike rates rather than spike counts. E, F, Comparison of the monkey's performance with that of the count and rate models that base their decisions on the neural responses in single trials. Each point represents the probability that the observer (monkey or model) would indicate the presence of the target. E, SU neurometric and psychometric functions (same experiment as Fig. 4A). F, MU neurometric and psychometric functions (same experiment as Fig. 4B). Overall accuracy is listed in each panel. Detection thresholds (T) are shown with thin vertical lines. Error bars show 95% confidence intervals for threshold (horizontal) and false-alarm rate (vertical). Prob., Probability.
Our primary goal here was to compare the neural sensitivity implied by the distributions in Figure 5A–D with the behavioral sensitivity of the monkey. A common measure of the detection sensitivity implied by two distributions is the area under the ROC curve (Green and Swets, 1966). This measure, however, cannot be applied to the distributions in Figure 5A–D because in our task, the monkey did not know in advance what would be the contrast of the target. Computing a separate ROC value for each contrast is equivalent to allowing the observer to select a different criterion at each contrast. In our task, however, the monkey has to adopt a single criterion that would apply to all target contrasts. We can find the optimal single criterion for the distributions in Figure 5A–D by comparing the distribution of responses in all target-present trials (combined across all target contrasts) with the distribution of responses in all target-absent trials (Fig. 5A–D, bottom panels). The ideal observer model used a criterion (Fig. 5A–D, dashed vertical lines) that minimized the total number of errors (misses plus false alarms). Once the optimal criterion had been selected, it was used to determine what percentage of trials the model would classify as target-present for each target contrast (Fig. 5E,F, gray symbols). The same modified Weibull function used to fit the monkey's behavioral data was used to fit the neural data and construct neurometric functions for the two models (Fig. 5E,F, gray curves). From these neurometric functions, we computed the detection threshold and the overall accuracy for the summation and rate models.
To ensure that we did not overestimate the detection sensitivity of the neuron(s), the analysis was performed for each trial separately using a jackknife procedure (Efron and Tibshirani, 1993) (see Materials and Methods).
Similar to the behavioral thresholds, neural detection thresholds were correlated with stimulus eccentricity (Fig. 3B) for both SU and MU. As stimulus eccentricity increased, neural detection threshold also tended to increase. This is somewhat surprising because the parameters of the visual target were matched to the preferred parameters of the recorded neuron(s). The ratios of the neural to behavioral threshold were not significantly correlated with eccentricity (Fig. 3C), indicating that eccentricity had a similar effect on neural and behavioral sensitivity in our data set.
Comparing neural and behavioral detection sensitivities
In the example SU site, the performance of both models was comparable to that of the monkey (overall accuracy of summation model, 80%; rate model, 82%; monkey, 83%). In the example MU site, the summation model performed significantly worse than the monkey (overall accuracy of summation model, 67% vs monkey, 79%; bootstrap test, p = 0.008). The performance of the rate model, in contrast, was comparable to that of the monkey (overall accuracy, 78%).
Across our data set, the summation model was significantly less accurate than the monkey (Table 2). This was true whether the neural performance was based on SU or MU responses. The average accuracy of the rate model, on the other hand, was not significantly different from the average accuracy of the monkey (Table 2, Fig. 6A) for both SU and MU.
Table 2.
Quantitative comparison of the psychometric functions with the ideal-observer neurometric functions
| Physiology mean (SEM) | Behavior mean (SEM) | p value (t test) | |
|---|---|---|---|
| Accuracy (% correct) | |||
| Rate model (SU) | 75.66% (1.26%) | 78.62% (1.11%) | 0.082 |
| Summation model (SU) | 72.31% (1.18%) | 78.62% (1.11%) | <0.001 |
| Rate model (MU) | 76.83% (1.01%) | 78.53% (0.75%) | 0.177 |
| Summation model (MU) | 69.41% (1.52%) | 78.53% (0.75%) | <0.001 |
| Threshold (T) | |||
| Rate model (SU) | 7.29% (0.70%) | 6.10% (0.69%) | 0.231 |
| Rate model (MU) | 7.46% (0.41%) | 6.21% (0.36%) | 0.046 |
| Slope (β) | |||
| Rate model (SU) | 3.87 (0.68) | 8.43 (0.64) | <0.001 |
| Rate model (MU) | 4.22 (0.60) | 9.18 (0.76) | <0.001 |
| False-alarm rate (γ) | |||
| Rate model (SU) | 4.56% (1.16%) | 8.13% (1.44%) | 0.058 |
| Rate model (MU) | 10.26% (1.18%) | 9.75% (1.25%) | 0.768 |
Figure 6.

Scatter plots of the parameters of the monkey's psychometric functions versus the parameters of the neurometric function for the rate model. A, Overall accuracy. B, Detection threshold (T). C, Slope (β). D, False-alarm rate (FA; γ). Filled data points indicate experiments in which a bootstrap test found a significant difference in a parameter value between the monkey and the neuron(s). Gray squares, MU (n = 62); black triangles, SU (n = 33). Histograms show the ratio of the values for each parameter, neuron(s)/monkey. To compute the ratio in D, at sites in which the monkey's false-alarm rate was equal to zero, it was arbitrarily set to 1%. The filled gray histograms are for MU, and the black outlined histograms are for SU. Arrows (gray, MU; black, SU) indicate median ratio. Asterisks indicate significant difference between the model and the monkey based on a paired t test. Diagonal lines are unity lines, not fits to the data.
Additional analysis (discussed below) indicated that the accuracy of the summation model could not be significantly improved by integrating neural responses over shorter or longer intervals. These results demonstrate that a model that bases its decisions on spike counts of SU or MU in V1 is relatively inefficient and is inconsistent with the monkey's performance in the detection task. The rate model, however, showed an average detection sensitivity that was comparable to that of the monkey. We therefore proceeded to quantitatively compare the shape of the neurometric functions of the rate model with the shape of the psychometric functions.
In the example experiments, the detection thresholds of the rate model (T = 5.0% in the SU site; T = 6.62% in the MU site) were also comparable to the monkey's detection thresholds (T = 5.2% in the SU site; T = 7.25% in the MU site). Across all experiments, average detection thresholds were slightly lower for the monkey than for the rate model for both SU and MU (Table 2, Fig. 6B).
Behavioral and neural thresholds varied somewhat between the three monkeys. In particular, one monkey had significantly lower neural and behavioral thresholds than the other two animals, probably because of the lower eccentricities of the recording sites in this animal (Table 3).
Table 3.
Threshold and stimulus parameters per monkey
| Monkey | Mean behavioral threshold (SEM) | Mean neural threshold (SEM) | Target eccentricity (°) (SEM) | Target sigma (SEM) | Target bandwidth (SEM) | Target spatial frequency (c.p.d.) (SEM) |
|---|---|---|---|---|---|---|
| R (n = 32 sites) | 7.61 (0.66) | 9.35 (0.63) | 5.39 (0.21) | 0.411 (0.02) | 1.23 (0.09) | 1.32 (0.07) |
| P (n = 8 sites) | 7.64 (0.64) | 8.21 (1.01) | 4.98 (0.50) | 0.412 (0.04) | 1.03 (0.13) | 1.62 (0.20) |
| B (n = 34 sites) | 4.49 (0.24) | 6.31 (0.61) | 3.28 (0.26) | 0.279 (0.01) | 0.99 (0.08) | 2.46 (0.17) |
In the 21 experiments in which both SU and MU were recorded simultaneously from the same microelectrode, there was no significant difference between SU and MU in overall accuracy and threshold under the rate model (Table 4). The quantitative relationship between SU and MU activity is further analyzed below.
Table 4.
Comparison of neurometric functions for SU and MU recorded simultaneously
| Mean (SEM) |
p value(t test) | ||
|---|---|---|---|
| SU (n = 21) | MU (n = 21) | ||
| Accuracy (% correct) | |||
| Rate model | 74.39% (1.65%) | 77.57% (1.45%) | 0.154 |
| Threshold (T) | |||
| Rate model | 7.28% (0.90%) | 6.07% (0.67%) | 0.287 |
| Slope (β) | |||
| Rate model | 4.29 (1.00) | 5.08 (1.08) | 0.593 |
| False alarm rate (γ) | |||
| Rate model | 5.64% (1.71%) | 12.41% (2.45%) | 0.029 |
Our finding that the detection sensitivities of SU and MU in V1 using the rate model were comparable to the monkey's detection sensitivity demonstrates that V1 neurons are highly sensitive to stimuli near detection threshold even when using brief, behaviorally relevant integration periods. In addition, it also shows that detection sensitivity of SU is comparable to that of MU.
Quantitative comparison of the shapes of the neurometric and psychometric functions
Although the overall accuracies and thresholds of the monkey and the rate model were comparable in the example experiments, there were significant differences in the shapes of the neurometric and psychometric functions. In the SU recording site (Fig. 5E), the slope (β) of the neurometric function for the rate model was significantly shallower than the slope of the psychometric function (p = 0.012, bootstrap test) (see Materials and Methods). In the MU recording site (Fig. 5F), the neural false-alarm rate (γ) of the rate model was significantly higher than the monkey's false-alarm rate (p = 0.022, bootstrap test).
Across our data set, we found systematic differences between the shapes of the psychometric and the neurometric functions (Table 2). Most notably, the slopes of the neurometric functions tended to be significantly lower than those of the psychometric functions (Table 2, Fig. 6C), demonstrating that task difficulty affects neural and behavioral performances differently. These results indicate that the performance of an ideal observer model that bases its decision on the spike rate of a SU or a small pool of neurons in V1, although highly sensitive, is inconsistent with the behavioral performance of the monkey.
An additional difference between the neurometric and psychometric functions was that for many of the SU sites the neurometric function had a lower false-alarm rate than the monkey (Fig. 6D). The reason for this low false-alarm rate is simple. For many SU, in the vast majority of target-absent trials the neuron did not fire at all during the short integration interval (Fig. 5A). Because the ideal observer had to use a criterion that was larger than zero, the false-alarm rate of the ideal observer was typically very low. Because the level of baseline activity was much higher for MU sites, a rate model that based its decisions on MU activity had an average false-alarm rate comparable to that of the monkey (Table 2, Fig. 6D).
Similar results were obtained in a site-by-site bootstrap analysis that compared the overall shape of the neurometric and psychometric functions (simultaneously taking into account T, β, and γ; see Materials and Methods). In the majority of the SU sites (26 of 33) and MU sites (51 of 62), the psychometric and neurometric functions were found to be significantly different.
The models that we considered so far used the optimal criterion to separate target-present from target-absent trials. In reality, the monkey may not be able to use the optimal criterion to perform the detection task. We therefore determined whether suboptimal criteria could provide a significantly better match between the psychometric and neurometric functions. For each SU and MU site, we varied the detection criterion and found the criterion that produced a neurometric function that was most consistent with the psychometric function (see Materials and Methods). We then compared the average parameters of the psychometric function with the average parameters of these new neurometric functions (Table 5).
Table 5.
Comparison of the psychometric functions with the neurometric functions that are most consistent with behavior
| Mean (SEM) |
p value (t test) | ||
|---|---|---|---|
| Physiology | Behavior | ||
| Accuracy (% correct) | |||
| Rate model (SU) | 73.94% (0.99%) | 78.62% (1.11%) | 0.003 |
| Rate model (MU) | 75.03% (0.90%) | 78.53% (0.75%) | 0.004 |
| Threshold (T) | |||
| Rate model (SU) | 7.26% (0.83%) | 6.10% (0.69%) | 0.291 |
| Rate model (MU) | 7.64% (0.45%) | 6.21% (0.36%) | 0.016 |
| Slope (β) | |||
| Rate model (SU) | 4.69 (0.75) | 8.43 (0.64) | 0.003 |
| Rate model (MU) | 4.01 (0.43) | 9.18 (0.76) | <0.001 |
| False-alarm rate (γ) | |||
| Rate model (SU) | 8.41% (1.61%) | 8.13% (1.44%) | 0.897 |
| Rate model (MU) | 15.64% (1.80%) | 9.75% (1.25%) | 0.009 |
For the SU and MU sites, the neurometric functions were still significantly shallower, on average, than the psychometric functions even when using the criterion that minimized the difference between the neurometric and psychometric functions at each site. Furthermore, the accuracies of the model were now significantly lower, on average, than the accuracies of the monkey (Table 5).
The most consistent difference between the neurometric and psychometric functions was the steeper slopes of the psychometric functions. For the vast majority of the SU (30 of 33) and the MU (45 of 62) sites, no criterion (optimal or suboptimal) could be found that would produce a neurometric function with an equal or steeper slope and an equal or lower threshold than those of the monkey.
In addition, we performed a simple Monte Carlo analysis to examine how the shape of the neurometric function changes as a function of the size of a pool of independent, similarly tuned SU (see Materials and Methods). The performances of simulated pools of different sizes were compared with the average performance of the monkey (Fig. 7, solid horizontal lines). As the size of the pool increased, the accuracy of the pooled response became higher and the threshold became lower, exceeding the monkey's detection sensitivity for pools of eight or more neurons (Fig. 7A,B). False-alarm rates initially increased but then decreased to a level lower than that of the monkey at large pool sizes. In the range of five to seven pooled SU, the average accuracy, threshold, and false-alarm rate for the pooled responses were all comparable to those of the monkey, yet the slope of the neurometric function remained lower than the slope of the monkey's psychometric function. In fact, there was no pool size for which the slopes could be matched. We consider possible ways in which the neurometric function could be steepened in the Discussion.
Figure 7.

Monte Carlo simulations of the performance of summed independent SU as a function of the number of neurons in the pool. A, Expected accuracy (percentage correct). B, Expected threshold. contr., Contrast. C, Expected slope. D, Expected false-alarm rate. Each data point is the mean of 100 random combinations (with replacement) of SU from our data set. Error bars are SD. Solid lines are the mean values for the monkeys' behavior during the 33 SU recordings. Dashed lines are the mean values for the 62 MU recordings. The point at n = 1 is the average value for the SU.
The dashed horizontal lines in Figure 7 show the average parameters of the neurometric functions based on MU responses. The average detection sensitivity of the MU responses was significantly lower than the predicted detection sensitivity based on simulations of pools of eight or more independent and similarly tuned SU. Additional analysis of the quantitative relationship between SU and MU responses described below revealed some possible sources for this discrepancy.
Overall, our results demonstrate significant inconsistencies between neural and behavioral performances when using models that base their decisions on spike counts or spike rates of SU or MU in V1. In general, the performance of models based on MU activity was more similar to the performance of the monkey (Tables 2, 4, 5). These results suggest that perceptual performance in our detection task is based on signals provided by a larger and/or a more widely distributed population of neurons than the ones recorded by our MU signals.
Effect of varying integration period parameters
To test the robustness of our results, we evaluated the performance of the rate and summation models using various values for the maximal integration time and MMRT. Although there was a slight improvement in the average accuracy of the rate and summation (count) models based on SU activity when using a maximal integration time longer than 200 ms (Fig. 8A), the improvement was not significant. The rate model based on the MU activity also did not improve significantly for maximal integration times above 200 ms (Fig. 8B). In contrast, the accuracy of the summation model based on the MU activity peaked for a maximal integration time of ∼150 ms and dropped for longer or shorter values. Thresholds for the rate model based on SU and MU sites were very high for low maximal integration times and did not decrease much beyond a maximal integration time of 200 ms (Fig. 8C,D).
Figure 8.
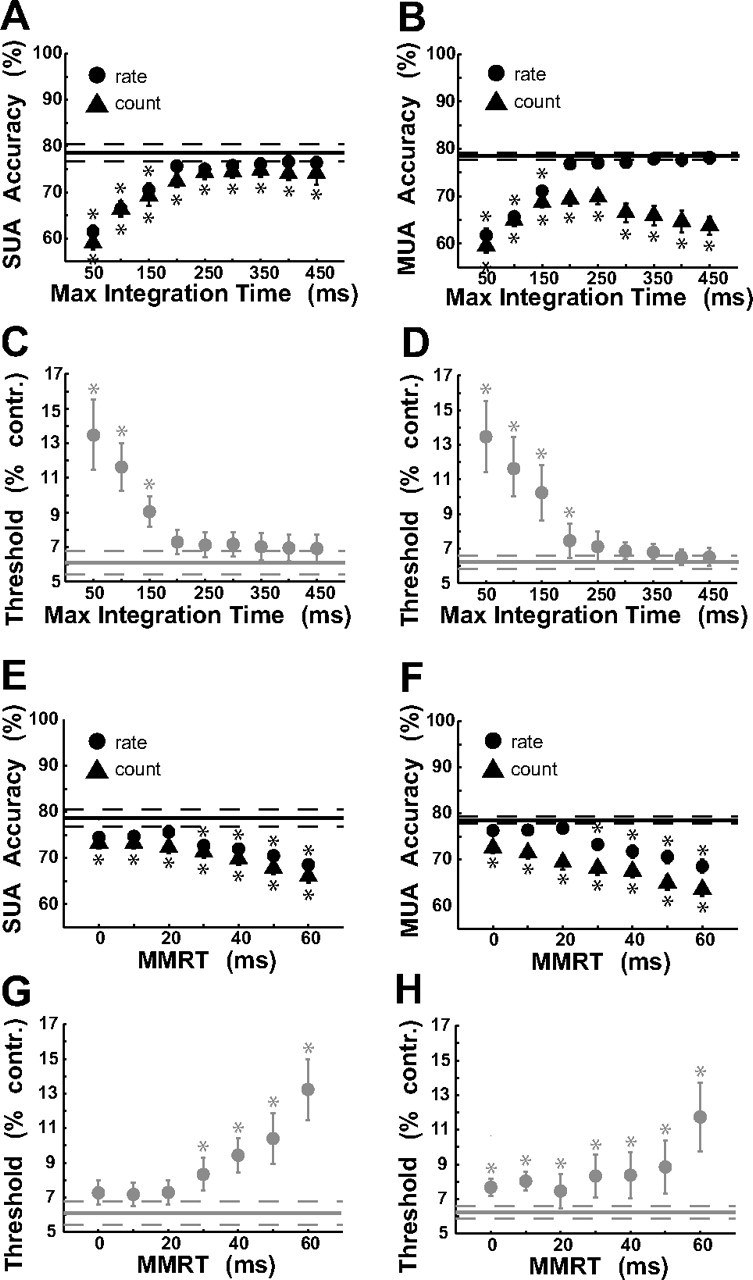
Effect of varying the integration period parameters on accuracy and threshold. A, B, Mean accuracy as a function of the maximal integration time (50 ms up to 450 ms) for SU recordings (A) and for MU recordings (B). C, D, Mean threshold as a function of the maximal integration time for SU (C) and for MU (D). E, F, Mean accuracy as a function of MMRT (0 ms up to 60 ms) for SU (E) and for MU (F). G, H, Mean threshold as a function of MMRT for SU (G) and for MU (H). In A, B, E, and F, the MMRT was fixed at 20 ms. In C, D, G, and H, the maximal integration time was fixed at 200 ms. Solid horizontal lines indicate the mean accuracy or threshold for the monkey, and the dashed lines indicate the corresponding SEM. Asterisks indicates data points where the overall accuracy (threshold) was significantly lower (higher) than the monkey based on a t test. Error bars are SEM. Max, Maximum; contr., contrast; SUA, single-unit activity; MUA, multi-unit activity.
When higher MMRT values (30–60 ms) were used, overall accuracy of both models decreased significantly (Fig. 8E,F), with the summation model performing consistently worse than the rate model, and threshold increased significantly (Fig. 8G,H). Most of this decrease in performance for longer MMRT came from the high-contrast target conditions (usually 25% target contrast), where the model in many experiments performed well below 100% and sometimes worse than at lower target contrasts. Because RTs were very short on high-contrast trials (Fig. 2), assuming a long MMRT left extremely short intervals for the evaluation of neural signals in such trials, which led to decreases in performance.
Because many of the monkey's RTs were shorter than 200 ms, it was often the case that target-absent trials had longer integration periods than target-present trials. To exclude any potential bias because of this variable integration time, we repeated our analyses using a fixed integration period of 200 ms (regardless of the monkey's saccade time). The neurometric functions remain almost identical under this analysis (supplemental Table 1, available at www.jneurosci.org as supplemental material), demonstrating that our results are not systematically biased by the variable integration duration.
The differences in the performance between the summation and the rate models were more pronounced for the MU data than for the SU data (Table 2), particularly for longer integration times (Fig. 8A,B). Because the integration durations tended to be short in target-present trials and longer in target-absent trials, the additional integration time reduced the separability between spike counts from target-present and target-absent trials but had little effect on the rate model. The MU responses were more sensitive to this reduced separability because the relative differences between the evoked response and the baseline response were much smaller for the MU responses than for the SU responses (see analysis of the quantitative relationship between SU and MU responses below).
Possible effect of eye movements
Small eye movements within the fixation window (microsaccades and drifts) could have affected our detection sensitivity measurements. Eye movements could cause the stimulus to move outside of the receptive field of the recorded neuron(s). This could lead to a decrement in the neural performance and could bias the comparison of neuronal and behavioral detection sensitivities if the monkey could effectively integrate signals from different eye positions. To rule out this possibility, for each experiment we used a simple test to capture the effect (if any) of small, fixational eye movements during the integration period. We investigated four indicators of eye movements (see Materials and Methods). For each indicator, we recalculated the overall accuracies of the monkey and the rate model for half of the trials with the best fixation and half of the trials with the worst fixation during the integration period. Both the monkey and the rate model performed slightly better on the best fixation trials across all four indicators (Table 1), but these differences were not significant. These results indicate that small eye movements during the integration period are not likely to have influenced our result.
Quantitative comparison of SU and MU responses
Our results indicate that MU in V1 have detection sensitivities that are not significantly different from single V1 neurons (Table 4). It is somewhat surprising that MU were not more sensitive than SU. The results of our simple Monte Carlo simulation (Fig. 7) demonstrate that a pool of eight or more independent and similarly tuned single neurons would be significantly more sensitive than the average MU site. Similarly, a simple calculation shows that it is enough to sum responses from two neurons that have comparable detection sensitivities and are weakly correlated to obtain a pooled performance that is more sensitive than each neuron on its own [Chen et al. (2006), their Fig. 3a]. These theoretical considerations and the results of our simulations suggest that the detection sensitivities of the MU responses should have increased as the number of neurons that contributed to the MU signal increased. In fact, we found just the opposite (Fig. 9). Sites with high baseline rates, which were likely to combine signals from many SU, tended to be less sensitive to the target than sites with lower baseline rates.
Figure 9.

Neural threshold of MU sites as a function of baseline firing rate. The solid line is a best-fit regression line, with the Pearson correlation coefficient r and its significance value p noted. contr., Contrast.
There are at least three ways in which the detection sensitivity of the MU responses could be degraded relative to the detection sensitivity predicted by our Monte Carlo simulations (Fig. 7). First, V1 neurons are selective to multiple parameters of the visual stimulus, and therefore a significant fraction of the neurons that contribute to the MU activity may carry little or no signal regarding the target [e.g., neurons for which the stimulus was in the null phase relative to the receptive field or neurons that are tuned to higher spatial frequencies (Geisler and Albrecht, 1992; DeAngelis et al., 1999)]. Such nonselective responses would add to the baseline of the MU response and to its response variability and therefore reduce its detection sensitivity. A second possibility is that the SU that contribute to the MU signal are highly correlated and that these correlations reduce the benefit that can be attained by summing the responses from multiple neighboring single neurons. Finally, it is possible that additional sources of noise that are not attributable to SU spikes contribute to the MU response and degrade its sensitivity. By evaluating the quantitative relationship between the SU and MU responses, we provide below an initial attempt to examine each of these possibilities.
To explore the possibility that nonselective SU contribute to the MU signals, we compared the average baseline and evoked MU responses with those expected by summation of SU from our data set. For each SU and MU site, we computed the average number of spikes during the 200 ms after the time of stimulus onset at each contrast level. These responses were then fitted with a Naka-Rashton contrast response function of the following form:
 |
where C is the target contrast; R(C) is the average number of spikes at contrast C; Rmin and Rmax are the baseline and maximal response, respectively; C50 is the half-saturation contrast; and n is an exponent. In general, this function provided an excellent fit to the data, accounting for >95% of the variance for 28 of the 33 SU sites and 55 of the 62 MU sites.
As expected, baseline and maximal response were much higher for MU than for SU (median Rmax: SU, 6.72; MU, 30.84; median Rmin: SU, 0.17; MU, 4.54) (Fig. 10A,B). On the other hand, contrast response functions for SU and for MU were similar in terms of their exponent and half-saturation (median n: SU, 3.81; MU, 3.08; median C50: SU, 8.45; MU, 8.38) (Fig. 10C,D).
Figure 10.

Comparison of contrast response function parameters for SU and MU. Mean response as a function of contrast was fitted for each SU and MU site using a Naka-Rashton contrast response function (see Results). A, Histogram of Rmax values. Open bars, SU; filled bars, MU. Gray arrows indicate median value for SU; black arrows indicate median value for MU. B, Histogram of Rmin values. C, Histogram of the exponent n. D, Histogram of half-saturation constant C50. B–D have the same conventions as in A.
If MU activity was the sum of the response of multiple SU that were all similarly tuned, as more SU were added to the MU pool, we would have expected both the baseline response Rmin and the selective response Rmax − Rmin to increase at a similar rate. If, on the other hand, some of the SU that contributed to the MU signal were only weakly tuned to the target, those neurons would have contributed to the baseline response but would have added little to the selective response. Under the assumption that the MU signals are the sum of the responses of multiple SU, we can estimate the expected total number of SU that contribute to each MU pool, NT, by dividing the Rmin for each MU site with the average Rmin of the SU sites. Similarly, we can estimate the equivalent number of SU that could account for the selective component of the MU response, NS, by dividing the selective response of the MU site with the average selective response of all the SU sites.
To determine the contribution of selective SU to the MU pool, we examined the relationship between NS and NT for all the MU sites. Figure 11A shows a scatter plot of NS versus NT for each of the MU sites. Surprisingly, NS is much lower than NT. In fact, NS does not exceed 9 although NT can be as high as a 100. Furthermore, although NS is quite variable, the average NS as a function of NT saturates at a value of ∼4. In other words, only 4 SU from our data set are sufficient, on average, to account for the selective response of MU sites with baseline activity that corresponds to as many as a 100 single neurons.
Figure 11.

Relationship between MU activity and SU activity. A, Scatter plot of the equivalent number of selective SU, NS, that can account for the selective MU response versus the expected total number of SU, NT, that contribute to the baseline MU response (see Results for details). Gray circles, SU; black circles, MU. The solid curve is the fit to the observed MU data with a saturating function. B, Scatter plot of NS over NT as a function of NT. The same conventions as in A are shown. The solid curve is derived from the curve in A.
To further examine the relationship between NS and NT, Figure 11B shows the ratio of NS to NT as a function of NT. As NT increased, the ratio of NS to NT dropped dramatically, reaching a mean value of 0.5 at NT of ∼5 and values well below 0.1 for NT above 40. These surprising results demonstrate that a large portion of the MU response was not selective to the target even at low baselines. As the baseline was increased, the fraction of the MU response that was selective to the target became negligible. This selective MU response could have been mediated by a small number of neurons with selectivity comparable to the average SU in our data set, or by a larger number of less selective neurons.
Figure 11 demonstrates that MU activity in our task is inconsistent with the sum of the responses of similarly tuned selective SU. These results imply that as the threshold of the window discriminator was lowered, most of the events that were detected by the window discriminator were not coming from selective neurons.
We are left with two options. Either these events came from spikes of neurons that were not tuned, or were only weakly tuned, to the target, or alternatively, these events came from sources other than SU spikes. One potential way to distinguish between these two possibilities is to examine the response variability of the SU and MU responses. The variability in the spike count of single neurons in a short interval is known to be proportional to the mean, with proportionality constant (also known as Fano factor) in the range of 1.2–1.6 (Tolhurst et al., 1983; Geisler and Albrecht, 1997). If a large portion of the MU responses was coming from sources that are not SU spikes, it seems unlikely that these sources would obey the same variance to mean ratio as the SU.
To compare the Fano factor of the SU and MU responses, for each SU and MU site we fitted a linear regression to the relationship between the variance to the mean across all contrasts and took the slope of the regression line to be the Fano factor of the SU or MU site. The histograms in the right panel of Figure 12 show the distributions of the Fano factors of the MU and the SU responses. As with SU, the variance of the MU responses was proportional to the mean over a wide range of baselines with comparable Fano factors for SU and MU sites. This result is consistent with the hypothesis that the MU responses are indeed the sum of spiking activity of many SU.
Figure 12.

Fano factors (variance-to-mean ratios) for SU and for MU sites. Left, Scatter plot of Fano factor of SU (gray circles) and MU (black circles) as a function of NT. Dashed lines indicate the expected relationship between the MU Fano factor and NT under different assumptions regarding the correlation r between the SU that contribute to the MU signals. The solid black line is the best-fit linear regression for the relationship between the MU Fano factor and NT. The slope of this curve corresponds to a weak correlation between the SU that contribute to the MU signal (see Results for more details). Right, Histogram of Fano factor for SU (open bars) and MU (filled bars). Arrows indicates the mean Fano factor for the SU sites (gray) and the MU sites (black). The average Fano factor for the MU sites was slightly higher than that for the SU sites (mean SU, 1.34; mean MU, 1.74; t test, p = 0.055).
To explore the possibility that the SU that contribute to the MU response are correlated, and that these correlations lead to further reduction in the sensitivity of the MU responses, we examined the relationship between the Fano factor and the baseline of the MU responses. If the MU responses were the sum of N independent, identical SU responses, the MU Fano factor, FN, should have been the same as the Fano factor of the SU. If, on the other hand, the MU signal was the sum of identical SU that were correlated with a correlation coefficient r, it is easy to show that the expected Fano factor for the MU responses would have been equal to the following: FN = F1 + F1(N − 1)r, where F1 is the SU Fano factor. In other words, if the neurons in the pool that contributed to the MU response were correlated, the Fano factor of the MU response should have increased linearly with N, with a slope equal to rF1.
Figure 12 shows a scatter plot of the Fano factors for the SU and MU sites as a function of NT. The average Fano factor of the SU (1.34) is comparable to values obtained in previous studies (Tolhurst et al., 1983; Geisler and Albrecht, 1997). The average Fano factor of the MU sites is somewhat higher (1.74; t test, p = 0.055 between the SU and MU). The higher average Fano factor for the MU sites was attributable to the increase in the Fano factor for higher values of NT. The best-fitting regression line for the Fano factor of the MU sites as a function of NT is indicated by the black curve. The slope of this curve corresponds to a very low correlation value of r = 0.011, suggesting that the SU signals that contributed to the MU responses were only weakly correlated.
Together, our results suggest that MU responses represent the summed activity of weakly correlated SU, most of which have low stimulus selectivity. Increasing the number of the SU that contributed to the MU pool beyond half a dozen neurons hardly increased the selective component of the MU response but increased significantly the nonselective component of the response. These nonselective signals contributed to the response variability, leading to a reduction in the detection sensitivity for large MU pools (Fig. 9).
Trial-to-trial covariation between V1 activity and behavioral choices
If V1 responses contribute to behavioral performance in the detection task, trial-to-trial variations in neural responses to identical visual stimuli should be correlated with trial-to-trial variations in the monkey's behavior. The strength of these covariations could provide useful information regarding the size of the neural population that contributes to behavior. Such covariations, often termed CP, have been observed in several brain areas (Celebrini and Newsome, 1994; Britten et al., 1996; Dodd et al., 2001; Cook and Maunsell, 2002; Uka and DeAngelis, 2004; de Lafuente and Romo, 2005; Purushothaman and Bradley, 2005; Nienborg and Cumming, 2006) but not in V1 (Nienborg and Cumming, 2006) or in primary somatosensory cortex (de Lafuente and Romo, 2005).
CP measures the probability with which an ideal observer could predict the behavioral outcome based on the neural response in single trials. In the current study, we focused on the covariations between V1 responses and the monkey's behavioral choices (the important issue of the covariations between V1 responses and the monkey's RTs will be examined elsewhere). CP values for SU and MU were very similar (Table 6). Figure 13A shows a frequency histogram of CP values across all SU sites for target-present trials (hits vs misses). Filled bars indicate sites for which the CP value is significantly different from 0.5 (based on a permutation test). Figure 13B shows CP values across all MU sites for target-present trials. The average CP values are significantly higher than 0.5 (SU average CP, 0.610; p < 0.001, t test; MU average CP, 0.624; p < 0.0001, t test), indicating that the monkeys were more likely to report seeing the target on trials in which V1 responses were relatively high. These results demonstrate for the first time that trial-to-trial variability in the response of SU and MU in V1 can be significantly correlated with the monkey's perceptual decisions.
Table 6.
CP for SU and MU
| Mean CP (SEM) | p value (t test) | Grand CP | Perm test | Number of sites | Number of trials | |
|---|---|---|---|---|---|---|
| Hits vs misses | ||||||
| SU | 0.6099 (0.031) | <0.0001 | 0.5841 | <0.001 | 25 | 427 |
| MU | 0.6236 (0.027) | <0.0001 | 0.6391 | <0.001 | 46 | 827 |
| SU and MU | 0.6186 (0.020) | <0.0001 | 0.6217 | <0.001 | 71 | 1254 |
| FA vs CR | ||||||
| SU | 0.5091 (0.210) | 0.669 | 0.4949 | 0.800 | 17 | 1180 |
| MU | 0.5212 (0.020) | 0.314 | 0.5344 | 0.510 | 32 | 2177 |
| SU and MU | 0.5170 (0.015) | 0.271 | 0.5222 | 0.528 | 49 | 3357 |
Perm, Permutation; FA, false alarms; CR, correct rejects.
Figure 13.
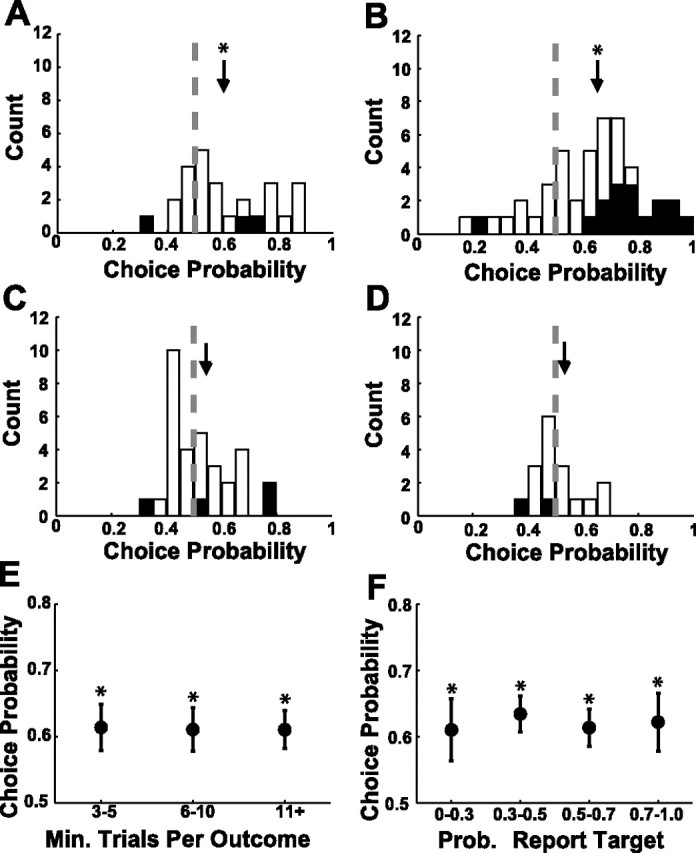
Frequency histograms of CP values of V1 neurons. A, CP of SU in target-present trials. B, CP of MU in target-present trials. C, CP of SU in target-absent trials. D, CP of MU in target-absent trials. Filled bars indicate sites with significant CP (permutation test, p < 0.05). Arrows indicate mean value. Asterisks indicate significant difference from 0.5 based on a t test. E, Mean and SEM of CP as a function of the minimum (Min.) number of trials per outcome type (hits or misses). F, Mean and SEM of CP as a function of the probability (Prob.) of reporting that the target was present. In E and F, results are combined across SU and MU sites.
To examine the relationship between CP and target contrast, we computed average CP values at 37 SU and MU sites in which CP was obtained for two contrasts. The average CP at the lower-contrast trials (CP of 0.626) was not significantly different from the average CP at the higher-contrast trials (CP of 0.596; paired t test, p = 0.47). Additionally, extreme CP values were attributable to relatively small numbers of trials at some sites. However, sites with low numbers of trials had approximately the same average CP values as sites with higher numbers of trials (Fig. 13E). Finally, CP was also stable across conditions of varying difficulty, as measured by the probability with which the monkey detected the target (Fig. 13F).
In contrast to the significant CP values we observed in target-present trials, in target-absent trials, CP values were not significantly different from 0.5 for SU (Fig. 13C) (average CP, 0.509; p = 0.669, t test) as well as for MU (Fig. 13D) (average CP, 0.521; p = 0.314, t test). This result suggests that other sources of noise downstream to V1 dominated behavioral variability in target-absent trials. This finding is consistent with the relatively short RTs observed for many false-alarm trials (Fig. 2). Such short RTs suggest that in some of our experiments the monkeys had a significant rate of fast guesses that were not based on sensory evidence (Carpenter and Williams, 1995). Fast guesses could reduce or totally mask the correlation between the V1 responses and the monkey's behavior in target-absent trials.
Additionally, we computed a grand CP value by first combining the z-scores of spike rates from all the trials within the same behavioral category across all sites and then computing a single CP value between the combined distributions. Grand CP values were close to the average CP across sites (Table 6), demonstrating the robustness of our results.
One potential caveat in CP analysis is that the observed covariation may be attributable to a common factor that separately influences neural responses and behavioral choices. If such a factor exists, it may not be appropriate to interpret significant CP as evidence that the measured neural responses directly contribute to behavior. One potential source for covariations between neural responses and behavior are small fixational eye movements.
To rule out the possible contribution of eye movements to the observed CP values, we examined the relationship between four indicators of the eye movements (see Materials and Methods) and the firing rates of the SU and MU sites. Combining data across all trials contributing to the CP analysis (by first converting firing rate values to z-scores), we did not find significant correlations between spike rates and any of the four eye movement indicators for both target-present and target-absent trials (all correlation coefficients were smaller than 0.01). Because eye movements do not account for variability in the neural response (at least based on our four measurements), they could not account for CP. We verified this by fitting a multiple linear regression to the neural responses as a function of the four eye movement parameters and recomputing the grand CP values between the residual neural responses and behavior. As expected, the new CP values were essentially identical to the original grand CP values.
To examine the possibility that the observed CPs on target-present trials were attributable to feedback related to the monkey's decision, we computed the normalized time course of the CP. Figure 14A shows the time course of the CP in target-present trials for the SU sites as well as the normalized response time courses for hits and misses. Responses on hit trials were significantly higher than responses on misses from shortly after response onset. A similar result was obtained for the MU responses (14B). These results appear inconsistent with the possibility that the observed CPs are attributable to feedback related to the monkey's decision.
Figure 14.
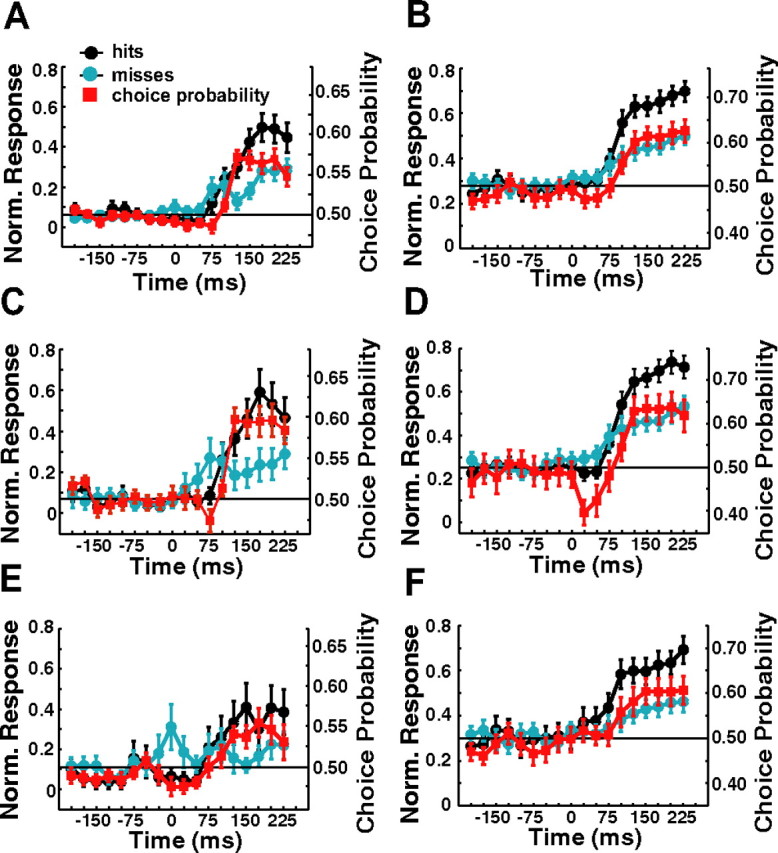
Peristimulus time histograms (PSTHs) of normalized neural responses (left y-axis) and CP time course (right y-axis) in target-present trials. Circles show mean normalized (Norm.) PSTHs of SU recordings for all of the “hit” trials (black) and for all of the “miss” trials (cyan) that are used in the CP analysis. For each stimulus condition within each experiment, the hit and miss PSTHs were first normalized to the peak of the larger of the two PSTHs. Error bars represent SEM across sites and target contrasts. Each data point represents the accumulated response from the previous 50 ms. The time course of the CP (red) shows the average and SEM of CP in 50 ms time bins across all experiments and stimulus conditions contributing to the CP analysis. A, All trials from conditions with at least three hits and three misses (n = 25). C, Trials from higher-contrast conditions with at least three hits and three misses (n = 14). E, Trials from lower-contrast conditions with at least three hits and three misses (n = 14). B, D, F, Similar to A, C, and E using MU recordings (B, n = 46; D, n = 23; F, n = 26). The three MU sites for which we obtained CP measurements for three contrast levels contributed two sets of normalized PSTHs each to F.
To determine whether the amplitude and the time course of the CP depended on target contrast, we recomputed the normalized time courses at sites in which we obtained CP values for two or more target contrast levels. Normalized response time courses were computed separately for the higher-contrast trials (Fig. 14C, SU, 14D, MU) and for the lower-contrasts trials (Figs. 14E, SU, 14F, MU). The normalized responses rose more rapidly and reached higher values at the higher contrast, but the time course of the CP and its magnitude were similar.
Finally, neurons that are more sensitive to the target could contribute more to the decision and therefore have higher CP values. However, we found no correlation between CP values and the ratio of neural to behavioral accuracy in target-present trials (r = 0.124; p = 0.301) and in target-absent trials (r = 0.086; p = 0.391), suggesting that in our data set, there is no evidence for systematic relationship between the contribution of the neurons to the decision and their detection sensitivity.
Discussion
The primary goal of this study was to compare neuronal and behavioral performances in a RT visual detection task. We found that SU and MU in V1 have detection sensitivities comparable to those of the monkey even when evaluating neural responses over brief intervals that ended shortly before the monkey's RT. However, we observed significant inconsistencies between the shapes of the neurometric and psychometric functions. We also found that MU responses are consistent with the sum of the responses of weakly correlated SU, most of which are only weakly selective to the target. Finally, we found weak but significant covariations between neural activity in V1 and behavioral performance. We conclude that, although highly sensitive, spike rates of SU and MU in V1 are insufficient to account for the monkey's behavioral performance. Instead, our results suggest that a large pool of V1 neurons is needed to account for the behavior of the monkey in this task.
Comparison of neuronal and behavioral detection sensitivities
Our finding that the detection sensitivity of single V1 neurons was comparable to that of the monkey is consistent with several previous studies (Britten et al., 1992; Celebrini and Newsome, 1994; Croner and Albright, 1999; Hernandez et al., 2000; Uka and DeAngelis, 2003; Heuer and Britten, 2004) but not with other studies in which the sensitivity of single neurons was found to be significantly lower than the sensitivity of the subject (Vogels and Orban, 1990; Prince et al., 2000; Osborne et al., 2004; Liu and Newsome, 2005; Purushothaman and Bradley, 2005) (for review, see Parker and Newsome, 1998; Romo and Salinas, 2001; Born and Bradley, 2005). Such differences across studies suggest that the relationship between neural and behavioral sensitivities depends on the exact nature of the perceptual task.
Most previous studies that compared neural and behavioral sensitivities used fixed and long integration times. This may have introduced a bias in favor of neural sensitivity because the subject may have effectively used a shorter integration period. In fact, in the only other study in which neural and behavioral sensitivities were compared while monkeys performed a RT detection task, single neurons were found to be significantly less sensitive than the monkey (Cook and Maunsell, 2002). Here, we demonstrate that V1 neurons are highly sensitive to low-contrast visual targets even when evaluated during extremely short integration times.
The behavioral thresholds measured in the current study were significantly higher than in previous detection studies in humans (Rovamo et al., 1978; Petrov and McKee, 2006) and monkeys (Merigan et al., 1991). The most likely source for these threshold differences is stimulus size; these other studies used visual targets that were much larger than the average receptive field size of V1 neurons at the eccentricities tested. Detection thresholds are known to decrease significantly as target size is increased (Robson and Graham, 1981). Other factors that could have contributed to the higher detection thresholds reported here include (1) our task included significant uncertainty regarding target contrast; (2) our task is a RT task, and stimuli were briefly presented; (3) our definition of threshold incorporates the false-alarm rate; and (4) the parameters of the Gabor patch were adjusted to match the preferred properties of the recorded neuron(s) and therefore varied significantly from day to day. Importantly, factors 1–3 also affected the performance of the models that detect the target from the neural responses, making the comparison of neuronal and behavioral sensitivities valid.
Quantitative comparison of SU and MU responses
We found that MU and SU in V1 have comparable detection sensitivities, consistent with previous findings in MT (Liu and Newsome, 2003, 2005). A simple Monte Carlo simulation revealed that MU activity is consistent with the pooled responses of weakly correlated SU, the vast majority of which are only weakly sensitive to the stimulus. This surprising result may be stimulus specific. For example, a moving stimulus or a stimulus that contains more spatial frequencies could potentially generate more selective responses from the same population of neurons. Clearly, more work is needed to determine unequivocally the nature of the MU signal and its relationship to SU responses. In addition, it remains to be seen to what extent the relationship between SU and MU activity observed here would hold for other types of stimuli and in other cortical areas.
Choice of temporal parameters
We found that neuronal sensitivity does not increase significantly when using maximal integration times beyond 200 ms (Fig. 8A), suggesting that the majority of the useful signals of the neurons occur rapidly. This result is consistent with findings from single neurons in areas V1 (Muller et al., 2001; Frazor et al., 2004) and MT (Uka and DeAngelis, 2003; Osborne et al., 2004), and from psychophysical studies in monkeys (Uka and DeAngelis, 2003) and in humans (Ludwig et al., 2005).
The monkeys' RTs in our detection task increased with decreasing target contrast but were, overall, very short (Fig. 2) and were sometimes consistent with express saccades (Fischer and Boch, 1983; Rohrer and Sparks, 1993). We believe that RTs were short because (1) the monkeys were highly trained, (2) the target was always in the same location, and (3) the monkeys were cued as to when to expect the onset of the target. Therefore, the monkeys were able to start preparing an eye movement in advance and execute it shortly after enough evidence regarding the presence of the target had been accumulated.
CP in V1
CP has been observed in multiple extrastriate areas (Celebrini and Newsome, 1994; Britten et al., 1996; Dodd et al., 2001; Shadlen and Newsome, 2001; Cook and Maunsell, 2002; Roitman and Shadlen, 2002; Uka and DeAngelis, 2004; Purushothaman and Bradley, 2005; Nienborg and Cumming, 2006). In the dorsal pathway, CP has been shown to increase along the visual hierarchy from areas MT to MST, VIP, and LIP. It is not clear, however, whether CP always increases along a visual pathway. Alternatively, CP may be maximal at the area that contains signals that are most appropriate to guide behavior, regardless of where this area is located in the visual hierarchy. Importantly, previous studies have failed to observe significant CP in the first stages of cortical sensory processing (de Lafuente and Romo, 2005; Nienborg and Cumming, 2006). Here, we show significant CP in V1, demonstrating for the first time that in some tasks, CP can be observed in the earliest stages of cortical processing. Our study may have revealed significant CPs because V1 neurons seem to be ideally suited to provide relevant information in our detection task. This result suggests that the mechanisms that link sensory representations to behavior are quite flexible and have the capacity to weight information based on its relevance to behavior, regardless of where these signals are located in the visual pathway.
Quantitative comparison of the shapes of neurometric and psychometric functions
We found that the neurometric functions are, on average, significantly shallower than the monkey's psychometric functions. There are multiple ways in which the neurometric functions could be steepened through further processing. For example, uncertainty in later stages as to which V1 neurons to read out could lead to significant steepening of the neurometric functions (Pelli, 1985). Similarly, a subsequent processing stage with a high threshold could steepen the neurometric function. Note, however, that any subsequent mechanism that leads to steepening of the neurometric functions has to do so by reducing performance at low target contrasts and is therefore suboptimal in terms of its detection performance. Consequently, to achieve overall performance comparable to that of the monkey while steepening the neurometric function, such a mechanism must operate on signals that are significantly more sensitive than the monkey to start with. Our current results suggest that such signals could be provided by large populations of V1 neurons.
In fact, taking into account the large numbers of V1 neurons that are active in response to small visual targets (Grinvald et al., 1994; Chen et al., 2006), the high detection sensitivity of single neurons reported here, and the relatively weak correlations observed between pairs of neurons in the cortex (Gawne and Richmond, 1993; Zohary et al., 1994), it is evident that V1 population responses, if pooled appropriately, should be significantly more sensitive than the monkey in the detection task. In support of this possibility, our laboratory recently reported that the activity of large populations of V1 neurons measured with VSD imaging is consistently more sensitive than the monkey in the same detection task (Chen et al., 2006). Together, our results are consistent with the hypothesis that neural responses from large populations of V1 neurons are combined suboptimally by subsequent processing stages to mediate behavioral performance in visual detection tasks. Understanding the nature of the inefficiencies that lead to the observed behavioral performance is an important goal for future experiments.
Footnotes
This work was supported by National Eye Institute Grant EY016454, National Science Foundation Grant ITR/IMG 0427372, and a Sloan Fellowship (E.S.). We thank W. Bosking, Y. Chen, S. Khurana, C. Michelson, and Z. Yang for assistance with experiments and for discussions, Y. Chen for assistance with data analysis, W. Geisler and L. Cormack for advice regarding statistical analysis and for discussions, and T. Cakic, C. Creeger, and M. Wu for technical support.
References
- Arieli A, Grinvald A, Slovin H. Dural substitute for long-term imaging of cortical activity in behaving monkeys and its clinical implications. J Neurosci Methods. 2002;114:119–133. doi: 10.1016/s0165-0270(01)00507-6. [DOI] [PubMed] [Google Scholar]
- Born RT, Bradley DC. Structure and function of visual area MT. Annu Rev Neurosci. 2005;28:157–189. doi: 10.1146/annurev.neuro.26.041002.131052. [DOI] [PubMed] [Google Scholar]
- Britten KH, Shadlen MN, Newsome WT, Movshon JA. The analysis of visual motion: a comparison of neuronal and psychophysical performance. J Neurosci. 1992;12:4745–4765. doi: 10.1523/JNEUROSCI.12-12-04745.1992. [DOI] [PMC free article] [PubMed] [Google Scholar]
- Britten KH, Newsome WT, Shadlen MN, Celebrini S, Movshon JA. A relationship between behavioral choice and the visual responses of neurons in macaque MT. Vis Neurosci. 1996;13:87–100. doi: 10.1017/s095252380000715x. [DOI] [PubMed] [Google Scholar]
- Carpenter RHS, Williams MLL. Neural computation of log likelihood in control of saccadic eye movements. Nature. 1995;377:59–62. doi: 10.1038/377059a0. [DOI] [PubMed] [Google Scholar]
- Celebrini S, Newsome WT. Neuronal and psychophysical sensitivity to motion signals in extrastriate area MST of the macaque monkey. J Neurosci. 1994;14:4109–4124. doi: 10.1523/JNEUROSCI.14-07-04109.1994. [DOI] [PMC free article] [PubMed] [Google Scholar]
- Chen Y, Geisler WS, Seidemann E. Optimal decoding of correlated neural population responses in the primate visual cortex. Nat Neurosci. 2006;9:1412–1420. doi: 10.1038/nn1792. [DOI] [PMC free article] [PubMed] [Google Scholar]
- Cook EP, Maunsell JHR. Dynamics of neuronal responses in macaque MT and VIP during motion detection. Nat Neurosci. 2002;5:985–994. doi: 10.1038/nn924. [DOI] [PubMed] [Google Scholar]
- Croner LJ, Albright TD. Segmentation by color influences responses of motion-sensitive neurons in the cortical middle temporal visual area. J Neurosci. 1999;19:3935–3951. doi: 10.1523/JNEUROSCI.19-10-03935.1999. [DOI] [PMC free article] [PubMed] [Google Scholar]
- DeAngelis GC, Ghose GM, Ohzawa I, Freeman RD. Functional micro-organization of primary visual cortex: receptive field analysis of nearby neurons. J Neurosci. 1999;19:4046–4064. doi: 10.1523/JNEUROSCI.19-10-04046.1999. [DOI] [PMC free article] [PubMed] [Google Scholar]
- de Lafuente V, Romo R. Neuronal correlates of subjective sensory experience. Nat Neurosci. 2005;8:1698–1703. doi: 10.1038/nn1587. [DOI] [PubMed] [Google Scholar]
- Dodd JV, Krug K, Cumming BG, Parker AJ. Perceptually bistable three-dimensional figures evoke high choice probabilities in cortical area MT. J Neurosci. 2001;21:4809–4821. doi: 10.1523/JNEUROSCI.21-13-04809.2001. [DOI] [PMC free article] [PubMed] [Google Scholar]
- Duda RO, Hart PE, Stork DG. Pattern classification. New York: Wiley; 2001. [Google Scholar]
- Efron B, Tibshirani RJ. An introduction to the bootstrap. London: Chapman and Hall; 1993. [Google Scholar]
- Fischer B, Boch R. Saccadic eye movements after extremely short reaction times in the monkey. Brain Res. 1983;260:21–26. doi: 10.1016/0006-8993(83)90760-6. [DOI] [PubMed] [Google Scholar]
- Frazor RA, Albrecht DG, Geisler WS, Crane AM. Visual cortex neurons of monkeys and cats: temporal dynamics of the spatial frequency response function. J Neurophysiol. 2004;91:2607–2627. doi: 10.1152/jn.00858.2003. [DOI] [PubMed] [Google Scholar]
- Gawne TJ, Richmond BJ. How independent are the messages carried by adjacent inferior temporal cortical neurons. J Neurosci. 1993;13:2758–2771. doi: 10.1523/JNEUROSCI.13-07-02758.1993. [DOI] [PMC free article] [PubMed] [Google Scholar]
- Geisler WS, Albrecht DG. Cortical neurons: isolation of contrast gain control. Vision Res. 1992;32:1409–1410. doi: 10.1016/0042-6989(92)90196-p. [DOI] [PubMed] [Google Scholar]
- Geisler WS, Albrecht DG. Visual cortex neurons in monkeys and cats: detection, discrimination, and identification. Vis Neurosci. 1997;14:897–919. doi: 10.1017/s0952523800011627. [DOI] [PubMed] [Google Scholar]
- Green DM, Swets JA. Signal detection theory and psychophysics. New York: Wiley; 1966. [Google Scholar]
- Grinvald A, Lieke EE, Frostig RD, Hildesheim R. Cortical point-spread function and long-range lateral interactions revealed by real-time optical imaging of macaque monkey primary visual cortex. J Neurosci. 1994;14:2545–2568. doi: 10.1523/JNEUROSCI.14-05-02545.1994. [DOI] [PMC free article] [PubMed] [Google Scholar]
- Hawken MJ, Parker AJ. Detection and discrimination mechanisms in the striate cortex of the Old-World monkey. In: Blakemore C, editor. Vision: coding and efficiency. Cambridge, UK: Cambridge UP; 1990. pp. 103–116. [Google Scholar]
- Hernandez A, Zainos A, Romo R. Neuronal correlates of sensory discrimination in the somatosensory cortex. Proc Natl Acad Sci USA. 2000;97:6191–6196. doi: 10.1073/pnas.120018597. [DOI] [PMC free article] [PubMed] [Google Scholar]
- Heuer HW, Britten KH. Optic flow signals in extrastriate area MST: comparison of perceptual and neuronal sensitivity. J Neurophysiol. 2004;91:1314–1326. doi: 10.1152/jn.00637.2003. [DOI] [PubMed] [Google Scholar]
- Liu J, Newsome WT. Functional organization of speed tuned neurons in visual area MT. J Neurophysiol. 2003;89:246–256. doi: 10.1152/jn.00097.2002. [DOI] [PubMed] [Google Scholar]
- Liu J, Newsome WT. Correlation between speed perception and neural activity in the middle temporal visual area. J Neurosci. 2005;25:711–722. doi: 10.1523/JNEUROSCI.4034-04.2005. [DOI] [PMC free article] [PubMed] [Google Scholar]
- Ludwig CJ, Gilchrist ID, McSorley E, Baddeley RJ. The temporal impulse response underlying saccadic decisions. J Neurosci. 2005;25:9907–9912. doi: 10.1523/JNEUROSCI.2197-05.2005. [DOI] [PMC free article] [PubMed] [Google Scholar]
- Merigan WH, Katz LM, Maunsell JHR. The effects of parvocellular lateral geniculate lesions on the acuity and contrast sensitivity of macaque monkeys. J Neurosci. 1991;11:994–1001. doi: 10.1523/JNEUROSCI.11-04-00994.1991. [DOI] [PMC free article] [PubMed] [Google Scholar]
- Muller JR, Metha AB, Krauskopf J, Lennie P. Information conveyed by onset transients in responses of striate cortical neurons. J Neurosci. 2001;21:6978–6990. doi: 10.1523/JNEUROSCI.21-17-06978.2001. [DOI] [PMC free article] [PubMed] [Google Scholar]
- Nienborg H, Cumming BG. Macaque V2 neurons, but not V1 neurons, show choice-related activity. J Neurosci. 2006;26:9567–9578. doi: 10.1523/JNEUROSCI.2256-06.2006. [DOI] [PMC free article] [PubMed] [Google Scholar]
- Osborne LC, Bialek W, Lisberger SG. Time course of information about motion direction in visual area MT of macaque monkeys. J Neurosci. 2004;24:3210–3222. doi: 10.1523/JNEUROSCI.5305-03.2004. [DOI] [PMC free article] [PubMed] [Google Scholar]
- Parker AJ, Newsome WT. Sense and the single neuron: probing the physiology of perception. Annu Rev Neurosci. 1998;21:227–277. doi: 10.1146/annurev.neuro.21.1.227. [DOI] [PubMed] [Google Scholar]
- Pelli DG. Uncertainty explains many aspects of visual contrast detection and discrimination. J Opt Soc Am. 1985;2:1508–1532. doi: 10.1364/josaa.2.001508. [DOI] [PubMed] [Google Scholar]
- Petrov Y, McKee SP. The effect of spatial configuration on surround suppression of contrast sensitivity. J Vision. 2006;6:224–238. doi: 10.1167/6.3.4. [DOI] [PMC free article] [PubMed] [Google Scholar]
- Prince SJ, Pointon AD, Cumming BG, Parker AJ. The precision of single neuron responses in cortical area V1 during stereoscopic depth judgments. J Neurosci. 2000;20:3387–3400. doi: 10.1523/JNEUROSCI.20-09-03387.2000. [DOI] [PMC free article] [PubMed] [Google Scholar]
- Purushothaman G, Bradley DC. Neural population code for fine perceptual decisions in area MT. Nat Neurosci. 2005;8:99–106. doi: 10.1038/nn1373. [DOI] [PubMed] [Google Scholar]
- Quick RF., Jr A vector-magnitude model of contrast detection. Kybernetik. 1974;16:65–67. doi: 10.1007/BF00271628. [DOI] [PubMed] [Google Scholar]
- Robson JG, Graham N. Probability summation and regional variation in contrast sensitivity across the visual field. Vision Res. 1981;21:409–418. doi: 10.1016/0042-6989(81)90169-3. [DOI] [PubMed] [Google Scholar]
- Rohrer WH, Sparks DL. Express saccades: the effects of spatial and temporal uncertainty. Vision Res. 1993;33:2447–2460. doi: 10.1016/0042-6989(93)90125-g. [DOI] [PubMed] [Google Scholar]
- Roitman JD, Shadlen MN. Response of neurons in the lateral intraparietal area during a combined visual discrimination reaction time task. J Neurosci. 2002;22:9475–9489. doi: 10.1523/JNEUROSCI.22-21-09475.2002. [DOI] [PMC free article] [PubMed] [Google Scholar]
- Romo R, Salinas E. Touch and go: decision-making mechanisms in somatosensation. Annu Rev Neurosci. 2001;24:107–137. doi: 10.1146/annurev.neuro.24.1.107. [DOI] [PubMed] [Google Scholar]
- Rovamo J, Virsu V, Nasanen R. Cortical magnification factor predicts photopic contrast sensitivity of peripheral vision. Nature. 1978;271:54–56. doi: 10.1038/271054a0. [DOI] [PubMed] [Google Scholar]
- Shadlen MN, Newsome WT. Neural basis of a perceptual decision in the parietal cortex (area LIP) of the rhesus monkey. J Neurophysiol. 2001;86:1916–1936. doi: 10.1152/jn.2001.86.4.1916. [DOI] [PubMed] [Google Scholar]
- Shadlen MN, Britten KH, Newsome WT, Movshon JA. A computational analysis of the relationship between neuronal and behavioral responses to visual motion. J Neurosci. 1996;16:1486–1510. doi: 10.1523/JNEUROSCI.16-04-01486.1996. [DOI] [PMC free article] [PubMed] [Google Scholar]
- Tolhurst DJ, Movshon JA, Dean AF. The statistical reliability of signals in single neurons in cat and monkey visual cortex. Vision Res. 1983;23:775–785. doi: 10.1016/0042-6989(83)90200-6. [DOI] [PubMed] [Google Scholar]
- Uka T, DeAngelis GC. Contribution of middle temporal area to coarse depth discrimination: comparison of neuronal and psychophysical sensitivity. J Neurosci. 2003;23:3515–3530. doi: 10.1523/JNEUROSCI.23-08-03515.2003. [DOI] [PMC free article] [PubMed] [Google Scholar]
- Uka T, DeAngelis GC. Contribution of area MT to stereoscopic depth perception: choice-related response modulations reflect task strategy. Neuron. 2004;42:297–310. doi: 10.1016/s0896-6273(04)00186-2. [DOI] [PubMed] [Google Scholar]
- Vogels R, Orban GA. How well do response changes of striate neurons signal differences in orientation: a study in the discriminating monkey. J Neurosci. 1990;10:3543–3558. doi: 10.1523/JNEUROSCI.10-11-03543.1990. [DOI] [PMC free article] [PubMed] [Google Scholar]
- Zohary E, Shadlen MN, Newsome WT. Correlated neuronal discharge rate and its implications for psychophysical performance. Nature. 1994;370:140–143. doi: 10.1038/370140a0. [DOI] [PubMed] [Google Scholar]