

Abstract
We evaluated in vivo interactions between extrinsic (growth factor induced) and intrinsic (genetically determined) effectors of mouse primitive hemopoietic stem cell proliferation and numbers. Accordingly, stem cell frequency and cell cycle kinetics were assessed in eight strains of inbred mice using the cobblestone area–forming cell (CAFC) assay. A strong inverse correlation was observed between mouse lifespan and the number of autonomously cycling progenitors (CAFC day 7) in the femur. The population size of primitive stem cells (CAFC day 35) varied widely (up to sevenfold) among strains, unlike total CAFC day 7 numbers (cycling and quiescent), which were similar. Administration of the early acting cytokine flt-3 ligand to these strains resulted in activation of quiescent primitive stem cells exclusively in strains with high endogenous stem cell numbers (DBA and AKR), but was unrelated to strain-specific progenitor cell cycling. To map loci affecting stem cell frequency, we quantified stem cells in BXD recombinant inbred mice (offspring of C57BL/6 and DBA/2). The resulting strain distribution pattern showed high concordance with a marker that mapped to chromosome 18 (19 cM). Linkage with this genomic interval was associated with a likelihood of odds score of 3.3, surpassing the level required for significance. Interestingly, this segment, containing the EGR-1 gene, shows synteny with human chromosome 5q, a region strongly associated with various hematological malignancies. Our findings indicate that a gene mapping to this region is mutated in either C57BL/6 or DBA/2 (and possibly AKR) mice. These studies in apparently healthy mice may facilitate the identification of a gene implicated in human 5q-syndromes.
Maintenance of stable levels of mature cells in the peripheral blood is regulated by an array of hemopoietic cytokines. In contrast, it is not clear how the number of primitive stem cells, from which these mature cells descend, is regulated in the bone marrow. Several observations in mice suggest that there may be fundamental differences between the mechanisms that control the frequency of these primitive cells and those which regulate mature blood cell numbers. For example, after chemotherapy or irradiation, blood cell counts may recover to normal values, but stem cell numbers remain severely reduced for the entire lifespan of the animal (1). Conversely, the stem cell pool in unmanipulated mice continuously expands during its lifetime, such that old mice have substantially more stem cells than young mice, although aging has no effect on circulating blood cell counts (2, 3). Finally, it has been shown by us and others that various inbred strains of mice show a remarkable variation in the numbers and cell cycle kinetics of stem cells, without detectable differences in peripheral blood cell numbers (2, 4–7). Thus, it seems unlikely that steady state stem cell frequency is determined by mature blood cell numbers through a direct feedback mechanism. Rather, stem cell pool size appears to be governed to a large extent by cell-intrinsic, genetically determined regulatory mechanisms.
However, recent findings suggest that extrinsic, growth factor–controlled effects may also affect stem cell kinetics. In particular, it has been proposed that serum levels of flk-2/flt-3 ligand (FL)1 may be involved in maintaining stem cell frequency within its normal range, the breadth of which may be genetically determined. A wealth of in vitro data has shown that FL has potent effects on primitive stem cell proliferation (8–11), and in vivo flk-2/flt-3 knockout mice show stem cell defects, especially affecting lymphopoiesis (12). Importantly, several clinical studies now have demonstrated that FL serum concentrations inversely correlate with hematopoietic stem/progenitor cell frequency, whereas no such associations are apparent between FL levels and peripheral blood cell numbers (13, 14). These studies suggest that FL may be the first identified humoral regulator of stem cell frequency, although as yet no study has assessed the direct in vivo effects of FL administration on primitive stem cell proliferation.
We evaluated the in vivo interaction between growth factor–induced and genetically determined effects on primitive hemopoietic stem cell proliferation and population size. To this end stem cell frequency and cycling were quantified in various strains of unperturbed and FL-treated mice which had widely disparate lifespans. A relationship was observed among (a) strain-specific mouse lifespan, (b) progenitor cell proliferation, and (c) size of the stem cell compartment. Extrinsic stimulation of stem cell cycling by FL was observed only in strains with large endogenous stem cell pools but was absent in strains with inherently low stem cell numbers. To map genetic loci affecting this trait, we quantified stem cells in BXD recombinant inbred mice, and identified a single locus which mapped to chromosome 18. Interestingly, this region shows synteny with human chromosome 5q21-35, deletions of which are strongly associated with various hematologic malignancies.
Materials and Methods
Animals.
Female mice were purchased from The Jackson Laboratory (Bar Harbor, ME) at 6–8 wk of age and were housed under specific pathogen-free conditions in microisolator cages. Marrow cells from 3 to 5 mice were pooled and used in each cobblestone area–forming cell (CAFC) assay. The strains used were (mean mouse lifespan is indicated in parentheses for each strain): 129/SvJ (621 d), A/J (481 d), AKR/J (256 d), BALBc/J (532 d), C3H/HeJ (400 d), C57BL/6J (653 d), CBA/J (398 d), DBA/2J (410 d), and the 26 BXD/Ty recombinant inbred strains.
FL Administration.
Human FLAG-FL was supplied by Immunex Corp. (Seattle, WA). FL was diluted in saline shortly before each injection and mice were injected subcutaneously with 2.0 μg FL/100 μl at 11:00 AM, 11:00 PM, and 9:00 AM. 2 h after the last injection mice were killed and marrow cells were harvested by repeated flushing of the femora.
CAFC Assay.
The CAFC assay was performed exactly as described (2). In short, bone marrow cells were plated in six limiting dilutions, each dilution threefold apart (8.1 × 10⁴–0.33 × 10³ cells/well) on a preestablished adherent layer of the stromal cell line FBMD-1 in 96-well plates. Each dilution was plated in 40 replicate wells. At weekly intervals, individual wells were evaluated for the presence of a cobblestone area. Only wells containing clusters of ⩾5 cells growing beneath the stroma were scored as positive. The percentage of CAFC in S-phase was determined using an in vitro hydroxyurea (HU) suicide technique as previously described (2). Before the initiation of the CAFC assay, cells were incubated for 1 h with or without HU (107 cells in 1 ml, containing 200 μg/ml HU (Sigma Chemical Co., St. Louis, MO). Cells were then washed, recounted, and used in the assay.
Quantitative Trait Loci (QTL) Analysis.
The CAFC day 35 frequency per 105 marrow cells was quantified for each BXD strain (3 mice/group). To confirm the reproducibility of these data, selected strains were reanalyzed and second measurements were shown to be within 10% of the first. These values were then used in the software program MapManager QT (b10.1) (K.F. Manley, Buffalo, NY; reference 15) to conduct a genome-wide search for linked loci. To establish statistical criteria for linkage (16) a permutation test was performed (1,000 permutations at 1-cM intervals) (17).
Results and Discussion
Mouse Lifespan Is Inversely Correlated with Stem Cell Cycling.
We have recently used the in vitro CAFC assay (Fig. 1) in combination with an HU suicide technique to evaluate the number of stem cells in active cell cycle (2). CAFC day 7, a population of cells which has been shown to consist primarily of multipotent progenitors (18–20), showed a substantial HU kill, whereas primitive CAFC day 35, which contain cells with long-term repopulating ability (18, 20), were not killed by a 1-h incubation with HU, demonstrating their proliferative quiescence (2, 20). The eight strains of mice which were used in this study were first evaluated for the pool size of cycling CAFC day 7 per femur during steady state hemopoiesis (Fig. 2). For five of these strains (CBA, C3H/He, DBA/2, BALB/c, and C57BL/6) we have previously shown that the percentage of progenitor cells in the S-phase of the cell cycle is inversely related to maximal mouse lifespan (2). The inclusion of three new strains (AKR, A, and 129/Sv) in this study confirmed and extended our initial observation. AKR mice have the shortest lifespan of all inbred mouse strains, and invariably develop leukemia before they have reached 1 yr of age (21). Our data show that AKR mice have one of the largest cycling CAFC day 7 pools of all strains tested, ∼8,000 CAFC day 7 per femur. In contrast, 129/Sv mice have a long lifespan, approximately as long as that of C57BL/6 mice, and we were unable to detect any S-phase CAFC day 7 in this strain. Strain A mice have a lifespan which is intermediate between those of 129/Sv and AKR mice, and correspondingly the pool of cycling progenitors per femur in these mice was ∼4,000, in between the values obtained for 129/Sv and AKR mice. Although these data do not imply any causative relationship between lifespan and hemopoietic progenitor cell cycling, we hypothesize that other continuously renewing tissues may show a similar strain distribution pattern (SDP). If that is the case, it is appealing to argue that lifespan is influenced by systemic cell proliferation, which would affect cumulative DNA damage potentially caused by errors during DNA duplication, reactive oxygen radicals, telomere erosion, etc. It is noteworthy that caloric restriction, which has long been known to increase lifespan, is accompanied by a reduced mitotic index of multiple cell systems (22).
Figure 1.

The hemopoietic stem cell hierarchy as defined by the in vitro CAFC assay and its relationship with other stem/progenitor cell assays. Stem cells of a particular developmental stage form a cobblestone-like colony beneath a stromal cell layer after a defined period of time. Colonies that appear early (7 d) after initiation of the culture are generated by relatively mature progenitor cells, such as CFU-spleen (CFU-S) days 8 and 9, CFU–granulocyte/erythroid/megakaryocyte/macrophage (CFU-GEMM), CFU–granulocyte/macrophage (CFU-GM), or burst forming units–erythroid (BFU-E). Colonies which appear after ∼14 d in culture are descending from CFU-S days 12–14 or high proliferative potential–colony forming cells (HPP-CFC). In contrast, colonies which appear only after 5 wk in culture are correlated with very primitive, long-term repopulating ability (LTRA) or long-term culture initiating (LTC-IC) stem cells (18, 19). The frequency of stem cell subsets detected in vitro decreases exponentially with culturing time, reflecting the hierarchical structure of the stem cell compartment.
Figure 2.

Individual mouse lifespan is negative correlated with the number of cycling CAFC day 7 per femur. The fraction of cells in S-phase was determined by using an in vitro HU suicide technique. The linear regression equation was: CAFC day 7 cycling = 13159 − 18.47 × lifespan, r 2 = 0.66, P <0.0145.
Differential Regulation of Endogenous Pool Size of Stem Cell Subset Compartments.
In all eight strains of mice the absolute number of the various CAFC subsets was determined weekly for five consecutive weeks (Fig. 3). When the frequency of progenitors (CAFC day 7) was assessed, no significant differences could be detected between strains, a result identical to that obtained when blood cell counts or cells forming colonies in semisolid medium (23) were compared among the strains. All strains had ∼2 × 10⁴ CAFC day 7/femur. However, significant differences were observed when more primitive subsets were evaluated. Starting at day 14, the variation in cell frequency between strains increased steadily, indicating a distinct, genetically determined, control mechanism for primitive stem cells. At days 28 and 35, two strains (AKR and DBA/2), had significantly more stem cells than other strains; conversely, three strains (CBA, BALB/c, and C3H/He), had far fewer stem cells. CBA, the strain with the smallest stem cell pool, had fourfold fewer CAFC day 35 than C57BL/6, and eightfold fewer than AKR. These data suggest that the progenitor population is most likely linked to peripheral blood cell counts, which are equal in all strains, but that another mechanism(s) controls more primitive stem cells.
Figure 3.

Different strains of mice have largely varying primitive stem cell numbers. CAFC subsets were quantified in eight inbred strains of mice for five consecutive weeks. Each point represents data obtained from 6 to 15 mice in a minimum of two independent experiments. CAFC frequency is shown on a logarithmic scale.
Characterization of the Intrinsic Organization of the Stem Cell Compartment Reveals Three Distinct Categories.
When the relationship between the S-phase fraction of CAFC day 7, the numbers of the most primitive stem cells per femur (CAFC day 35), and the mean lifespan of mouse strains was plotted, a revealing pattern was obtained (Fig. 4). The eight strains of mice could be categorized into three distinct classes, hereafter named groups 1, 2, and 3. Group 1 consisted of CBA, C3H/He, and BALB/c, mice which had low numbers of CAFC day 35 per femur (<150) but concomittantly a high number of proliferating CAFC day 7 per femur (>5,000 for CBA and C3H/He, somewhat lower for BALB/c). At the other end of the spectrum, AKR and DBA/2, and to a lesser extent A mice (group 3), had a similarly high number of proliferating CAFC day 7 (>5,000), but these strains had a CAFC day 35 compartment which was far larger (450–550/femur) than the first group. Two other strains, C57BL/6 and 129/Sv (group 2), had CAFC day 35 frequencies which were intermediate (∼300/femur), but this was accompanied by a CAFC day 7 pool which was largely quiescent (<1,000 proliferating cells/femur).
Figure 4.

Inbred strains of mice can be divided into three groups with respect to the organization of their stem cell compartment: group 1: CBA, C3H, and BALB/c (high cycling, few stem cells, short lifespan); group 2: C57BL/6 and 192/Sv (low cycling, intermediate stem cells, long lifespan); and group 3: DBA and AKR (high cycling, many stem cells, short lifespan). Left y-axis shows mean lifespan for each strain (•), right y-axis shows mean number of cycling CAFC day 7 per femur (★).
Short-lived strains could thus be divided into two distinct groups, based upon the frequency of the CAFC day 35; although CBA and C3H/He mice have roughly an equally short life span as DBA/2 mice, the latter had five- to sevenfold more stem cells. Long-lived strains (C57BL/6 and 129/Sv) had an intermediate stem cell frequency.
Extrinsic Stimulation of Stem Cell Proliferation by FL Is Fully Determined by Genetic Background.
To assess whether the intrinsically controlled differential composition of the hemopoietic stem cell population in the various strains of mice would affect the responsiveness of progenitors and stem cells to extrinsic stimuli, representative strains of each of the three categories were treated with FL in vivo. Fig. 5, a and b, summarizes the effects of FL treatment on the percentage of CAFC day 7 and CAFC day 35 in S-phase, respectively. FL had a potent stimulating effect on progenitor cycling in C57BL/6 and 129/Sv, the two long-lived strains which showed scarcely any endogenous proliferation (Fig. 5 a). In DBA/2 mice a marked FL effect could also be demonstrated, but the relative increase of the percentage of CAFC day 7 in S-phase due to FL treatment was less impressive than in the previous two strains. Finally, no stimulating effect could be demonstrated in AKR and C3H/He, two strains that already showed a high, possibly maximal, autonomous cycling activity for this progenitor subset. When the effect on CAFC day 35 cycling was assessed, striking strain-specific results were obtained (Fig. 5 b). As expected from previous work, these cells were normally completely quiescent (2). The only exception was noted in AKR mice, in which ∼5% of these very primitive stem cells proliferated autonomously. Interestingly, AKR mice invariably develop leukemia (21) and our data therefore suggest that even apparently healthy AKR mice may in fact be preleukemic. Only in AKR and DBA/2 mice did FL result in a substantial percentage (15–20%) of CAFC day 35 entering S-phase. Cells of C57BL/6 and 129/Sv did not respond to FL, although CAFC day 7 of these strains were highly responsive. Thus, FL activation of primitive stem cells was confined to strains which have a large endogenous stem cell population (Fig. 4) and occurred irrespective of CAFC day 7 cell cycle kinetics, an outcome with possible clinical ramifications for the use of this cytokine in cancer treatment and stem cell transplantation protocols. Moreover, our findings have relevance for experimental gene therapy protocols, in which the quiescent nature of long-term repopulating stem cells is considered a serious obstacle for efficient gene transfer. We show that FL may be a promising adjuvant in these protocols, but clearly its effectiveness will vary from donor to donor.
Figure 5.

Strain-specific responses to in vivo administration of FL. The number of cycling CAFC day 7 (a) and CAFC day 35 (b) was determined using an in vitro HU suicide technique. Dark bars represent the number of CAFC in S-phase in untreated control animals, while lighter bars show the cycling activity in FL-treated mice. Note that no detectable CAFC day 35 cycling could be demonstrated in any strain before FL administration, except AKR. Groups indicated refer to categories as shown in Fig. 4.
Mapping of a Locus Which Regulates the Population Size of Primitive Stem Cell Compartments.
To identify loci affecting the size of the endogenous stem cell pool, we made use of BXD recombinant inbred (RI) strains of mice derived from C57BL/6 (a group 2 strain, Fig. 4) and DBA/2 (a group 3 strain) parental founders. The genome of RI BXD mice consists of a mosaic of homozygous C57BL/6 and DBA/2 chromosomal segments. Typing these mice for a particular phenotype and comparing the obtained SDP with polymorphic markers previously mapped by others in the BXD strains may result in a map position for the trait of interest. In the field of hematology this type of approach has been, for example, successfully employed to characterize the gene involved in IL-3 nonresponsiveness of A/J mice (24). To this end, we quantified CAFC day 35 frequency in all 26 RI strains. DBA parental mice had approximately threefold higher CAFC day 35 frequencies than C57BL/6 mice, but nearly all of the RI strains had CAFC day 35 frequencies which were between C57BL/6 and DBA/2 values (Fig. 6 a). Two notable exceptions were RI strain number 11, which had an unusually high stem cell number, and RI strain 29, which had a very small stem cell compartment. Our data differ quantitatively and qualitatively from those reported recently by Muller-Sieburg et al. (7). We believe that this results from our use of more stringent criteria in the CAFC assay. As has been pointed out by Ploemacher et al. (25), the CAFC assay will only result in reproducible and accurate stem cell measurements if (phase contrast–negative) colonies growing beneath stromal cells are counted. Phase contrast–positive cells accumulating on top of the stroma reflect the mature progeny of primitive cells, and their presence does not indicate a proper cobblestone area. In addition, it is likely, given the different cell cycle status of C57BL/6 and DBA/2 cells, that the half-life of such phase contrast–positive cells differs markedly from (BXD-) strain to strain, further confounding an accurate stem cell analysis. It should be noted that we used the same stromal cell line as was tested by Muller-Sieburg, and that the frequency of C57BL/6 stem cells was very comparable in both studies.
Figure 6.
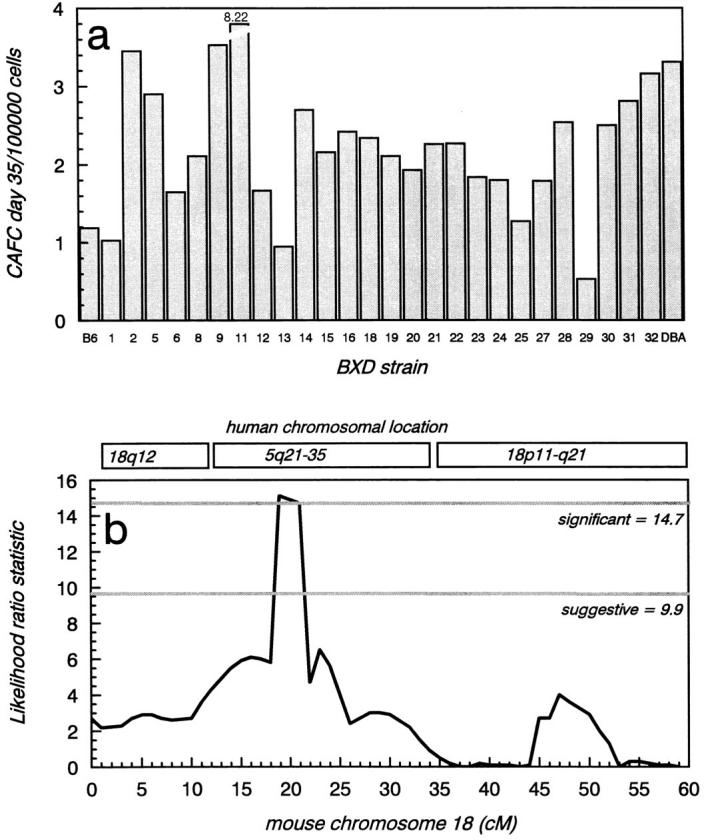
Analysis of stem cell frequency in RI strains. (a) Strain distribution pattern of the CAFC day 35 frequency in all BXD strains. Parental values are indicated with the leftmost (C57BL/6) and rightmost (DBA) bars. Each value is based on the analysis of pooled marrow cells obtained from three BXD mice. (b) Likelihood ratio statistic plot showing the results of the interval mapping on chromosome 18. The threshold LRS values for suggestive and significant linkage were 9.9 and 14.7, respectively, and are indicated. A sharp peak was observed around D18NcvS22, located ∼19 cM from the centromere. The corresponding map position of orthologous genes in human is shown at the top of the figure. The region around D18NcvS22 (11–34 cM) shows synteny with human chromosome 5q21-35.
The SDP obtained after BXD analysis was subsequently used to search for QTLs using MapManager QT (b10.1) software (15). Statistical criteria for linkage (16) were established by performing a permutation test (1,000 permutations at 1-cM intervals) (17). Two putative intervals which could harbor QTLs were detected in a genome-wide search, D18NcvS22 (chromosome 18, at ∼19 cM), and Cyp2d9 (chromosome 15, at ∼43 cM). The latter had a likelihood ratio statistic (LRS) value of 7.9 (likelihood of odds <2.0), falling short of even the suggestive linkage threshold. The D18NcvS22 interval was associated with an LRS of 15.1 (likelihood of odds = 3.3), a value surpassing the significance level (i.e., genome-wide probability of a type 1 error <0.05). Importantly, neither FL (which maps on chromosome 7) nor its receptor flt3 (which maps on chromosome 5) can be involved in this trait. Subsequent interval mapping on chromosome 18 resulted in the LRS plot shown in Fig. 6 b. Interestingly, the region of mouse chromosome 18 to which the trait maps shows synteny with human chromosome 5q (Fig. 7). Deletions in this region are strongly associated with various hematologic malignancies, most notably a subset of myelodysplastic syndromes and acute myeloid leukemias (26). Previous studies in patients have revealed distinct critical regions which may contain tumor suppressor genes implicated in 5q-syndromes (Fig. 7). Since genes located on human 5q21-35 are dispersed over mouse chromosomes 11, 13, and 18, our mouse data underscore the possible presence of a critical region involved in human 5q-malignancies around EGR-1. IRF-1, shown by Willman et al. (27) to be deleted in some 5q-samples, maps to mouse chromosome 11. The critical region identified by Boultwood et al., (26, 28) is partly syntenic with a segment on mouse chromosome 18, but appears to be too telomeric to be considered as a candidate region for the present QTL. Fairman et al. (29) have identified a region between EGR-1 and IL-9. IL-9 maps to mouse chromosome 13, and thus cannot be a candidate gene here. In contrast, the region around and telomeric to EGR-1 is very likely to contain the gene which regulates mouse CAFC day 35 frequency. This region was implicated by Le Beau et al. (30) to be of critical importance in the ontogeny of 5q-malignancies in humans. Our findings suggest that the murine homolog of one of these genes is mutated in either C57BL/6 or DBA/2 (and possibly AKR, another group 3 mouse).
Figure 7.
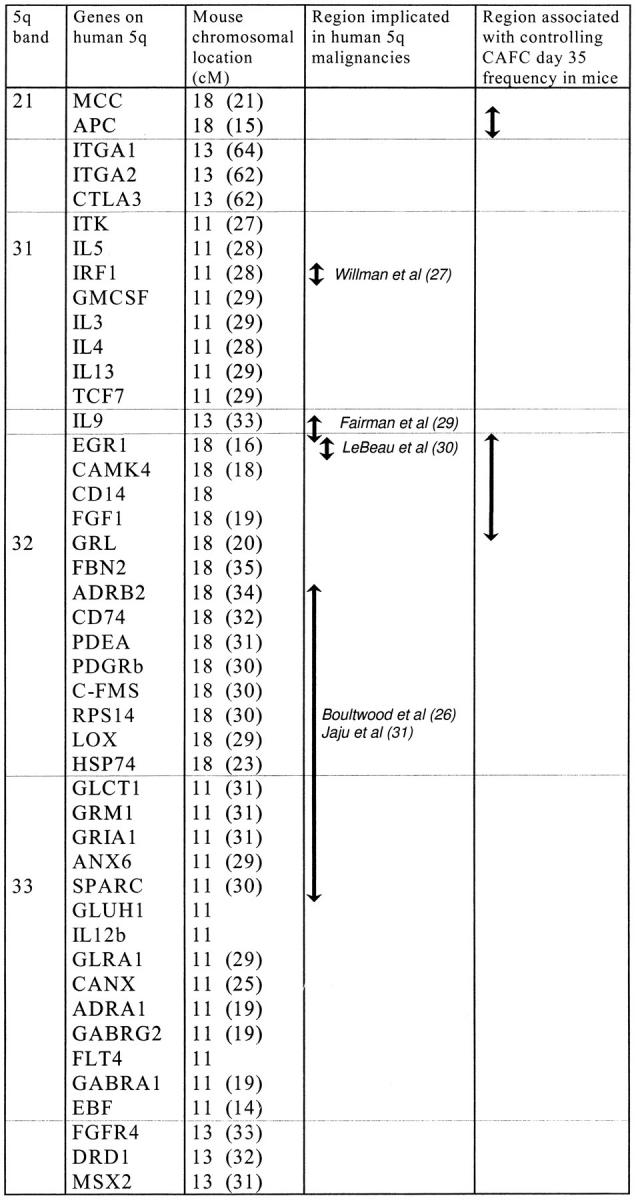
Genes assigned to human chromosome 5q21-35, and their map position in mouse. The order of genes was based on various sources (26, 30, 32). The regions which have been implicated in human 5q associated malignancies are indicated, with references. The region which contains the QTL mapped in this study is shown in the last column.
In conclusion, our data demonstrate that hemopoietic stem cell numbers are under strict genetic control and are independent of circulating blood cell counts. Extrinsic stimulation of stem cells with cytokines, a goal of many clinical endeavors, may be effective but is highly dependent on these intrinsic determinants. This was recently reiterated in a study in which the G-CSF–stimulated mobilization potential of various inbred strains of mice was determined (23). DBA/2 mice mobilized ∼10-fold better than C57BL/6 mice and our data would suggest that this difference is a reflection of the total stem cell pool in the femur, which is much larger in DBA/2 mice. A prediction would be that AKR mice are also efficiently mobilized. Here we report the chromosomal location of one of the genes contributing to these differences, which should facilitate the identification of an important stem cell regulatory mechanism, both in mice and humans.
Acknowledgments
The authors thank Dr. Rob Williams for invaluable assistance with MapManager, Melissa Flett for statistical analysis, and Dr. Stephen Szilvassy for critical reading of the manuscript.
This work was supported in part by the Department of Internal Medicine, University of Kentucky Hospital and the Lucille P. Markey Cancer Center. G. de Haan is a recipient of a “TALENT”-stipend, awarded by the Netherlands Organization for Scientific Research (NWO).
Footnotes
Abbreviations used in this paper: CAFC, cobblestone area–forming cell; FL, flt-3 ligand; HU, hydroxyurea; LRS, likelihood ratio statistic; QTL, quantitative trait loci; RI, recombinant inbred; SDP, strain distribution pattern.
References
- 1.Morley A, Blake J. An animal model of chronic aplastic marrow failure. I. Late marrow failure after busulfan. Blood. 1979;44:49–56. [PubMed] [Google Scholar]
- 2.de Haan G, Nijhof W, Van Zant G. Mouse strain-dependent changes in frequency and proliferation of hematopoietic stem cells during aging: correlation between lifespan and cycling activity. Blood. 1997;89:1543–1550. [PubMed] [Google Scholar]
- 3.Morrison SJ, Wandycz AM, Akashi K, Globerson A, Weissman IL. The aging of hematopoietic stem cells. Nat Med. 1996;2:1011–1016. doi: 10.1038/nm0996-1011. [DOI] [PubMed] [Google Scholar]
- 4.Van Zant G, Eldridge PW, Behringer RR, Dewey MJ. Genetic control of hematopoietic kinetics revealed by analyses of allophenic mice and stem cell suicide. Cell. 1983;35:639–645. doi: 10.1016/0092-8674(83)90096-x. [DOI] [PubMed] [Google Scholar]
- 5.Van Zant G, Holland BP, Eldridge PW, Chen JJ. Genotype-restricted growth and aging patterns in hematopoietic stem cell populations of allophenic mice. J Exp Med. 1990;171:1547–1565. doi: 10.1084/jem.171.5.1547. [DOI] [PMC free article] [PubMed] [Google Scholar]
- 6.Phillips RL, Reinhart AJ, Van Zant G. Genetic control of murine hematopoietic stem cell pool sizes and cycling kinetics. Proc Natl Acad Sci USA. 1992;89:11607–11611. doi: 10.1073/pnas.89.23.11607. [DOI] [PMC free article] [PubMed] [Google Scholar]
- 7.Muller-Sieburg CE, Riblet R. Genetic control of the frequency of hematopoietic stem cells in mice: mapping of a candidate locus to chromosome 1. J Exp Med. 1996;183:1141–1150. doi: 10.1084/jem.183.3.1141. [DOI] [PMC free article] [PubMed] [Google Scholar]
- 8.Hirayama F, Lyman SD, Clark SC, Ogawa M. The flt3 ligand supports proliferation of lymphohematopoietic progenitors and early B-lymphoid progenitors. Blood. 1995;85:1762–1768. [PubMed] [Google Scholar]
- 9.Jacobsen SEW, Okkenhaug C, Myklebust J, Veiby OP, Lyman SD. The FLT3 ligand potently and directly stimulates the growth and expansion of primitive murine bone marrow progenitor cells in vitro: synergistic interactions with interleukin (IL) 11, IL-12, and other hematopoietic growth factors. J Exp Med. 1995;181:1357–1363. doi: 10.1084/jem.181.4.1357. [DOI] [PMC free article] [PubMed] [Google Scholar]
- 10.Gabbianelli M, Pelosi E, Montesoro E, Valtieri M, Luchetti L, Samoggia P, Vitelli L, Barberi T, Testa U, Lyman S, Peschle C. Multi-level effects of flt3 ligand on human hematopoiesis: expansion of putative stem cells and proliferation of granulomonocytic progenitors monocytic precursors. Blood. 1995;86:1661–1670. [PubMed] [Google Scholar]
- 11.Shah AJ, Smogorzewska EM, Hannum C, Crooks GM. Flt3 ligand induces proliferation of quiescent human bone marrow CD34+CD38− cells and maintains progenitor cells in vitro. Blood. 1996;87:3563–3570. [PubMed] [Google Scholar]
- 12.Mackarehtschian K, Hardin JD, Moore KA, Boast S, Goff SP, Lemischka IR. Targeted disruption of the flk2/flt3 gene leads to deficiencies in primitive hematopoietic progenitors. Immunity. 1995;3:147–161. doi: 10.1016/1074-7613(95)90167-1. [DOI] [PubMed] [Google Scholar]
- 13.Lyman SD, Seaberg M, Hanna R, Zappone J, Brasel K, Abkowski JL, Prchal JT, Schultz JC, Shahidi NT. Plasma/serum levels of flt3 ligand are low in normal individuals and highly elevated in patients with Fanconi anemia and acquired aplastic anemia. Blood. 1995;86:4091–4096. [PubMed] [Google Scholar]
- 14.Wodnar-Filipowicz A, Lyman SD, Gratwohl A, Tichelli A, Speck B, Nissen C. Flt3 ligand level reflects hematopoietic progenitor cell function in aplastic anemia and chemotherapy-induced bone marrow aplasia. Blood. 1996;88:4493–4499. [PubMed] [Google Scholar]
- 15.Manley, K.F. 1993. A Macintosh program for storage and analysis of experimental mapping data. Mamm. Genome. 4:303– 313. Available at http://mcbio.med.buffalo.edu/mapmgr.htlm [DOI] [PubMed]
- 16.Lander ES, Kruglyak L. Genetic dissection of complex traits: guidelines for interpreting and reporting linkage results. Nat Genet. 1995;11:241–247. doi: 10.1038/ng1195-241. [DOI] [PubMed] [Google Scholar]
- 17.Churchill GA, Doerge RW. Empirical threshold values for quantitative trait mapping. Genetics. 1994;138:963–971. doi: 10.1093/genetics/138.3.963. [DOI] [PMC free article] [PubMed] [Google Scholar]
- 18.Ploemacher RE, van der Sluijs JP, van Beurden CA, Baert MR, Chan PL. Use of limiting-dilution type long-term marrow cultures in frequency analysis of marrow-repopulating and spleen colony–forming hematopoietic stem cells in the mouse. Blood. 1991;7:2527–2533. [PubMed] [Google Scholar]
- 19.Ploemacher RE, van der Loo JC, van Beurden CA, Baert MR. Wheat germ agglutinin affinity of murine hemopoietic stem cell subpopulations is an inverse function of their long-term repopulating ability in vitro and in vivo. Leukemia (Basingstoke) 1993;7:120–130. [PubMed] [Google Scholar]
- 20.Down JD, Ploemacher RE. Transient and permanent engraftment potential of murine hematopoietic stem cell subsets: differential effects of host conditioning with gamma radiation and cytotoxic drugs. Exp Hematol (Charlottesv) 1993;21:913–921. [PubMed] [Google Scholar]
- 21.Russel, E.S. 1996. Lifespan and aging patterns. In Biology of the Laboratory Mouse. E.L. Green, editor. McGraw-Hill Book Company, New York. 511–519.
- 22.Wolf NS, Penn PE, Jiang DZ, Fei RG, Pendergrass WR. Caloric restriction: conservation of in vivo cellular replicative capacity accompanies life-span extension in mice. Exp Cell Res. 1995;217:317–323. doi: 10.1006/excr.1995.1092. [DOI] [PubMed] [Google Scholar]
- 23.Roberts AW, Foote S, Alexander WS, Scott C, Robb L, Metcalf D. Genetic influences determining progenitor cell mobilization and leukocytosis induced by granulocyte colony–stimulating factor. Blood. 1997;89:2736–2744. [PubMed] [Google Scholar]
- 24.Ichihara M, Hara T, Takagi M, Cho LC, Gorman DM, Miyajima A. Impaired interleukin-3 (IL-3) response of the A/J mouse is caused by a branch point deletion in the IL-3 receptor alpha subunit gene. EMBO (Eur Mol Biol Organ) J. 1995;14:939–950. doi: 10.1002/j.1460-2075.1995.tb07075.x. [DOI] [PMC free article] [PubMed] [Google Scholar]
- 25.Ploemacher RE, van der Loo JC, van der Sluijs JP. In vitro assays for primitive hematopoietic cells [letter; comment] Blood. 1992;79:834–837. [PubMed] [Google Scholar]
- 26.Boultwood J, Lewis S, Wainscoat JS. The 5q-syndrome. Blood. 1994;84:3253–3260. [PubMed] [Google Scholar]
- 27.William C, Sever C, Pallavicini M, Harada H, Tanaka N, Slovak M, Yamamoto H, Harada K, Meeker T, List A, Taniguchi T. Deletion of IRF-1, mapping to chromosome 5q31.1, in human leukemia and preleukemic myelodysplasia. Science (Wash DC) 1993;259:968–971. doi: 10.1126/science.8438156. [DOI] [PubMed] [Google Scholar]
- 28.Boultwood J, Fidler C, Lewis S, Kelly S, Sheridan H, Littlewood TJ, Buckle VJ, Wainscoat JS. Molecular mapping of uncharacteristically small 5q deletions in two patients with the 5q- syndrome: delineation of the critical region on 5q and identification of a 5q- breakpoint. Genomics. 1994;19:425–432. doi: 10.1006/geno.1994.1090. [DOI] [PubMed] [Google Scholar]
- 29.Fairman J, Chumakov I, Chinault AC, Nowell PC, Nagarajan L. Physical mapping of the minimal region of loss in 5q- chromosome. Proc Natl Acad Sci USA. 1995;92:7406–7410. doi: 10.1073/pnas.92.16.7406. [DOI] [PMC free article] [PubMed] [Google Scholar]
- 30.Le Beau M, Espinosa R, III, Neuman W, Stock W, Roulston D, Larson R, Keinanen M, Westbrook C. Cytogenetic and molecular delineation of the smallest commonly deleted region of chromosome 5 in malignant myeloid diseases. Proc Natl Acad Sci USA. 1993;90:5484–5488. doi: 10.1073/pnas.90.12.5484. [DOI] [PMC free article] [PubMed] [Google Scholar]
- 31.Jaju, R.J., J. Boultwood, C. Fidler, H. Sheridan, F. Oliver, H. Walker, N. Parker, M. Kostrzewa, U. Mueller, J.S. Wainscoat, et al. 1996. Narrowing the critical deleted region in the 5q- syndrome. Blood. 88:370a. (Abstr.)
- 32.De Bry, R.W., and M.F. Seldin. Human/mouse homology relationships. National Center for Biotechnology Information, available at http://www3.ncbi.nlm.nih.gov/Homology/