

Abstract
Natural killer (NK) cells mediate defense against early murine cytomegalovirus (MCMV) infections in liver. The chemokine, macrophage inflammatory protein 1α (MIP-1α), can promote inflammatory responses. Our studies evaluated contributions of NK cells to early MCMV-induced liver inflammation and MIP-1α requirements for inflammation and delivery of antiviral defenses. NK cells were shown to be responsible for focal inflammation, and to be induced to migrate at high levels, in MCMV-infected livers. MIP-1α gene expression was elevated at coinciding times, and mice deficient in MIP-1α function were dramatically inhibited in both inflammatory and protective liver responses. The results precisely define MIP-1α–dependent steps required to achieve NK cell inflammation during, and mechanisms promoting defense against, viral infections in tissues.
NK cells are derived from bone marrow and found predominately in peripheral blood and spleen (1). They can, however, be induced to localize in other compartments including liver (2, 3). NK cells play important roles in early defense against certain viral infections and have a variety of mechanisms available for mediating antiviral functions (4). In particular, if appropriately activated, NK cells can kill sensitive target cells and/or produce high levels of IFN-γ (1, 4). Killing requires localization of NK cells in close proximity to virus-infected target cells. In contrast, NK cell IFN-γ production has the potential to act distally.
Cytomegaloviruses (CMV)1 are species-specific herpesviruses. Early immune mechanisms are essential in controlling virus replication and protecting the host from virus-induced pathology. In humans, liver is a common target organ of CMV infections (5, 6), and controlling virus-induced disease is essential for life (7–10). Similarly, murine CMV (MCMV) can infect liver and cause profound disease in mice (11–15). NK cells are principle mediators of early defense against both human (10) and mouse (16–18) CMV infections. They control liver MCMV infections through IFN-γ–dependent (19–21), but apparently killing-independent (21, 22), mechanisms. Under these conditions of infection, NK cell IFN-γ production is systemic with high levels in serum (20, 21, 23). It is not known if NK cells migrate to virus-infected cells in a proximity sufficient to mediate killing, and/or if they even have to accumulate to deliver antiviral defenses, in liver. MCMV infection induces early focal inflammation into liver parenchyma (12, 15, 17, 19, 24), but cellular constituents of infiltrates and inflammatory response roles in promoting resistance to infection are poorly understood.
The chemotactic cytokine (chemokine) macrophage inflammatory protein 1α (MIP-1α) plays an important role in inflammation induced by certain viral infections (25). This molecule is a member of the β (or C-C) subfamily of chemokines (26), which primarily act on lymphocytes and monocytes (27). In vitro studies with human cells identify MIP-1α as a potent inducer of NK cell chemotaxis (28– 30). However, in vivo roles for β-chemokines in promoting migration of NK cells have not been examined.
The experiments presented in this study were undertaken to characterize early liver inflammatory responses to MCMV in regard to (a) cellular requirements, constituents, and consequences, and (b) signal requirements for induction and promotion. The results demonstrate that, although monocyte/macrophage populations migrate to the liver, inflammatory foci formation after MCMV infection is primarily dependent upon accumulation of NK cells, and that the response localizes NK cells and IFN-γ production to sites of viral infection. They also show that MIP-1α is induced and required to promote the liver inflammatory response. Taken together, these studies define a role for NK cells during acute inflammation, steps necessary for rapid recruitment of NK cells to local sites of infection, and requirements for optimal delivery of antiviral defense in the liver.
Materials and Methods
Mice.
Specific pathogen-free male C57BL/6 (C57BL/ 6NTacfBR) and C57BL/6-nude (C57BL/6NTac-nufDF) mice were obtained from Taconic Laboratory Animals and Services (Germantown, NY). Male C57BL/6-SCID (C57BL/6J-scid /SzJ) were purchased from Jackson Laboratory (Bar Harbor, ME). Male and female mutant recombination activation gene (RAG)- 1–deficient C57BL/6 mice (C57BL/6J-Rag-1−/−; 31) were purchased from Jackson Laboratory and bred as homozygous, RAG-1−/−, mice under strict isolation in our pathogen-free facility at Brown University (Providence, RI). All C57BL/6, C57BL/6-nude, C57BL/6-SCID, and C57BL/6-RAG-1−/− used in experiments were males. E26 mice, established with CBA × C57BL/6 backgrounds as described (32), were bred by brother × sister matings in our pathogen-free facility. The E26 mice have been rendered NK and T cell–deficient as a result of high copy number human CD3ε transgenes (18, 32). Homozygous MIP-1α mutants, C57BL/6-MIP-1α−/−, established as described (25) and backcrossed onto C57BL/6 five times, were first bred and provided by Dr. Michael Caligiuri (Roswell Park Cancer Institute, Buffalo, NY) and later bred at Brown University. These mice were used with permission and originally obtained from Dr. Oliver Smithies (University of North Carolina, Chapel Hill, NC). Male and female E26 and C57BL/6-MIP-1α−/− mice were used in experiments. All mice were 4–12 wk of age. Mouse handling and experimental procedures were conducted in accordance with institutional guidelines for animal care and use.
Virus and Virus Titration.
Stocks of Smith strain MCMV salivary gland extracts were prepared as described (19). Infections were initiated on day 0 with 5 × 10⁴ PFUs of MCMV via the intraperitoneal route. Viral titers in livers were quantitated by plaque assays on NIH-3T3 fibroblasts provided by Dr. Ann Campbell (Eastern Virginia Medical School, Norfolk, VA). To enumerate plaques, cells were fixed with 10% buffered formalin (Fisher Scientific, Pittsburgh, PA) and stained with 0.1% crystal violet in 1% formaldehyde. Liver samples were frozen at time of harvest from mice, and then thawed, weighed, and homogenized just before use in plaque assays. Titers were quantitated as PFU per gram of tissue.
Antibody Treatments for In Vivo Cell Depletions and Neutralization of MIP-1α.
Mice were NK cell depleted by a single intraperitoneal injection of rabbit polyclonal antibody against asialo ganglio- N-tetraosylceramide (AGM1; Wako Chemicals, Dallas, TX), or the mouse anti-NK1.1 IgG2a monoclonal antibody, PK136, as described previously (19, 33, 34). Monocyte/macrophage populations were depleted as described (34) with a single intraperitoneal injection of F4/80 antibody, a rat monoclonal IgG2b directed against mouse monocyte/macrophage determinant (35). We have shown that these procedures respectively depleted bone marrow NK cells by 75–90% and F4/80+ cells by 90% without altering the reciprocal populations (34). Monoclonal antibodies were prepared and partially purified from either culture supernatant or ascites fluids. The PK136 line was obtained from Dr. Vinay Kumar (University of Texas, Southwestern Medical School, Dallas, TX). The F4/80 line was obtained from the American Type Culture Collection (Rockville, MD). Rabbit, mouse, or rat control antibodies were purchased from Sigma Chemical Co. (St. Louis, MO). For depletions before trafficking studies, antibodies were administered 24 h before cell isolation from donor mice.
Rabbit antiserum against MIP-1α and control normal serum were provided by Dr. Steven Kunkel (University of Michigan Medical School, Ann Arbor, MI; reference 36). These were administered intraperitoneally 24 h before infection of recipient mice for trafficking experiments.
Histology.
Liver samples were isolated, fixed in 10% neutral buffered formalin, and paraffin embedded. Tissue sections (5 μm) were stained with hematoxylin and eosin (H&E) and analyzed microscopically. Inflammatory foci, defined as discrete clusters containing between 6 and 60 nucleated cells, were quantitated as described previously (15, 19). In brief, inflammatory foci were identified, at a magnification of 100, as clusters of cells in totals of 8 × 1 mm2 areas of representative tissue. Numbers of nucleated cells per inflammatory foci were counted at a magnification of 400. Values given were calculated means of 20 representative foci. Clustered cells per liver area were mathematically determined as the product of (inflammatory foci numbers per area) × (nucleated cell numbers per foci). Cytomegalic inclusion bodies were identified by the characteristic “owl eye” nuclear morphology of infected cells and enumerated in totals of 8 × 1 mm2 areas of tissue.
Immunohistochemistry.
After removal, liver samples were immediately embedded in Tissue-Tek O.C.T. compound (Miles, Elkhart, IN) and frozen in liquid nitrogen. Sections were cut at a thickness of 8 μm using a Jung Frigocut 2800 N Cryostat (Leica, Deerfield, IL), fixed in cold acetone, rehydrated in PBS, and blocked for nonspecific staining with 5% normal fetal bovine serum in PBS, followed by an avidin/biotin block (Vector Laboratories, Inc., Burlingame, CA). To detect NK cell or monocyte/ macrophage antigens, sections were incubated overnight at 4°C with anti-AGM1 (Wako Chemicals) or anti-F4/80 (American Type Culture Collection) antibodies, respectively. Specificity of the anti-AGM1 staining for NK cells was demonstrated by the lack of anti-AGM1, but not anti-F4/80, antibody reactivity on section from mice rendered NK cell–deficient by either anti-AGM1 or anti-NK1.1 antibody treatment. IFN-γ protein was identified with antibody from the rat IFN-γ hybridoma cell line, XMG1.2, provided by Dr. Robert Coffman (DNAX Research Institute, Palo Alto, CA) that was prepared and partially purified from ascites fluids in this laboratory. MIP-1α protein was detected with goat polyclonal IgG antibody raised against recombinant mouse MIP-1α (Sigma Chemical Co.). Primary antibodies were incubated on tissue sections overnight at 4°C. All slides were subsequently washed in PBS and incubated 30 min with biotinylated antibody against rabbit IgG (Vector Laboratories, Inc.), or biotin-SP-conjugated F(ab′)2 fragment against rat IgG or goat IgG (Jackson ImmunoResearch Laboratory, Inc., West Grove, PA). Bound antibodies were detected with ABC reagent containing alkaline phosphatase and Vectastain substrate kit IV (both from Vector Laboratories, Inc.) to develop blue–purple enzyme substrate precipitates. Levamisole (Vector Laboratories, Inc.), at a final concentration of 200 μM, was used to inhibit endogenous alkaline phosphatase activity. To detect MCMV antigen in double-immunostaining experiments, slides were blocked in 5% normal fetal bovine serum before overnight incubation at 4°C with mouse anti-MCMV immune serum. Bound antibody was detected as described above but with biotin-SP-conjugated F(ab′)2 fragment against mouse IgG (Jackson ImmunoResearch Laboratory, Inc.), ABC reagent containing peroxidase (Vector Laboratories, Inc.), and Vectastain substrate DAB (Vector Laboratories, Inc.) to develop brown enzyme substrate precipitate. All antibodies were diluted in PBS containing 5% normal serum and used at concentrations determined to give optimal staining intensities. Equivalent concentrations of rabbit, rat, goat or mouse IgG were used as control antibodies (Sigma Chemical Co.). Staining specificity for appropriate antigens was documented by lack of reaction with control antibodies and in the absence of primary antibodies. Sections were counterstained with methyl green and mounted. AGM1-, F4/80–, IFN-γ–, and MIP-1α–positive cell populations were quantitated by counting blue–purple cells in a total of 8 × 1 mm2 areas of representative liver sections at a magnification of 400. Proportions within inflammatory foci were determined by dividing numbers of AGM1-positive cells within foci by total number of positive cells in areas.
In Vivo Trafficking Assays.
Bone marrow leukocytes were isolated and labeled with the stable red fluorescent dye, PKH26 (Sigma Chemical Co.), as previously described (34). In brief, leukocyte populations were resuspended at 2 × 10⁷ cells/ml in supplied diluent (Sigma Chemical Co.) and immediately mixed with 4 μM of PKH26/ml of diluent. After a 5-min incubation, labeling reactions were terminated by addition of fetal bovine serum (Hyclone Laboratories, Logan, UT). Cells were washed three times with RPMI 1640 (GIBCO BRL, Gaithersburg, MD) supplemented with 5% fetal bovine serum and resuspended at the concentration of 5 × 10⁷ cells/ml in sterile PBS. Recipient mice were injected intravenously with 1.5 × 10⁷ labeled cells in 300 μl.
To evaluate localization of transferred cells, livers of recipient mice were harvested 24 h after transfer, fixed in 10% buffered formalin for 15 h, and perfused in 20% sucrose-PBS for 6 h at 4°C. The samples were embedded in Tissue-Tek O.C.T. compound (Miles), frozen in liquid nitrogen, and sectioned at a thickness of 8 μm using a Jung Frigocut 2800 N Cryostat (Leica). Sections were mounted with AQUA-MOUNT (Lerner Laboratories, Pittsburg, PA), and immediately observed using a Microphot-SA microscope (Nikon, Tokoyo, Japan) with an epifluorescence attachment set at a main wavelength of 546 nm, a barrier filter BA590, and a dichroic mirror DM580. Inflammatory foci (see above) were quantitated by counting fluorescent cells in defined areas of representative liver tissues at a magnification of 100. Readily discernible inflammatory clusters contained ⩾5 labeled cells.
RNA and cDNA Analyses.
Total RNA was isolated from whole livers using RNAzol (BIOTECX LAB, Houston, TX) and either used directly for Northern blot analysis or reverse transcribed into cDNA as described previously (34). 5 μl cDNA was used as a template for PCR amplification with MIP-1α- or glyceraldehyde 3-phosphate dehydrogenase (GAPDH)-specific primers in a PTC-100 programmable thermal cycler (MJ Research, Watertown, MA) and previously described cycling conditions (37). Sense and antisense primer oligonucleotides for MIP-1α were selected from published sequence data (38), and GAPDH primers were from Clontech (Clontech Laboratories, Palo Alto, CA). PCR products were separated by electrophoresis on 1.8% agarose gels, and examined by ethidium bromide staining. Specificity was verified by transfer of PCR-amplified products using the method of Southern under alkaline conditions to Zeta-Probe filters (Bio-Rad Laboratories, Hercules, CA), and hybridization using internal oligonucleotide probes for MIP-1α (38) and GAPDH (Clontech). Probes were labeled by incorporation of [32P]dATP at the 5′-end of each oligonucleotide using the kit as described by manufacturer (Promega, Madison, WI). For Northern blot analysis, RNA was separated on a 1.2% agarose/formaldehyde gel, and transferred to Hybond-N filters (Amersham, Arlington Heights, IL) as described previously (34). Filters were sequentially hybridized with MIP-1α and GAPDH probes prepared as specific cDNA products and [32P]dATP-labeled by random priming. Films were exposed with one intensifying screen. Where stated, densitometry was carried out with a Fotodyne Image Analysis System (37).
Photographs.
Photographs shown of histology or immunohistochemistry were taken at a magnification of 31.25 or 125 using an Olympus camera (OM-1N; Olympus Corp., Lake Success, NY) and Kodak film (Ektachrome 160T; Rochester, NY). Photographs of in vivo trafficking assays were taken, at a magnification of 31.25 with Olympus camera OM-4T and Kodak TMAX 400 film at a shutter speed of 20 s, using the Microphot-SA microscope with the 546 main wavelength epifluorescence attachment, a barrier filter BA590, and dichroic mirror DM580.
Statistical Analysis.
Data were analyzed by the two-tailed Student's t test.
Results
MCMV Infection Induces NK Cell–dependent Focal Inflammation in Liver.
Previous studies have shown that focal liver inflammation peaks at 2–3 d after intraperitoneal infection with MCMV (15, 19, 24). To characterize the cellular compositions of, and contributions to, these responses, samples were isolated from uninfected mice or mice infected with MCMV at times of peak inflammatory responses. Normal and specific lymphocyte subset-deficient mice were examined. Tissue sections were prepared and H&E stained for morphological analyses. In contrast to control uninfected livers (Fig. 1 A), day 2 MCMV-infected livers from normal C57BL/6 mice had four to six infiltrate clusters per lobular region, each with ⩾6 nucleated cells, localized between portal areas and central veins (Fig. 1 B). MCMV-induced intranuclear inclusions, termed cytomegalic inclusion bodies, were occasionally seen associated with inflammatory foci. To evaluate contributions of T and/or B cells to early inflammatory foci development, responses in T and B cell–deficient C57BL/6-SCID, T and B cell–deficient C57BL/6-RAG-1−/−, and T cell–deficient C57BL/6-nude mice were examined (Fig. 1 and Table 1). Foci were not observed in uninfected samples from any, but were observed in high frequencies in day 2 MCMV-infected livers from all, of these mouse strains. Thus, development of liver inflammation during early MCMV infection did not require presence of either T or B cells.
Figure 1.

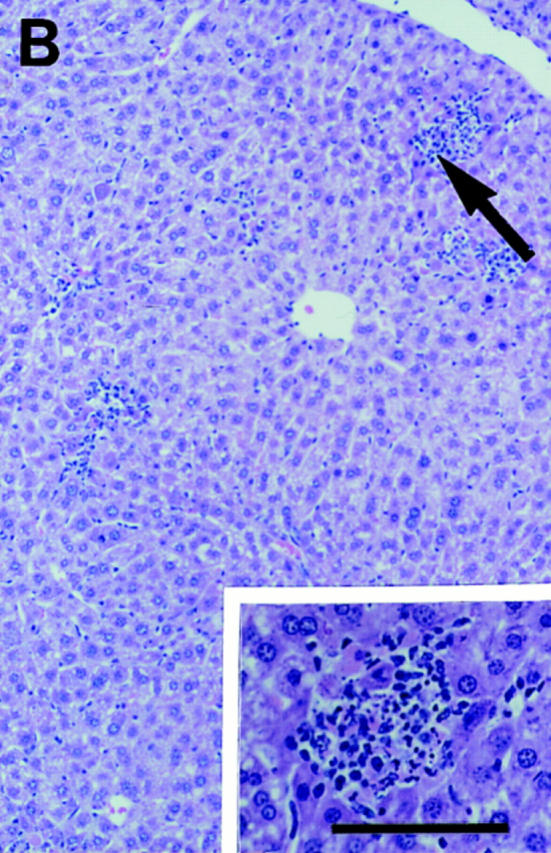


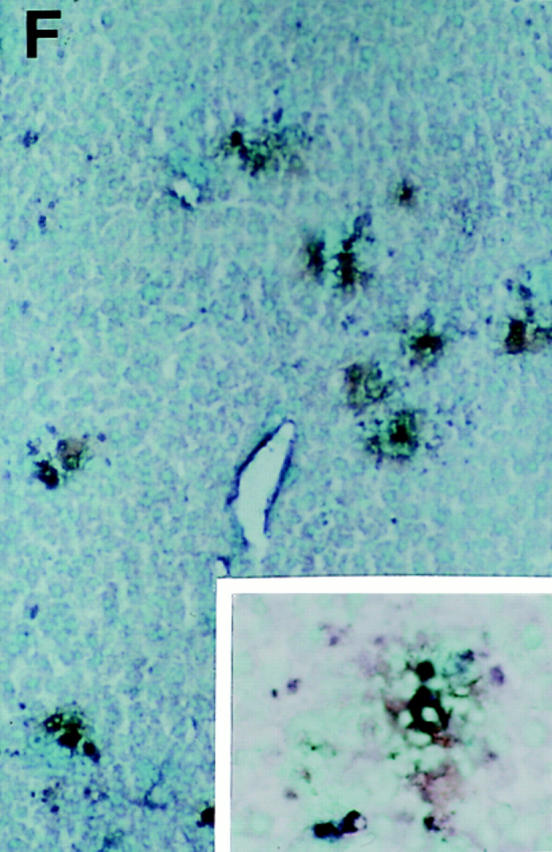
Characterization of liver inflammatory foci during MCMV infections. Livers were harvested and tissue sections prepared from uninfected mice (A) or day 2 MCMV-infected mice (B–F) as described in Materials and Methods. All panels present areas encompassing a central vein. (cv, central vein, given in A for orientation). A–C show morphology of H&E–stained paraffin sections from (A) uninfected C57BL/6, (B) day 2 infected C57BL/6, (C) and day 2 infected C57BL/6-SCID. Large arrows in B and C denote inflammatory areas presented in insets. D–F show immunohistochemically stained frozen sections from day 2 MCMV-infected C57BL/6-SCID mice, localizing viral antigen expression relative to NK cells, monocyte/macrophages, or IFN-γ protein. MCMV antigen expression is detected by staining of infected cells with brown precipitate and tissues are counterstained with methyl green in all three panels. Staining of second antigens as dark blue precipitates are as follows: (D) AGM1 staining of NK cells, (E) F4/80 staining of monocyte/ macrophage populations, and (F) IFN-γ protein staining. Panel photographs were taken at ×31.25. Inset photographs were taken at ×125. Bars, 100 μm.
Table 1.
NK Cell Contribution to Liver Inflammatory Foci Formation during Early MCMV Infection
| Mouse strain | Treatment | Inflammatory foci/area liver | Percent decrease | Inflammatory cell number/foci | Nucleated inflammatory cell number/area liver | Percent decrease | ||||||
|---|---|---|---|---|---|---|---|---|---|---|---|---|
| C57BL/6 | Control | 72 ± 11 | 32 ± 3 | 2,351 ± 501 | ||||||||
| Anti-AGM1 | 22 ± 5‡ | 70 | 10 ± 0 | 225 ± 53§ | 90 | |||||||
| C57BL/6 | Control | 45 ± 7 | 26 ± 1 | 1,169 ± 162 | ||||||||
| Anti-NK1.1 | 27 ± 3‡ | 39 | 10 ± 1 | 267 ± 15§ | 77 | |||||||
| E26 | None* | 19 ± 2 | 9 ± 1 | 167 ± 15 | ||||||||
| C57BL/6-nude | Control* | 89 ± 9 | 33 ± 3 | 2,875 ± 19 | ||||||||
| Anti-NK1.1* | 37 ± 5‡ | 59 | 14 ± 2 | 507 ± 7§ | 82 | |||||||
| C57BL/6-RAG-1−/− | Control | 77 ± 9 | 18 ± 2 | 1,389 ± 101 | ||||||||
| Anti-AGM1 | 7 ± 3‡ | 91 | 6 ± 0 | 42 ± 18§ | 97 |
H&E-stained liver sections were prepared from mice infected with MCMV for 2 d. The number of inflammatory foci were determined by counting clustered cells using a 1 × 1 mm2 grid and ×10 objective lens. A total of 8 × 1 mm2 areas were counted for each section. Nucleated cells per foci were enumerated using a ×40 objectives lens. 20 randomly selected areas of inflammatory foci were counted for each section. Data shown represents the mean ± SE (n = 3, except for
n = 2). Number compared to control is significant
P <0.05;
P <0.0001.
To determine contribution of NK cells, the T and NK cell–deficient E26 mice were examined. Inflammation was not detected in uninfected, and was induced in day 2 MCMV-infected, E26 mouse livers. However, in contrast to results in T and B cell–deficient mice, foci numbers and nucleated cell numbers per foci were reduced dramatically in infected E26 mice (Table 1). To evaluate NK cell effects in genetically normal mice and to use independent methods for depleting NK cells, livers were prepared from MCMV-infected C57BL/6, C57BL/6-nude, and C57BL/ 6-RAG-1−/− mice rendered NK cell depleted by treatments with either anti-AGM1 or anti-NK1.1 antibodies (Table 1). Compared to control antibody-treated infected mice, the NK cell–depleted mice were reduced in frequencies of inflammatory foci by 39–91%. Moreover, as the numbers of nucleated cells per inflammatory foci also were reduced, the absence of NK cells resulted in 77–97% decreases in total inflammatory cell numbers per liver area. The decreased inflammatory responses were accompanied by four- to ninefold increases in cytomegalic inclusion bodies per liver area (data not shown). These results demonstrate that magnitudes of total liver inflammatory responses to MCMV infection are dependent upon the presence of NK cells.
Identification of NK Cells in Inflammatory Foci.
Immunohistochemical studies with antibodies directed against the NK cell antigen, AGM1, were carried out to evaluate presence and location of NK cells within MCMV-infected livers. Assessment of AGM1+ cells in C57BL/6, C57BL/6-SCID, and C57BL/6-RAG-1−/− mice demonstrated that there were virtually no detectable AGM1+ cells within livers of uninfected mice. On day 2 after infection, there were dramatic increases, i.e., 1,225–2,688 AGM1+ cells per defined liver area, in all three strains of mice (Table 2). A few AGM1+ cells were observed scattered within sinusoidal cavities surrounding hepatocytes. However, of all AGM1+ cells, ∼80% were localized within inflammatory foci. Thus, MCMV infection induces a dramatic liver accumulation of cells expressing the NK cell marker, AGM1. Moreover, this induction is T and B cell independent.
Table 2.
AGM1-positive Cells in Liver Inflammatory Foci
| Mouse strain | Day after infection | Inflammatory foci/area liver | Inflammatory cell number/foci | Nucleated inflammatory cell number/ area liver | AGM1+ cell number/foci | AGM1+ inflammatory cell number/area liver | Percent inflammatory cells expressing AGM1 | |||||||
|---|---|---|---|---|---|---|---|---|---|---|---|---|---|---|
| C57BL/6 | 0 | 0 ± 0 | ||||||||||||
| 2 | 75 ± 4 | 31 ± 3 | 2,306 ± 266 | 26 ± 3 | 1,958 ± 281 | 85 | ||||||||
| C57BL/6-SCID | 0 | 0 ± 0 | ||||||||||||
| 2 | 101 ± 9 | 31 ± 1 | 3,125 ± 370 | 26 ± 1 | 2,688 ± 328 | 86 | ||||||||
| C57BL6-RAG-1−/− | 0 | 0 ± 0 | ||||||||||||
| 2 | 61 ± 6 | 24 ± 2 | 1,470 ± 141 | 20 ± 2 | 1,225 ± 211 | 83 |
Liver sections were prepared from uninfected or mice infected with MCMV for 2 d, immunostained with anti-AGM1 antibody to detect NK cells, and counterstained with methyl green as described in Materials and Methods. The number of inflammatory foci, identified as ⩾6 cells/cluster, were determined by counting clustered cells using a 1 × 1 mm2 grid and ×10 objective lens. A total of 8 × 1 mm2 areas were counted for each section. Nucleated and AGM1-positive cells were enumerated using a ×40 objective lens. 20 randomly selected areas of inflammatory foci were enumerated for each section. Data shown represents the mean ± SE (n = 3).
Two-color immunohistochemistry staining identifying MCMV antigen expression with a brown precipitate, AGM1+ cells with a blue precipitate, and total nucleated cells by counterstaining with methyl green, demonstrated that the inflammatory foci and AGM1+ cell accumulation sites were associated with points of viral infection (Fig. 1 D). Greater than 80% of sites expressing MCMV antigens colocalized with sites of AGM1+ cells and inflammatory foci. Similar observations were made in both C57BL/6 and T and B cell–deficient C57BL/6-SCID mice. To evaluate presence and location of monocyte/macrophages for comparison, immunohistochemical studies were carried out with antibody specific for the monocyte/macrophage antigen, F4/80. Small frequencies of F4/80+ cells were seen within sinus cavities of uninfected mice. The sinusoidal F4/ 80+ cells were induced to higher levels in infected mice. These cells had elongated cytoplasmic processes characteristic of liver macrophages identified as Kupffer cells. In day 2 infected livers from C57BL/6 and C57BL/6-SCID mice, F4/80+ cells were respectively at 2,849 ± 82 and 2,685 ± 28 per defined liver area (mean ± SE; n = 3). Two-color staining demonstrated, however, that, in contrast to the AGM1+ cells, F4/80+ cells were predominantly found in sinusoidal areas of infected livers and represented only minor populations within inflammatory foci at sites of viral antigen expression (Fig. 1 E). Approximately 7% of the F4/ 80+ cells were localized within inflammatory foci. Thus, AGM1+ NK cells, but not F4/80+ monocyte/macrophages, are selectively and preferentially induced to accumulate at sites of liver MCMV infection.
Production of IFN-γ Associated with Sites of MCMV Infection.
As NK cell–mediated antiviral effects in livers of MCMV-infected mice can be attributed to NK cell IFN-γ production (18), immunohistochemical studies were carried out to determine if cells within inflammatory foci and near sequestered sites of infection were producing IFN-γ protein. For these experiments, livers were prepared from T and B cell–deficient C57BL/6-SCID mice infected with MCMV for 2 d (Fig. 1 F). The inflammatory foci associated with sites of virus infection had cells expressing high levels of IFN-γ protein. IFN-γ+ cells were at frequencies of 263 ± 20 cells per defined liver area (means ± SE; n = 3) and virtually all of these were in inflammatory foci colocalizing with viral antigen expression. Thus, T and B cell– independent IFN-γ protein synthesis is induced at sites of MCMV infection.
Cell Trafficking to the Liver.
To evaluate and characterize virus-induced cell trafficking to liver, cells were prepared, stained with the red fluorescent lipophilic dye, PKH26, and transferred by intravenous injection into recipient uninfected and MCMV-infected mice. Based on our previous studies examining virus-induced changes in bone marrow cellularity and cell trafficking to spleens (34), bone marrow populations isolated from uninfected mice were used for cell transfers. Fluorescently labeled cells for analysis were isolated from untreated donor C57BL/6 or T and B cell–deficient C57BL/6-SCID mice, and transferred into genetically matched uninfected or 24-h MCMV-infected recipient mice. Livers were harvested at 24 h after cell transfer, i.e., day 2 after MCMV infection. Samples were sectioned, and analyzed by fluorescent microscopy. Donor-derived cells were evident in sinusoidal cavities surrounding hepatocytes in both uninfected and infected mice (Fig. 2, A–D). These cells exhibited elongated cytoplasmic processes. Although migration to these areas was observed in uninfected mice, it was modestly induced in infected mice. In addition to this sinusoidal cell migration pattern, an intense donor cell trafficking to focal aggregates was observed in MCMV-infected, but not in uninfected, recipient mice (Fig. 2, B compared to A, and D compared to C). In similarity to the inflammatory foci identified by H&E, majorities of these clustered cells, or “hot spots,” were found between portal areas and central veins, and averages of four to six foci, with >5 cells/foci, were observed per hepatic lobule. Comparison of migration patterns with donor cell populations isolated from normal and T and B cell–deficient mice (Fig. 2, A and B compared to C and D) demonstrated that both the sinusoidal localizations and focal aggregations were T and B cell independent. Moreover, as both patterns were observed in T and B cell–deficient recipient mice, their induction also was independent of these cell types. The results demonstrate a dynamic cell migration to sinusoidal cavities in uninfected and infected mice, and a virus-induced unique cell cluster migration with characteristics of inflammatory foci.
Figure 2.


Demonstration and characterization of MCMV-induced leukocyte cell trafficking to livers. Bone marrow leukocytes were harvested from uninfected untreated or uninfected antibody-treated mice and labeled with the fluorescent dye, PKH26. Labeled cells were transferred intravenously to recipient mice that were either uninfected or infected with MCMV for 24 h. Livers were harvested 24 h after cell transfer, processed, sectioned, and examined by fluorescence microscopy as described in Materials and Methods. All panels present area encompassing a central vein. (cv, central vein, given in A for orientation). Sections of livers isolated from the following recipient mice are shown: (A) uninfected C57BL/6 recipient after transfer of cells from untreated C57BL/6 donor mice, (B) MCMV-infected C57BL/6 recipient after transfer of cells from untreated C57BL/6 donor mice, (C) uninfected C57BL/6-SCID recipient after transfer of cells from control-IgG-treated C57BL/6-SCID donor mice, (D) infected C57BL/6-SCID recipient after transfer of cells from control-IgG-treated C57BL/6-SCID donor mice, (E) infected C57BL/6-SCID recipient after transfer of cells from anti-F4/80 antibody-treated C57BL/6-SCID donor mice, (F) infected C57BL/6-SCID recipient after transfer of cells from anti-NK1.1 antibody-treated C57BL/6-SCID donor mice, (G) uninfected C57BL/6 recipient after transfer of cells from untreated E26 mice, and (H) infected C57BL/6 recipient after transfer of cells from untreated E26 mice. Large arrows point to “hot spots” with cell clusters between the portal area and central vein. Small arrows point to individual elongated cells in hepatic sinusoids. Photographs were taken at ×31.25. Bar, 100 μm.
Characterization of Cell Types Trafficking to Liver.
To evaluate phenotypes of trafficking cells, C57BL/6 and C57BL/ 6-SCID donor mice bone marrow cells were rendered NK or monocyte/macrophage cell subset–deficient by administration of antibodies. NK cells were depleted by treatments with anti-NK1.1, and monocyte/macrophage populations were depleted by treatments with anti-F4/80. Control donor mice were either untreated or treated with control antibodies. Donor cell populations were transferred into matched C57BL/6 or C57BL/6-SCID mice. Examination of recipient livers demonstrated that migration to sinusoidal cavities was dependent upon F4/80+ cells in trafficking cell populations (Fig. 2 E). In infected C57BL/6-SCID mice, donor populations containing F4/80+ cells resulted in 1,232 ± 40, whereas donor populations depleted of F4/ 80+ cells had only 39 ± 4, individual fluorescent cells per defined liver area (mean ± SE; n = 3). This migration pattern, however, was readily observed with NK1.1+ cell-depleted donor cell populations (Fig. 2 F). In contrast, the virus-induced clustered cells were F4/80+ cell independent (Fig. 2 E) but NK1.1+ cell dependent (Fig. 2 F). Enumeration of these clusters in both C57BL/6 and C57BL/6-SCID mice, demonstrated that depletion of the F4/80+ monocyte/macrophage donor populations had virtually no effect on, but depletion of the NK1.1+ NK cells eliminated 78–91% of, the cell clusters developing after transfer (Table 3). Donor cells from the T and NK cell–deficient E26 mice gave similar results (Fig. 2, G and H; Table 3). Thus, although monocyte/macrophage populations migrate to liver, virus-induced focal cell migration and localization is NK cell dependent.
Table 3.
Characterization of Focal Cell Trafficking in MCMV-infected Liver
| Donor → recipient | Treatment | Number of fluorescent foci/liver area | ||||
|---|---|---|---|---|---|---|
| Donor | Recipient | |||||
| C57BL/6 → C57BL/6 | Untreated | Uninfected | 0 ± 0 | |||
| Control-lgG | MCMV | 18 ± 3 | ||||
| Anti-NK1.1 | MCMV | 4 ± 1‡ | ||||
| Control-lgG | MCMV | 20 ± 2 | ||||
| Anti-F4/80 | MCMV | 23 ± 1 | ||||
| C57BL/6-SCID → C57BL/6-SCID | Untreated | Uninfected | 0 ± 0* | |||
| Control-lgG | MCMV | 23 ± 1* | ||||
| Anti-NK1.1 | MCMV | 2 ± 2* ‡ | ||||
| Control-lgG | MCMV | 23 ± 3* | ||||
| Anti-F4/80 | MCMV | 21 ± 1* | ||||
| E26 → C57BL/6 | Untreated | Uninfected | 0 ± 0 | |||
| Untreated | MCMV | 0 ± 0 | ||||
Bone marrow cells were isolated from donor mice treated as indicated, labeled with PKH26, and intravenously transferred into recipient uninfected mice or mice infected with MCMV for 24 h. Livers were harvested 24 h after cell transfer, processed, sectioned, and analyzed by fluorescence microscopy as described in Materials and Methods. Number of foci with >5 fluorescent cells/5 × 1 mm2 areas were counted. Central vein areas of livers were randomly selected for each section. Data shown represents the mean ± SE (n = 3, except
n = 2). Number compared to control is significant
P <0.05.
NK Cell Trafficking to Liver Requires MIP-1α.
To evaluate MIP-1α induction, total RNA was prepared from livers of C57BL/6 mice infected with MCMV for 1, 2, 3, or 5 d. Control RNA was prepared from uninfected C57BL/6 and day 2 MCMV-infected C57BL/6-MIP-1α−/− mice. Northern blot analysis revealed induction of MIP-1α relative to GAPDH messenger RNA (mRNA) expression on day 2 after MCMV infection of normal C57BL/6 mice. The message was not detectable in samples from uninfected C57BL/6 normal or day 2 MCMV-infected C57BL/6-MIP-1α−/− mice, but was observed at marginally detectable levels with day 1, and >twofold induction levels with day 3, samples from infected normal mice. Densitometric analyses demonstrated that, compared to samples from uninfected C57BL/6 mice, MIP-1α induction was >50-fold on day 2 after infection (data not shown). To increase the signal, reverse transcription was used to generate cDNA from the mRNA, and expression was examined after PCR amplification of the cDNA and Southern blot analysis using specific internal sequences for hybridization. In contrast to GAPDH expression, MIP-1α was not detectable in RNA samples from infected C57BL/6-MIP-1α−/− (Fig. 3 A, lane 1) or uninfected C57BL/6 (Fig. 3 A, lane 2) mice. However, MIP-1α RNA expression was observed readily in samples from C57BL/6 mice on days 1, 2, 3, and 5 after MCMV infection (Fig. 3 A, lanes 3, 4, 5, and 6, respectively). Peak values were on day 2 after infection as evaluated by both Northern blot and PCR analyses.
Figure 3.


Elevated MIP-1α expression in MCMV-infected livers. (A) Liver RNA was isolated from uninfected and infected mice. Reverse transcriptase PCR cDNA products were generated and amplified using oligonucleotide primers specific to MIP-1α or the housekeeping gene, GAPDH. Amplified DNA was detected by Southern blot analysis and hybridization with specific internal oligonucleotide probes as described in Materials and Methods. Samples were from C57BL/6-MIP-1α−/− mice infected with MCMV for 2 d (lane 1), or C57BL/6 mice that were uninfected (lane 2) or infected with MCMV for 1, 2, 3, and 5 d (respectively, lanes 3–6). (B) Livers were harvested from day 2 MCMV-infected C57BL/6 mice, and frozen tissue sections were prepared and used for immunohistochemical staining of MIP-1α protein as described in Materials and Methods. The MIP-1α protein is identified by dark blue precipitates, and tissues are counterstained with methyl green. Panel photograph was taken at ×31.25. Inset photograph, showing higher power of an inflammatory focus, was taken at ×125. Bar, 100 μm.
Immunohistochemical studies were carried out, with antibodies specific for MIP-1α, to examine induction of MIP-1α protein and characterize the location of its expression in infected livers. There were no cells expressing detectable MIP-1α in the livers from uninfected C57BL/6 mice. In contrast, significant MIP-1α was induced in livers from day 2 MCMV-infected C57BL/6 mice (Fig. 3 B). Hence, both MIP-1α protein and mRNA are induced at early times during infection. The MIP-1α–positive cells were observed in both sinusoidal regions and in inflammatory foci. The numbers of MIP-1α+ cells per defined liver area reached 1,017 ± 47 (mean ± SEM; n = 3). Of these, 39% were localized in inflammatory foci. Of the cells in inflammatory foci, ∼15% were MIP-1α+. Thus, the protein is being made by a subset of cells localized to liver areas with active cell migration (Fig. 2), and it is expressed at sites both associated and not associated with inflammatory foci and viral antigen expression (Fig. 1).
To determine if the induced chemokine expression contributed to virus-induced recruitment of NK cells, cell trafficking experiments were carried out in mice lacking MIP-1α functions. For these studies, matched C57BL/6 and T and B cell–deficient C57BL/6-RAG-1−/− mice were used as donors and recipients. Recipients were MCMV infected for 24 h and either control treated or treated with antibodies neutralizing MIP-1α before infection. Livers were harvested at 24 h after cell transfer (Fig. 4, A and B; Table 4). Cell migration to sinusoidal cavities was MIP-1α independent, whereas the NK cell–dependent focal accumulation was MIP-1α dependent (Fig. 4 B, Table 4). Neutralization of MIP-1α in recipient mice inhibited the focal trafficking pattern by >75% (Table 4). As an independent and more complete evaluation of the role for MIP-1α, C57BL/6-MIP-1α−/− mice were examined. The focal, but not sinusoidal, trafficking pattern was inhibited by 100% in these mice (Table 4). Cell transfers from normal C56BL/6 donor to C57BL/6-MIP-1α−/− recipient mice, and C57BL/6-MIP-1α−/− donor to normal C56BL/6 recipient mice demonstrated that the requirement for MIP-1α was in recipient mice (Fig. 4, C and D; Table 4). Thus, there is a critical role for MIP-1α in promoting NK cell recruitment to liver during MCMV infection.
Figure 4.


Requirement for MIP-1α in NK cell trafficking to liver. Mice deficient in MIP-1α, as a result of genetic mutation or treatment with antibodies neutralizing the factor, were used to evaluate effects on trafficking to virus-infected livers. Bone marrow leukocytes were harvested from untreated mice, labeled with PKH26, and transferred intravenously into MCMV-infected recipients at 24 h after infection. Livers from recipient mice were harvested at 24 h after cell transfer. The following are shown: labeled cells from uninfected C57BL/6-RAG-1−/− mice transferred into infected C57BL/6-RAG-1−/− recipient mice either treated with control serum (A) or serum neutralizing MIP-1α (B) 1 d before infection, and labeled cells from uninfected C57BL/6 mice transferred into infected C57BL/6 (C) or C57BL/6-MIP-1α−/− (D) recipient mice. Photographs were taken at ×31.25. Bar, 100 μm. cv, central vein in A, for orientation. Large arrows point to foci with cell clusters. Small arrow points out individual sinusoidal cells.
Table 4.
MIP-1α Requirement for Focal Cell Trafficking in MCMV-Infected Liver
| Donor → recipient | Treatment | Number of fluorescent foci/liver area | ||||
|---|---|---|---|---|---|---|
| Donor | Recipient | |||||
| C57BL/6 → C57BL/6 | Untreated | Control/MCMV | 25 ± 2 | |||
| Untreated | Anti-MIP-1α/MCMV | 6 ± 1* | ||||
| C57BL/6-RAG-1−/− → C57BL/6-RAG-1−/− | Untreated | Control/MCMV | 23 ± 0 | |||
| Untreated | Anti–MIP-1α/MCMV | 5 ± 0* | ||||
| C57BL/6 → C57BL/6 | Untreated | MCMV | 21 ± 3 | |||
| C57BL/6-MIP-1α−/− → C57BL/6-MIP-1α−/− | Untreated | MCMV | 0 ± 0* | |||
| C57BL/6 → C57BL/6-MIP-1α−/− | Untreated | MCMV | 0 ± 0* | |||
| C57BL/6 → C57BL/6 | Untreated | MCMV | 25 ± 1 | |||
| C57BL/6-MIP-1α−/− → C57BL/6 | Untreated | MCMV | 27 ± 2 | |||
Bone marrow cells were isolated from donor mice treated as indicated, labeled with PKH26, and intravenously transferred into recipient mice infected with MCMV for 24 h. Livers were harvested 24 h after cell transfer, processed, sectioned, and analyzed by fluorescence microscopy as described in Materials and Methods. Number of foci with >5 fluorescent cells/5 × 1 mm2 areas were counted. Central vein areas of livers were randomly selected for each section. Data shown represents the mean ± SE (n = 3). Number compared to control is significant,
P <0.001.
Consequences of MIP-1α Deficiency during MCMV Infection.
Studies were carried out to determine if MIP-1α deficiencies and an associated lack of NK cell–inflammatory responses altered early resistance to MCMV infection. Livers were isolated from day 2 infected C57BL/6 and C57BL/ 6-MIP-1α−/− mice, and prepared for either morphological analyses or determination of viral titers in plaque assays. Enumeration of inflammatory foci and total numbers of nucleated cells per defined liver area demonstrated that the absence of endogenous MIP-1α profoundly inhibited, i.e., >99%, inflammation in the liver (Fig. 5, A, B, C and D). Inflammatory responses were not simply delayed because inhibitory effects were maintained in samples taken on day 3 after infection (Fig. 5, C and D). In contrast, viral infection increased in the liver (Fig. 5 E). Cells having the morphological characteristics of MCMV infection, i.e., cytomegalic inclusion bodies, were infrequent in tissues from infected mice having MIP-1α (Fig. 5 A). They were increased by over fourfold in livers from infected C57BL/6-MIP-1α−/− as compared to C57BL/6 mice (Fig. 5, B and E). Consistent with our previous studies of NK cell–depleted mice (18), there were no differences in liver viral titers between C57BL/6 control and MIP-1α−/− mice on day 2 after infection, but there were significant rises in liver viral titers in C57BL/6-MIP-1α−/− mice on day 3. At this time, mean log PFU per gram of liver ± SE was 4.8 ± 0.3 in C57BL/ 6 mice and 5.9 ± 0.3 in C57BL/6-MIP-1α−/− mice (P <0.01). Thus, absence of MIP-1α results in decreased inflammation but increased susceptibility to MCMV infection in the liver.
Figure 5.


Absence of liver inflammatory foci and decreased antiviral states in MCMV-infected MIP-1α–deficient mice. Liver samples were prepared from control C57BL/6 and C57BL/6–MIP-1α−/− day 2 MCMV-infected mice. Organs were harvested, and segments were either fixed for paraffin embedding, sectioning, and H&E staining, or frozen and then homogenized for viral titers in plaque assays as described in Materials and Methods. A and B show morphology of H&E-stained sections isolated from (A) C57BL/6 and (B) C57BL/6-MIP-1α−/− mice. Both A and B present areas encompassing a central vein (cv, central vein, given in A for orientation). Large arrow in A denotes inflammatory foci shown in inset. Large arrow in B denotes cluster of cytomegalic inclusion bodies shown in inset, and small arrows point to other clusters of intranuclear inclusion bodies radiating from the central vein. Photographs were taken at ×31.25. Inset photographs were taken at ×125. Bar, 100 μm. C gives inflammatory foci, D gives total numbers of nucleated cells, and E presents frequencies of cytomegalic inclusion bodies per defined area of 8 × 1 mm2 liver sections. C–E show mean results (± SE) from three replicate mice with samples harvested from infected mice on day 2 in hatched bars and on day 3 in solid bars. Differences between control C57BL/6 and C57BL/6-MIP-1α−/− mice are significant, * P <0.0005.
Discussion
These studies demonstrate that NK cells are required for peak focal inflammatory responses in livers at early times after infection, and that this inflammation is localized to sites of viral infection, dependent upon the chemokine MIP-1α, and contributes to optimal resistance to viral infection. Depletions of NK cells dramatically reduced both numbers of, and cell infiltrates in, virus-induced foci on day 2 after MCMV infection. In contrast, these parameters were not altered appreciably by T and B cell deficiencies. Cells expressing the NK cell marker AGM1 were concentrated within inflammatory foci and constituted >80% of the localized populations in normal as well as T and B cell–deficient mice. However, cells expressing the monocyte/macrophage antigen F4/80 were broadly distributed throughout sinusoidal regions, as well as in inflammatory foci, and constituted only 7% of the cells clustered in foci. Cells expressing IFN-γ protein were contained within inflammatory foci. Cell trafficking experiments showed monocyte/macrophage cell type–dependent migration into dispersed sinusoidal regions in both uninfected and infected mice, and an NK cell–dependent recruitment of cells in clusters induced by viral infection. MIP-1α expression was elevated in MCMV-infected livers, and neutralization of this chemokine's function inhibited both inflammation and NK cell migration to liver but resulted in increased sensitivity to infection. Taken together, the data demonstrate that NK cells are rapidly migrating to infected target sites, and that MIP-1α is a critical factor in the pathway promoting both this migration and early antiviral defense mechanisms.
To our knowledge this is the first characterization of a role for MIP-1α in promoting endogenous NK cell inflammatory responses. The results are consistent with the demonstrated chemotactic response of NK cells to MIP-1α in vitro (28–30). The studies extend previous work establishing an in vivo importance of MIP-1α for the documented T cell–dependent inflammation in day 7 influenza virus– infected lungs and in hearts on days 6–21 after Coxsackievirus infection (25). Taken together, these reports are remarkable because of the striking requirement for MIP-1α and absence of substitution by other chemokines. They suggest that MIP-1α is necessary for virus-induced lymphocytic inflammation under a variety of conditions, and provide a mechanism by which virus production of chemokine homologues (39) or chemokine binding proteins (39– 41) may act to circumvent host defense pathways. Interestingly, MCMV has genes with open reading frames coding for a β chemokine homologue (39) and for a receptor with similarities to chemokine receptors (42). Both genes are expressed at the RNA level during infection (39, 42), and mutated virus disrupted in the potential chemokine receptor gene has impaired growth in infected host salivary glands (42). Our studies indicate that host MIP-1α functions to promote an antiviral state even in the presence of these genes. However, it is possible that the absence of viral genes would result in enhanced NK cell inflammatory responses and resistance to infection in liver.
These experiments precisely define critical roles for MIP-1α in promoting focal NK cell migration and optimal defense, but they do not rule out viral resistance effects potentially induced by other β chemokines, such as monocyte chemoattractant protein (MCP)-1 and regulated upon activation in normal T cells expressed and secreted (RANTES), or exclude contributions by different chemokine classes. The sinusoidal cell migration patterns reported here can not be attributed solely to MIP-1α. Moreover, as the unique MCMV-induced NK cell–dependent localization of cells to splenic marginal zone areas previously described by our group (34) was not blocked by neutralization of MIP-1α function during the course of these experiments (Salazar-Mather, T.P., and C.A. Biron, unpublished data), there must be other factors directing this cell migration pattern. Additional candidate chemokines are the IFN-inducible murine monokine induced by IFN-γ (MuMig) and cytokine-responsive gene 2 (Crg-2) expressed, in both spleens and livers, after IFN-γ treatment or vaccinia virus infection (43).
The immunohistochemical studies demonstrate that MIP-1α protein expression is induced in livers as a result of MCMV infection. Although there is a possibility that viral infection may induce MIP-1α in infected cells, this did not appear to be the major mechanism of induction because expression was localized to both cells in sinusoidal areas and a subset of cells in inflammatory foci (Fig. 3 B), whereas viral antigen expression was primarily localized in areas of inflammation (Fig. 1, D–F). As chemokine expression can be induced by certain cytokines (44, 45), a more likely mechanism is that virus-induced cytokines elicit MIP-1α expression in uninfected cells. Because the MIP-1α+ cells primarily localized in areas with F4/80+ but not AGM1+ cells (Fig. 1 E) and did not account for all of the NK cells in inflammatory foci, i.e., there are many more NK cells and MIP-1α− cells, the positive cells are likely to be represented in non–NK cells. Preliminary studies in the NK and T cell–deficient mice indicate that MIP-1α expression is induced in the absence of these subsets, but at lower levels (data not shown). Ongoing studies in the laboratory are characterizing cell types responsible for, and/or contributing to the amplification of, MIP-1α expression.
Although we still have to formally prove that NK cells are not mediating distal antiviral effects in livers of the MIP-1α−/− mice devoid of inflammation, the studies to date suggest that NK cells have to migrate to sites of viral infection to mediate their antiviral functions. This is somewhat surprising given that NK cell regulation of liver MCMV infection is dependent upon NK cell–IFN-γ production but not NK cell killing (19–22), and that NK cell IFN-γ responses to MCMV are systemic with high production of factor in serum (20, 21, 23). It is not clear why NK cell migration to infection sites would be required for an IFN-γ–dependent effect, but we can suggest at least three different pathways. First, induction of NK cell IFN-γ production may require cell localization in proximity to virus-infected cells and/or macrophages to receive activation signals. This pathway does not seem likely because the NK cell IFN-γ response is being induced by IL-12, and because IL-12 is also produced systemically (20, 21, 23). Moreover, NK cells in MCMV-infected spleens are induced to produce IFN-γ (19, 34), and, even in the absence of liver inflammation, the day 2 and 3 infected MIP-1α−/− mice studied here had serum IFN-γ levels not significantly different from those in control infected mice (Nguyen, K.B., T.P. Salazar-Mather, and C.A. Biron, unpublished data). To determine if peak cytokine values are dependent on this chemokine, ongoing studies are characterizing kinetics and magnitude of systemic IFN-γ responses in MIP-1α−/− mice. However, based on the current data, it appears as though NK cell IFN-γ production can be induced at systemic levels even if the NK cells are not accumulating in infected livers, but that systemic factor cannot sufficiently substitute for NK cell localization.
Other possibilities are that NK cells must direct migration of, and/or deliver additional proximal signals to, monocyte/macrophages. The results presented here demonstrate that, although majorities of cells in infection site inflammatory foci are NK cells, a subset are monocyte/ macrophages. Macrophages can be important mediators of cellular immunity against viral infections with the potential to mediate antiviral effects through IFN-γ–inducible nitric oxide synthase– (46) and nitric oxide– (47) dependent mechanisms. The role for macrophages in resistance to MCMV infection has been appreciated for some time (48, 49). During MCMV infection, macrophages can be activated as a result of IFN-γ production by non–T cells (50), and inhibitors of nitric oxide synthase impair early antiviral defenses in the liver (22). If the macrophage-mediated antiviral defense mechanisms require close contact with viral replication, NK cell migration and local IFN-γ production may amplify macrophage accumulation at sites of infection. Such a pathway might enhance migration into the liver, but is unlikely to be critical for and/or selectively drive monocyte/macrophages to infection sites because there are many monocyte/macrophage phenotype cells migrating to locations lacking NK cells (Fig. 1) as well as trafficking to sinusoidal cavities in donor to recipient cell transfers with NK cell–deficient mice (Salazar-Mather, T.P., and C.A. Biron, unpublished data), and because inflammation is decreased by 150–270-fold in MIP-1α−/− mice (Fig. 5), but only 4–30-fold in NK cell–deficient (Table 1) mice. Alternatively and more likely, as peak macrophage activation requires exposure to signals in addition to IFN-γ (51), NK cells may deliver a second local signal at inflammatory sites.
The identification of NK cells was thorough and conclusive in these experiments. Although others have suggested that MCMV-induced inflammation is increased after NK cell depletion, characterization was limited in those studies (17). In addition to examining normal mice, we carried out extensive work with T cell–deficient mice to exclude possible effects mediated by either T cells and/or NK1.1+ T cells. Although it was not possible to use the anti-NK1.1 antibody for immunohistochemistry, specificity of the anti-AGM1 reagent for NK cells in these experiments was demonstrated by use of T and B cell–deficient mice, and by lack of anti-AGM1, but preserved anti-F4/80, antibody reactivity in tissues from MCMV-infected C57BL-SCID mice depleted of NK cells with anti-NK1.1 antibody treatments (see Materials and Methods). This approach localized NK cells within inflammatory foci. Furthermore, trafficking of cells to inflammatory foci was shown to be NK cell dependent by a variety of criteria. Taken together, the results definitively establish that NK cells are migrating to, and promoting numbers and sizes of, liver inflammatory foci.
In conclusion, the studies presented in this report characterize the following required cascade of sequential events in early MCMV-infected livers: (a) infection of tissue cells, (b) induction of MIP-1α expression, (c) rapid recruitment of monocyte/macrophage migration into sinusoidal cavities and NK cell clusters in inflammatory foci with small proportions of monocyte/macrophage cells, and (d) induction of optimal antiviral defenses. They suggest that NK cell localization is required for delivery of the IFN-γ pathway of antiviral defense mediated by these cells in the liver. Moreover, they demonstrate that MIP-1α is a critical factor in promoting NK cell inflammation and accessing optimal early defense against infection. Given the striking parallels between MCMV and human CMV disease as well as the NK cell requirements for optimal defense against infections in the respective mouse and human hosts, the results have significant implications for defense mechanisms against viral infections in humans.
Acknowledgments
We thank Dr. Steven Kunkel, University of Michigan Medical School, for his gift of antiserum-neutralizing MIP-1α and critical advice, as well as Dr. Michael Caligiuri, currently at Ohio State University School of Medicine, for generously providing the MIP-1α−/− mice to use in the experiments. The authors also acknowledge Drs. Kim Boekelheide and John Richberg for technical advice and Ms. Nancy Carter for technical assistance.
Footnotes
The study was supported by National Institutes of Health grant CA-41268.
Correspondence should be addressed to Christine A. Biron, Department of Molecular Microbiology and Immunology, Division of Biology and Medicine, Brown University, Box G-B269, Providence, RI 02912. Phone: 401-863-2921; FAX: 401-863-9045; E-mail: christine_biron@brown.edu
Abbreviations used in this paper: AGM1, asialo ganglio-N-tetraoglyceramide; CMV, cytomegalovirus; GAPDH, glyceraldehyde 3-phosphate dehydrogenase; H&E, hematoxylin and eosin; MCMV, murine CMV; MIP-1α, macrophage inflammatory protein 1α; mRNA, messenger RNA; RAG, recombination activation gene.
References
- 1.Trinchieri G. Biology of natural killer cells. Adv Immunol. 1989;47:187–376. doi: 10.1016/S0065-2776(08)60664-1. [DOI] [PMC free article] [PubMed] [Google Scholar]
- 2.Wiltrout RH, Pilaro AM, Gruys ME, Talmadge JE, Longo DL, Ortaldo JR, Reynolds CW. Augmentation of mouse liver–associated natural killer cell activity by biological response modifiers occurs largely via rapid recruitment of large granular lymphocytes from the bone marrow. J Immunol. 1989;143:372–378. [PubMed] [Google Scholar]
- 3.McIntyre KW, Welsh RM. Accumulation of natural killer and cytotoxic T large granular lymphocytes in the liver during virus infection. J Exp Med. 1986;164:1667–1681. doi: 10.1084/jem.164.5.1667. [DOI] [PMC free article] [PubMed] [Google Scholar]
- 4.Biron CA. Activation and function of natural killer cell responses during viral infections. Curr Opin Immunol. 1997;9:24–34. doi: 10.1016/s0952-7915(97)80155-0. [DOI] [PubMed] [Google Scholar]
- 5.Ten Napel, H.H., H.J. Houthoff, and T.H. The. Cytomegalovirus hepatitis in normal and immune compromised hosts. Liver. 1984;4:184–194. doi: 10.1111/j.1600-0676.1984.tb00926.x. [DOI] [PubMed] [Google Scholar]
- 6.Paya CV, Hermans PE, Wiesner RH, Ludwig J, Smith TF, Rakela J, Krom RA. Cytomegalovirus hepatitis in liver transplantation: prospective analysis of 93 consecutive orthotopic liver transplantations. J Infect Dis. 1989;160:752–758. doi: 10.1093/infdis/160.5.752. [DOI] [PubMed] [Google Scholar]
- 7.Betts RF, Hanshaw JB. Cytomegalovirus (CMV) in the compromised host(s) Annu Rev Med. 1977;28:103–110. doi: 10.1146/annurev.me.28.020177.000535. [DOI] [PubMed] [Google Scholar]
- 8.Stagno S, Pass RF, Dworsky ME, Henderson RE, Moore EG, Walton PD, Alford CD. Congenital cytomegalovirus infections: the relative importance of primary and recurrent maternal infections. N Engl J Med. 1982;306:945–949. doi: 10.1056/NEJM198204223061601. [DOI] [PubMed] [Google Scholar]
- 9.Drew WL. Cytomegalovirus infection in patients with AIDS. J Infect Dis. 1988;158:449–456. doi: 10.1093/infdis/158.2.449. [DOI] [PubMed] [Google Scholar]
- 10.Biron CA, Byron KS, Sullivan JL. Severe herpesvirus infections in an adolescent without natural killer cells. N Engl J Med. 1989;320:1731–1735. doi: 10.1056/NEJM198906293202605. [DOI] [PubMed] [Google Scholar]
- 11.McCordock HA, Smith MG. The visceral lesions produced in mice by the salivary gland virus of mice. J Exp Med. 1936;63:303–310. doi: 10.1084/jem.63.3.303. [DOI] [PMC free article] [PubMed] [Google Scholar]
- 12.Henson D, Smith RD, Gehrke J. Non-fatal mouse cytomegalovirus hepatitis: combined morphologic virologic and immunologic observations. Am J Pathol. 1966;49:871–888. [PMC free article] [PubMed] [Google Scholar]
- 13.Reynolds RP, Rahija RJ, Schenkman DI, Richter CB. Experimental murine cytomegalovirus infection in severe combined immunodeficient mice. Lab Anim Sci. 1993;43:291–295. [PubMed] [Google Scholar]
- 14.Shanley JD, Biczak L, Forman SJ. Acute murine cytomegalovirus infection induces lethal hepatitis. J Infect Dis. 1993;167:264–269. doi: 10.1093/infdis/167.2.264. [DOI] [PubMed] [Google Scholar]
- 15.Orange JS, Salazar-Mather TP, Opal SM, Biron CA. Mechanisms for virus-induced liver disease: a TNF-mediated liver pathology independent of NK and T cells during murine cytomegalovirus infection. J Virol. 1997;71:9248–9258. doi: 10.1128/jvi.71.12.9248-9258.1997. [DOI] [PMC free article] [PubMed] [Google Scholar]
- 16.Bancroft GJ, Shellam GR, Chalmer JE. Genetic influences on the augmentation of natural killer (NK) cells during murine cytomegalovirus infection: correlation with patterns of resistance. J Immunol. 1981;126:988–994. [PubMed] [Google Scholar]
- 17.Bukowski JF, Woda BA, Habu S, Okumura K, Welsh RM. Natural killer cell depletion enhances virus synthesis and virus-induced hepatitis in vivo. J Immunol. 1983;131:1531–1538. [PubMed] [Google Scholar]
- 18.Bukowski JF, Woda BA, Welsh RM. Pathogenesis of murine cytomegalovirus infection in natural killer cell–depleted mice. J Virol. 1984;52:119–128. doi: 10.1128/jvi.52.1.119-128.1984. [DOI] [PMC free article] [PubMed] [Google Scholar]
- 19.Orange JS, Wang B, Terhorst C, Biron CA. Requirement for natural killer cell–produced interferon γ in defense against murine cytomegalovirus infection and enhancement of this pathway by interleukin 12 administration. J Exp Med. 1995;182:1045–1056. doi: 10.1084/jem.182.4.1045. [DOI] [PMC free article] [PubMed] [Google Scholar]
- 20.Orange JS, Biron CA. An absolute and restricted requirement for IL-12 in natural killer cell IFN-γ production and antiviral defense. J Immunol. 1996;156:1138–1142. [PubMed] [Google Scholar]
- 21.Orange JS, Biron CA. Characterization of early IL-12, IFN-α/β, and TNF effects on antiviral state and NK cell responses during murine cytomegalovirus infection. J Immunol. 1996;156:4746–4756. [PubMed] [Google Scholar]
- 22.Tay CH, Welsh RM. Distinct organ-dependent mechanisms for the control of murine cytomegalovirus infection by natural killer cells. J Virol. 1997;71:267–275. doi: 10.1128/jvi.71.1.267-275.1997. [DOI] [PMC free article] [PubMed] [Google Scholar]
- 23.Ruzek MC, Miller AH, Opal SM, Pearce BD, Biron CA. Characterization of early cytokine responses and an interleukin (IL)-6–dependent pathway of endogenous glucocorticoid induction during murine cytomegalovirus infection. J Exp Med. 1997;185:1185–1192. doi: 10.1084/jem.185.7.1185. [DOI] [PMC free article] [PubMed] [Google Scholar]
- 24.Olver SD, Price P, Shellam GR. Cytomegalovirus hepatitis: characterization of the inflammatory infiltrate in resistant and susceptible mice. Clin Exp Immunol. 1994;98:375–381. doi: 10.1111/j.1365-2249.1994.tb05500.x. [DOI] [PMC free article] [PubMed] [Google Scholar]
- 25.Cook DN, Beck MA, Coffman TM, Kirby SL, Sheridan JF, Pragnell IB, Smithies O. Requirement of MIP-1α for an inflammatory response to viral infection. Science. 1995;269:1583–1585. doi: 10.1126/science.7667639. [DOI] [PubMed] [Google Scholar]
- 26.Oppenheim JJ, Zachariae COC, Mukaida N, Matsushima K. Properties of the novel proinflammatory supergene “intercrine” cytokine family. Annu Rev Immunol. 1991;9:617–648. doi: 10.1146/annurev.iy.09.040191.003153. [DOI] [PubMed] [Google Scholar]
- 27.Brown KD, Zurawski SM, Mossman TR, Zurawski G. A family of small inducible proteins secreted by leukocytes are members of a new superfamily that include leukocyte and fibroblast-derived inflammatory agents, growth factors and indicators of various activation processes. J Immunol. 1989;142:679–687. [PubMed] [Google Scholar]
- 28.Maghazachi AA, Al-Aoukaty A, Schall TJ. C-C chemokines induce the chemotaxis of NK and IL-2–activated NK cells. J Immunol. 1994;153:4969–4977. [PubMed] [Google Scholar]
- 29.Taub DD, Sayers TJ, Carter CRD, Ortaldo JR. α and β chemokines induce NK cell migration and enhance NK-mediated cytolysis. J Immunol. 1995;155:3877–3888. [PubMed] [Google Scholar]
- 30.Loetscher P, Seitz M, Clark-Lewis I, Baggiolini M, Moser B. Activation of NK cells by CC chemokines: chemotaxis, Ca2+mobilization, and enzyme release. J Immunol. 1996;156:322–327. [PubMed] [Google Scholar]
- 31.Mombaerts P, Iacomini J, Johnson RS, Herrup K, Tonegawa S, Papaioannou VE. RAG-1–deficient mice have no mature B and T lymphocytes. Cell. 1992;68:868–877. doi: 10.1016/0092-8674(92)90030-g. [DOI] [PubMed] [Google Scholar]
- 32.Wang BC, Biron C, She J, Higgins K, Sunshine M-J, Lacy E, Lonberg N, Terhorst C. A block in both early T lymphocyte and natural killer cell development in transgenic mice with high-copy numbers of the human CD3ε gene. Proc Natl Acad Sci USA. 1994;91:9402–9406. doi: 10.1073/pnas.91.20.9402. [DOI] [PMC free article] [PubMed] [Google Scholar]
- 33.Su HC, Orange JS, Fast LD, Chan AT, Simpson SJ, Terhorst C, Biron CA. IL-2–dependent NK cell responses discovered in virus-infected β2-microglobulin– deficient mice. J Immunol. 1994;153:5674–5681. [PubMed] [Google Scholar]
- 34.Salazar-Mather TP, Ishikawa RI, Biron CA. NK cell trafficking and cytokine expression in splenic compartments after IFN induction and viral infection. J Immunol. 1996;157:3054–3064. [PubMed] [Google Scholar]
- 35.Austyn JM, Gordon S. F4/80: a monoclonal antibody directed specifically against mouse macrophages. Eur J Immunol. 1981;10:805–810. doi: 10.1002/eji.1830111013. [DOI] [PubMed] [Google Scholar]
- 36.Smith RE, Strieter RM, Phan SH, Lukacs NW, Huffnagle GB, Wilke CA, Burdick MD, Lincoln P, Evanoff H, Kunkel SL. Production and function of murine macrophage inflammatory protein-1α in bleomycin-induced lung injury. J Immunol. 1994;153:4704–4712. [PubMed] [Google Scholar]
- 37.Orange JS, Salazar-Mather TP, Opal SM, Spencer RL, Miller AH, McEwen BS, Biron CA. Mechanism of IL-12–mediated toxicities during experimental viral infections: role of TNF and glucocorticoids. J Exp Med. 1995;181:901–914. doi: 10.1084/jem.181.3.901. [DOI] [PMC free article] [PubMed] [Google Scholar]
- 38.Rhoades ER, Cooper AM, Orme IM. Chemokine response in mice infected with Mycobacterium tuberculosis. . Infect Immun. 1995;63:3871–3877. doi: 10.1128/iai.63.10.3871-3877.1995. [DOI] [PMC free article] [PubMed] [Google Scholar]
- 39.MacDonald MR, Li XY, Virgin HW., IV Late expression of a beta chemokine homolog by murine cytomegalovirus. J Virol. 1997;71:1671–1678. doi: 10.1128/jvi.71.2.1671-1678.1997. [DOI] [PMC free article] [PubMed] [Google Scholar]
- 40.Gao JL, Murphy PM. Human cytomegalovirus open reading frame US28 encodes a functional β chemokine receptor. J Biol Chem. 1994;268:28539–28542. [PubMed] [Google Scholar]
- 41.Graham KA, Lalani AS, Macen JL, Ness TL, Barry M, Liu LY, Lucas A, Clark-Lewis I, Moyer RW, McFadden G. The T1/35kDa family of poxvirus-secreted proteins bind chemokines and modulate leukocyte influx into virus-infected tissues. Virology. 1997;229:12–24. doi: 10.1006/viro.1996.8423. [DOI] [PubMed] [Google Scholar]
- 42.Davis-Poynter NJ, Lynch DM, Vally H, Shellam GR, Rawlinson WD, Barrell BG, Farrell HE. Identification and characterization of a G protein–coupled receptor homolog encoded by murine cytomegalovirus. J Virol. 1997;71:1521–1529. doi: 10.1128/jvi.71.2.1521-1529.1997. [DOI] [PMC free article] [PubMed] [Google Scholar]
- 43.Amichay D, Gazzinelli RT, Karupiah G, Moench TR, Sher A, Farber JM. Genes for chemokines mumig and crg-2are induced in protozoan and viral infections in response to IFN-γ with patterns of tissue expression that suggest nonredundant roles in vivo. J Immunol. 1996;157:4511–4520. [PubMed] [Google Scholar]
- 44.Lukacs NW, Strieter RM, Elner VM, Evanoff HL, Burdick M, Kunkel SL. Intercellular adhesion molecule–1 mediates the expression of monocyte-derived MIP-1α during monocyte–endothelial cell interactions. Blood. 1994;583:1174–1178. [PubMed] [Google Scholar]
- 45.Bluman EM, Bartynski KJ, Avalos BR, Caligiuri MA. Human natural killer cells produce abundant macrophage inflammatory protein–1α in response to monocyte-derived cytokines. J Clin Invest. 1996;97:2722–2727. doi: 10.1172/JCI118726. [DOI] [PMC free article] [PubMed] [Google Scholar]
- 46.Karupiah G, Xie QW, Buller RM, Nathan C, Duarte C, MacMicking JD. Inhibition of viral replication by interferon-gamma–induced nitric oxide synthase. Science. 1993;261:1445–1448. doi: 10.1126/science.7690156. [DOI] [PubMed] [Google Scholar]
- 47.Bi Z, Reiss CS. Inhibition of vasicular stomatitis virus infection by nitric oxide. J Virol. 1995;69:2208–2213. doi: 10.1128/jvi.69.4.2208-2213.1995. [DOI] [PMC free article] [PubMed] [Google Scholar]
- 48.Selgrade MK, Osborn JE. Role of macrophages in resistance to murine cytomegalovirus. Infect Immun. 1974;10:1383–1390. doi: 10.1128/iai.10.6.1383-1390.1974. [DOI] [PMC free article] [PubMed] [Google Scholar]
- 49.Price P, Winter JG, Shellam GR. Genetically determined resistance to murine cytomegalovirus: a role for lymphocytostatic macrophages. J Gen Virol. 1987;68:2997–3008. doi: 10.1099/0022-1317-68-12-2997. [DOI] [PubMed] [Google Scholar]
- 50.Heise MT, Virgin HW., IV The T-cell–independent role of gamma interferon and tumor necrosis factor alpha in macrophage activation during murine cytomegalovirus and herpes simplex virus infections. J Virol. 1995;69:904–909. doi: 10.1128/jvi.69.2.904-909.1995. [DOI] [PMC free article] [PubMed] [Google Scholar]
- 51.Ding AH, Nathan CF, Stuehr DJ. Release of reactive nitrogen intermediates and reactive oxygen intermediates from mouse peritoneal macrophages. J Immunol. 1988;141:2407–2412. [PubMed] [Google Scholar]