

Abstract
Utrophin, like its homologue dystrophin, forms a link between the actin cytoskeleton and the extracellular matrix. We have used a new method of image analysis to reconstruct actin filaments decorated with the actin-binding domain of utrophin, which contains two calponin homology domains. We find two different modes of binding, with either one or two calponin-homology (CH) domains bound per actin subunit, and these modes are also distinguishable by their very different effects on F-actin rigidity. Both modes involve an extended conformation of the CH domains, as predicted by a previous crystal structure. The separation of these two modes has been largely dependent upon the use of our new approach to reconstruction of helical filaments. When existing information about tropomyosin, myosin, actin-depolymerizing factor, and nebulin is considered, these results suggest that many actin-binding proteins may have multiple binding sites on F-actin. The cell may use the modular CH domains found in the spectrin superfamily of actin-binding proteins to bind actin in manifold ways, allowing for complexity to arise from the interactions of a relatively few simple modules with actin.
Keywords: actin; utrophin; image analysis; calponin-homology domains; electron microscopy
Introduction
Utrophin is a large cytoskeletal protein that is part of the spectrin superfamily of actin-binding proteins. Members of this superfamily include dystrophin, spectrin, fimbrin, α-actinin, filamin, and plectin, all containing an N-terminal actin-binding region composed of single or multiple copies of calponin-homology (CH)* domains. Utrophin (395 kD) is expressed ubiquitously in humans, and is 69% homologous to dystrophin (427 kD), the protein defective in Duchenne and Becker muscular dystrophies. Both dystrophin and utrophin are thought to link the actin cytoskeleton to the extracellular matrix, and overexpression of utrophin has been shown to functionally replace dystrophin in the mdx mouse model of Duchenne muscular dystrophy (Tinsley et al., 1998).
Crystal structures exist for a number of actin-binding domains (ABDs) from proteins in this family, including fimbrin (Goldsmith et al., 1997), dystrophin (Norwood et al., 2000), and utrophin (Keep et al., 1999). In each of these proteins, the ABDs contain tandem pairs of CH domains. We have used EM to examine complexes of F-actin with the ut261 fragment of utrophin (Winder et al., 1995). A crystal structure of this fragment showed that the two CH domains were separated by an extended α-helix, forming a dumbell (Keep et al., 1999). This was in contrast to the compact conformation of the two CH domains seen in the fimbrin crystal structure (Goldsmith et al., 1997), leading Keep et al. (1999) to suggest that these actin-binding domains may be more flexible than was previously thought, and that utrophin might bind to actin in this extended conformation. They proposed that domain reorganization may play a role in the actin-binding mechanism.
We have applied a new method of image analysis of helical polymers based upon refinement of the local helical geometry (Egelman, 2000) to these complexes. This method, iterative helical real space reconstruction (IHRSR), provides an exceptional ability to separate classes of polymorphic structures, and the previous application of this method to complexes of F-actin with actin-depolymerizing factor (ADF) (Galkin et al., 2001) yielded novel insights that would not have been possible using conventional approaches.
Results
Electron micrographs show two different filament states after the incubation of β-actin filaments (Fig. 1 A) with the ut261 utrophin fragment (Fig. 1 B). Relatively rigid filaments or segments of filaments can be seen (Fig. 1 B, white arrow) that appear different from undecorated filaments. But more massive, flexible filaments or segments of filaments (Fig. 1 B, black arrow) can also be seen. These massive (dark) filaments are more likely to aggregate, whereas the light filaments are less likely to aggregate than the undecorated control filaments. Under the conditions that we are using, we expect rather complete saturation of the actin by ut261, as the binding constant that we measure for ut261 by cosedimentation is 7.1 ± 4.1 μM with a stoichiometry of 1:1 (unpublished data). These values are consistent with most previously published results (Winder, 1996; Keep et al., 1999; Moores and Kendrick-Jones, 2000; Zuellig et al., 2000), except Winder et al. (1995), where a stoichiometry of 2:1 (ut261:actin) was reported.
Figure 1.
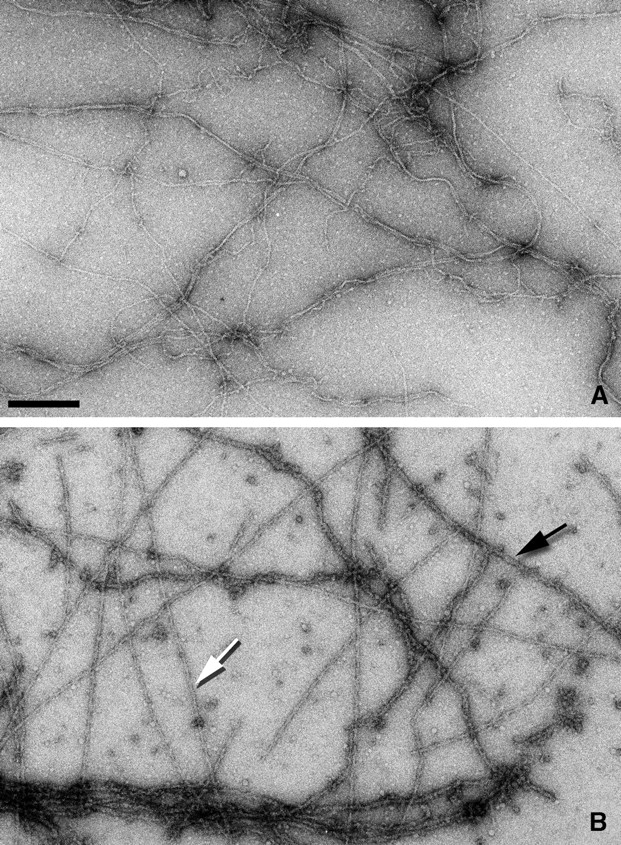
Electron micrographs of negatively stained β-actin filaments alone (A) and decorated with the utrophin ABD (B). Two different forms of decoration can be seen (B). Lightly stained, rigid filaments (white arrow) and darkly stained, flexible filaments (black arrow). The darkly stained filaments tend to aggregate extensively, whereas such aggregation is not seen with the lightly stained filaments. Bar, 2,000 Å.
Analysis of a total of ∼22,500 segments, each containing ∼14 actin subunits, revealed that three different populations could be found within the decorated filaments. These are two different modes of decoration by ut261, and a third category which contained undecorated, partially decorated actin, or disordered binding. The IHRSR approach (Figs. 2, 3, and 4) was key to the separation of these modes, since conventional helical analysis (DeRosier and Klug, 1968) would tend to average these states together. Although we find that there is a cooperativity in the mode of binding, as evidenced by the fact that different filament types can be differentiated by eye in electron micrographs (Fig. 1), detailed analysis shows that this cooperativity is far from complete. Two different independent methods were employed to sort and classify the filament segments used for three-dimensional reconstruction. One approach is based upon cross-correlations with projections of reference volumes (Fig. 2), whereas the second approach is based upon using differences in the two-dimensional radial density distributions within images for sorting (Fig. 3).
Figure 2.
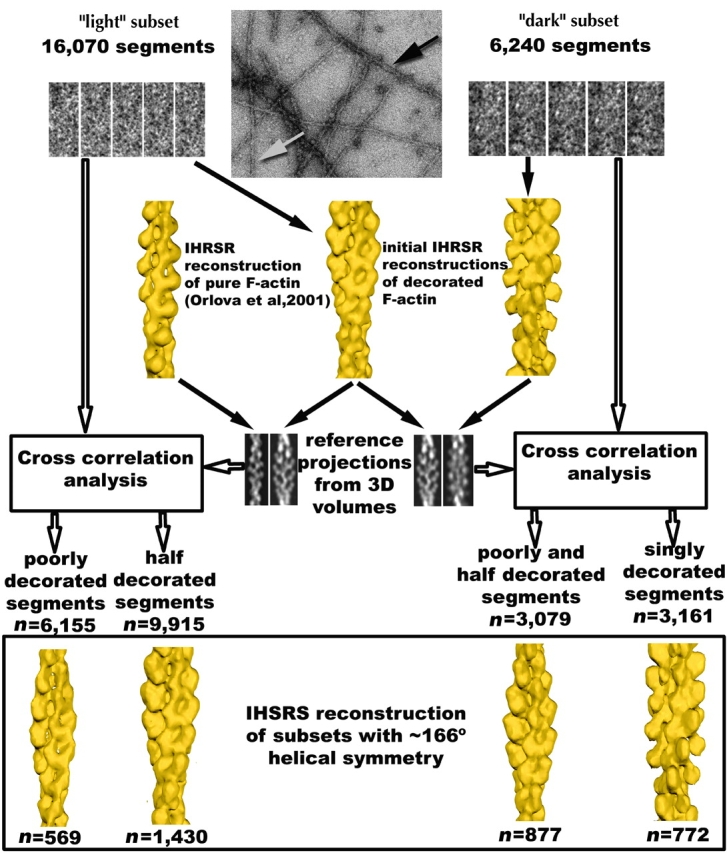
A schematic diagram illustrating how the IHRSR method was used to sort the filament images into three class: half-decorated, singly decorated, and poor or mixed decoration. An electron micrograph (top, center) shows a typical field of filaments, and from these, 16,070 segments were extracted from filaments identified as light (white arrow), and 6,240 segments were extracted from filaments identified as dark (black arrow). Five examples of such segments are shown for each set. Two initial three-dimensional reconstructions were then generated from ∼2,000 segments from each set and yielded a mean symmetry of both sets of ∼166° (in this instance, the variable twist of F-actin was averaged). A third reconstruction, of pure F-actin, was taken from previously published work (Orlova et al., 2001). These initial reconstructions were clearly distinguishable from each other and from pure F-actin, but suffered from inhomogeneity of decoration, mixture of modes, and variable twist. The next step was to generate reference projections from these three-dimensional volumes for sorting. The light segments were then cross-correlated against projections of both pure F-actin and the light reconstruction, whereas the dark segments were cross-correlated against projections of both the light and dark reconstructions. Although only two reference projections are shown for each case, in actuality, 90 reference projections were generated for each symmetry (corresponding to azimuthal rotations of 4° about the helical axis), and actin symmetries from 154° to 174° in 2° increments were used. Thus, the 16,070 light segments and the 6,240 dark segments were each cross-correlated against 1,980 reference projections. This then yielded a sorting of segments by both twist and decoration. New reconstructions were then iteratively generated using IHRSR for all classes, including poorly, half- and singly decorated subsets showing different symmetries. The largest subsets for all classes had a final symmetry of ∼166°, and reconstructions from these subsets are shown at the bottom. For the segments initially collected from light filaments, ∼38% (6,155 out of 16,070) showed stronger correlation with pure F-actin than they did to the half-decorated reconstruction. For the segments initially collected from dark filaments, ∼50% (3,079 out of 6,240) showed stronger correlation with the half decoration than they did to the singly decorated reconstruction. These percentages cannot be interpreted in terms of stoichiometries or incomplete binding, since we are sorting primarily on ordered binding rather than actual occupancy.
Figure 3.
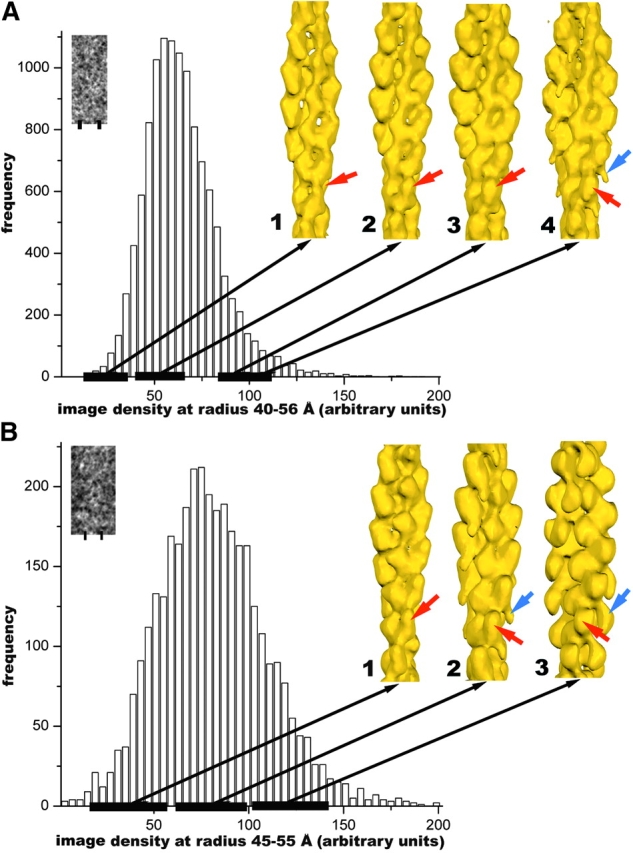
Sorting of images based on projected density. Image segments were initially aligned (shifted in x and y, and rotated in plane) against reference projections of a pure F-actin reconstruction (Orlova et al., 2001). Segments with shifts of >5 pixels, or with rotations from 0° or 180° greater than 10° were discarded. This reduced the 16,070 light segments to 11,698, and reduced the 6,240 dark segments to 3,533. The projected density within columns of pixels corresponding to a particular radial band was then integrated. This radial band was 40–56 Å from the helical axis for the light segments A, and 45–55 Å from the helical axis for the dark segments B. These radial limits were chosen based upon analysis of where the greatest differences occurred from pure F-actin, and these bands are indicated by the bars under the inset images (A and B). The resulting histograms of density within these radial bands are shown for the light segments A and the dark segments B. Images were then sorted into groups based upon this density distribution. Reconstructions are shown for four groups in A: #1, n = 858, density from 11 to 40; #2, n = 4,369, density from 41 to 60; #3, n = 1,396, density from 81 to 100; and #4, n = 694, density from 91 to 110. The red arrows indicate the feature due to the bound ut261 that becomes progressively stronger from #1 to #3. However, in #4, a new feature appears (blue arrow) that is due to the second mode of binding, showing that the segments initially selected as light are predominantly the half-bound complex (Fig. 4), but contain some regions with single decoration. The same approach was done for the dark segments, which have been divided into three groups in (B): #1, n = 767, density from 21 to 60; #2, n = 1,811, density from 61 to 100; #3, n = 721, density from 101 to 140. It can be seen that the dark segments contain both modes of binding, as group #1 can be explained quite well by the half decoration, whereas only group #3 shows the saturated single binding that we interpret (Fig. 6) as CH1 (red arrow) and CH2 (blue arrow).
Figure 4.
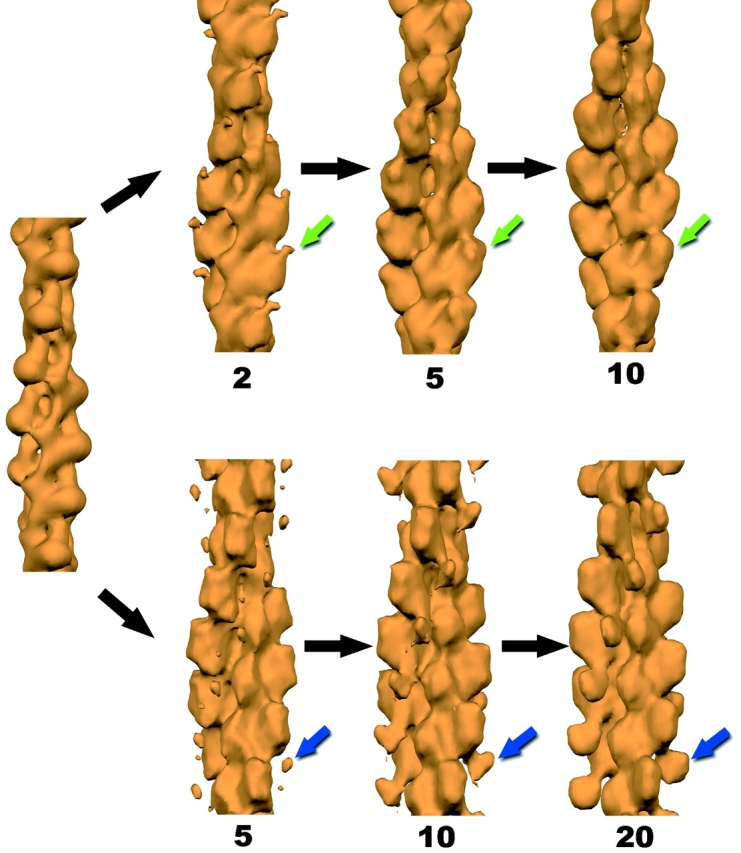
Results of the IHRSR method can be seen for singly decorated (bottom) and half- decorated filament segments (top). An atomic model of F-actin (Holmes et al., 1990) has been filtered to low resolution (left), and this is used as the starting point for subsequent cycles of the procedure. Images of filament segments, each containing about 14 actin subunits, have been sorted based upon both differences in twist and in the binding of ut261 (Figs. 2 and 3). The morphing of the half decorated filaments from the starting actin model (left) during this procedure is shown after 2, 5, and 10 cycles using 1,396 filament segments. The green arrow indicates the single density due to ut261 that emerges. For the 772 segments classified as singly decorated, a stable solution requires more iterations. The results after 5, 10, and 20 cycles are shown. The blue arrow indicates the density that we have interpreted as being due to CH2 (Fig. 6).
An additional complication arises when looking at complexes of F-actin with other proteins, due to the large variability in helical twist within F-actin (Egelman et al., 1982; Galkin et al., 2001). The IHRSR approach is also ideally suited to this problem, and independent reconstructions were generated for segments having actin symmetries from 154° to 174°, and stable solutions were found for mean symmetries of 159°, 162°, 164°, 166°, 168°, 170°, and 172° for the mode that we refer to as half-decoration. For the mode that we refer to as singly decorated, stable reconstructions were generated having mean actin symmetries of 161° and 166°. The most populated symmetry in both cases was that of 166°. Because the reconstructions did not differ significantly as a function of symmetry, only the 166° reconstructions are shown. Because the IHRSR method is based upon iterative convergence to a solution of defined structure and symmetry (Egelman, 2000), the final reconstructions shown are the stable results of many cycles of processing. Concerns about whether selfconsistent solutions are actually circular ones are addressed in Fig. 4, where it is shown that if one starts the IHRSR method using an atomic model of F-actin (Holmes et al., 1990) filtered to low-resolution, resulting structures converge to the half-decorated reconstruction (Fig. 4, top) and the single decorated reconstruction (Fig. 4, bottom) after image segments have been sorted.
In the half-decorated mode (Fig. 5, B and E) there is one compact density added to F-actin for every actin subunit in the filament, and this density (Fig. 5, B and E, black arrows) is located between subdomain 2 of one actin subunit and subdomain 1 of the actin subunit above it on the same long-pitch helical strand. The location of this density is very similar to what has been described for the binding of a fimbrin fragment to F-actin (Hanein et al., 1997, 1998). However, in contrast to that study, in which the density attributable to the fimbrin fragment was much weaker in the reconstruction than that attributable to actin, we see the same peak density levels for both actin and the additional mass due to ut261 (Fig. 5 E). We think that this results from the IHRSR single particle sorting, where a large number of segments (∼40%) containing incomplete or nonhomogeneous binding of ut261 were eliminated.
Figure 5.
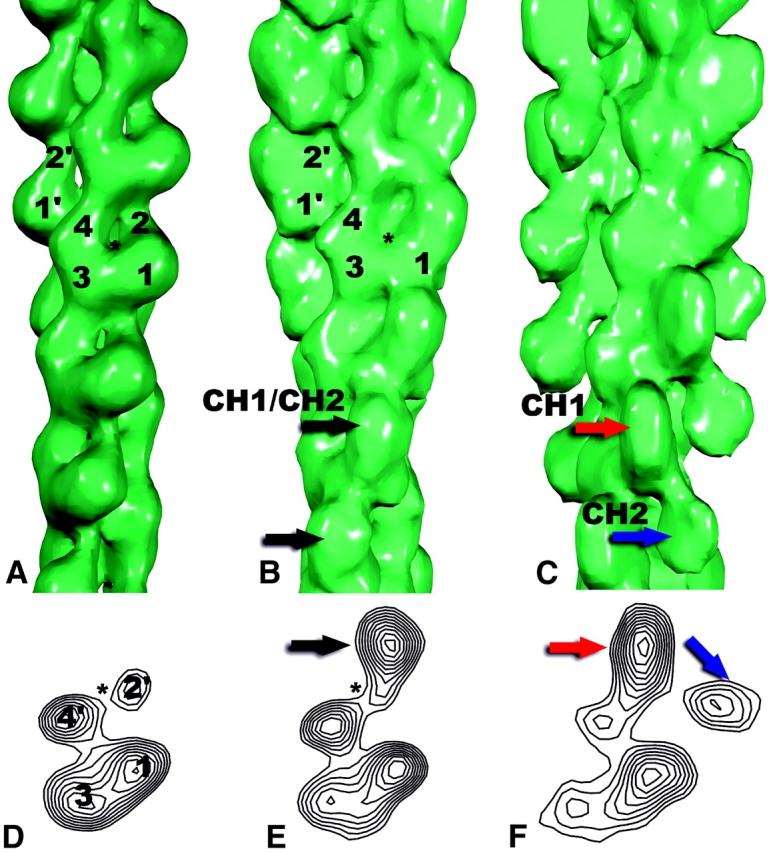
Surfaces (A–C) and cross-sections (D–F) of reconstructions from pure β-actin (A and D), half-decorated filaments (B and E), and singly decorated filaments (C and F). The half decoration corresponds to one utrophin ABD (containing the two CH domains, labeled CH1, and CH2) per two actin subunits, whereas the single decoration corresponds to one utrophin ABD for each actin subunit (Fig. 6). The actin subdomains 1–4 are labeled (A and B), with subdomains 1 and 2 from a different actin subunit labeled as 1′ and 2′. In D, subdomains 2 and 4 come from a subunit on the opposite strand, and are labeled 2′ and 4′, respectively. The nucleotide-binding cleft in the pure β-actin (*), opens up with respect to the structure of the α-actin-ATP subunit (Kabsch et al., 1990) used for the starting model (Fig. 4). In contrast, this cleft appears to be closed in both the half-decorated (B, *) and singly decorated state (C). In the half-decorated mode, the additional mass that is seen associated with each actin subunit is an average of both CH1 and CH2, as only one of these can be bound at each site. The surfaces correspond to 100% of the expected molecular volume for pure actin (A), one ut261 fragment for every two actins (B), and one ut261 for every actin (C).
In the singly decorated mode, there are two additional compact densities per actin subunit (Fig. 5, C and F, red and blue arrows), and these are connected by a single bridge of density (Fig. 5 C). In contrast to the half-decorated mode (Fig. 5, B and E) in which the binding of ut261 only appears to induce a closing of the nucleotide-binding cleft in actin, there are changes in subdomains 3 and 4 and in the C terminus of actin in the singly decorated state (Fig. 5, C and F). Unlike previous EM observations that could be interpreted in terms of a simple rotation of subdomain 2 (Egelman, 2001a), a reasonable understanding of what is happening to actin in this state will require higher resolution studies.
We have used the crystal structure of ut261 (Keep et al., 1999) to interpret both binding modes. The singly decorated state is most readily interpreted since the two masses per actin subunit can be simply fit by the crystal structure, with each CH domain filling a globular additional density in the reconstruction and the α-helical connector in the crystal occupying the bridge region in the reconstruction (Fig. 6 B). However, in order to properly fit the globular domains, a rotation of the CH2 domain by ∼110° away from its position relative to CH1 found in the crystal structure was required (Fig. 6 D). Support for this reorientation comes from the fact that when using only shape as a guide in fitting the ut261 crystal structure into the reconstruction, the proposed actin-binding surfaces in both CH1 and CH2 identified by Keep et al. (Fig. 6 B, yellow ribbon segments) are now oriented facing actin.
Figure 6.
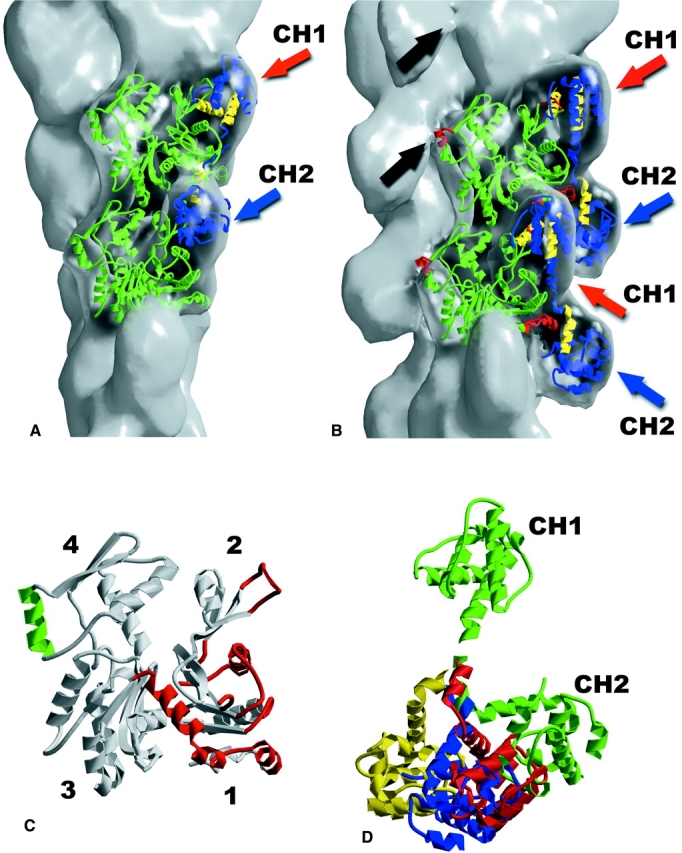
The crystal structure of the utrophin ABD (Keep et al., 1999) can be used to completely explain both modes of binding observed. The half decoration (A) can be fit with one ABD for every two actin subunits along the same long-pitch helical strand. In this mode of binding, there is either a CH1 or CH2 domain bound to every actin subunit, and the density in the reconstruction additional to actin results from an average of both the CH1 and the CH2 domains. The binding in this mode is between subdomain 2 of one subunit and subdomain 1 of the subunit above it on the same long pitch strand. In the single-decoration mode (B), there is one ABD bound to each actin subunit. The actin-binding surfaces of utrophin (Keep et al., 1999) are shown in yellow. In B, three of the inserts in the actin sequence that are not present in bacterial MreB (Egelman, 2001b; van den Ent et al., 2001) are shown in red. These inserts are residues 40–48 (subdomain 2, DNase I-binding loop), 228–235 (subdomain 4), and 353–375 (subdomain 1, C terminus). Each is involved in a contact with the utrophin ABD. The 40–48 and 353–375 inserts appear to be involved in both modes of binding. In contrast, the 228–235 insert makes a contact with the CH2 domain of an ABD, whose CH1 domain is bound to an actin subunit on the opposite strand (black arrows). The surface in B is at 140% of the expected molecular volume to show these contacts, but the model fits extremely well at 100% volume. Steric clashes exist between the DNase I-binding loop of actin's subdomain 2 and CH1 in B, and both CH1 and CH2 in A. An extensive literature on the mobility of this loop (Egelman, 2001a) suggests that it might be repositioned in the complex. The regions in actin that are likely to be involved in contacts with utrophin are shown in either green (223–230) or red (C). Both models for utrophin binding (A and B) involve relative domain shifts between CH1 and CH2 of the utrophin ABD from the crystal structure (Keep et al., 1999). The shifts of the CH2 domains that have been used are shown in D, where the unperturbed crystal structure is in green, the fit to the half-decorated state is in yellow (∼145° rotation from crystal structure), and the fit to the singly decorated state is in blue (∼110° rotation from the crystal structure), after the CH1 domains have been aligned. The magnitude of these shifts is similar to what is observed when the homologous ABD from dystrophin (Norwood et al., 2000), shown in red, is aligned with the CH1 from utrophin.
We find that the half-decorated state can be explained by one ut261 fragment binding to two actin subunits (Fig. 6 A), so that the single additional mass seen per actin subunit is either a CH1 or CH2 domain. In the three-dimensional reconstructions, these two domains will be averaged together, resulting in an identical mass bound to each actin subunit. Attempts were made to reduce the symmetrization of the reconstruction procedure (making the asymmetric repeating unit in the structure four actin subunits rather than one) to see if different densities could be seen for CH1 and CH2, but were unsuccessful. This may be partly due to the fact that at ∼22 Å resolution the CH1 and CH2 domains are similar. More importantly, the binding in this mode may be rather random with respect to the relative phasing of the CH1 and CH2 domains on the two actin long-pitch strands. As with the singly decorated state, a rotation of the CH2 domain by ∼145° from the crystal position was also required to fit the reconstruction. However, a different rotation was needed, as shown in Fig. 6 D. The breaking of regular secondary structure in the linker region between the two compact CH domains seen in the ut261 crystal structure suggested to Keep et al. (1999) that this linker region was flexible and might allow domain reorganization. In fact, a crystal structure of the homologous (72% sequence identity) ABD from dystrophin (Norwood et al., 2000) revealed a large rotation of the two CH domains with respect to each other in comparison with what was seen in the utrophin ABD (Fig. 6 D).
In models for both the single- and half-binding modes, steric clashes exist between the DNase I-binding loop within subdomain 2 of actin and ut261. This loop has been shown to be capable of folding either as a β-strand (Kabsch et al., 1990) or α-helix (Otterbein et al., 2001), and was not even visualized in one crystal structure due to large disorder (McLaughlin et al., 1993). Thus, this loop is quite plastic and could be easily shifted in the actin-ut261 complex. Interestingly, the clash that is observed is entirely a function of which crystal structure of G-actin is used in the model of the complex. The crystal structure of the closed form of β-actin was used (Schutt et al., 1993), as the actin in the filament appears to have a closed nucleotide-binding pocket. However, if the actin structure is replaced by the open state structure of β-actin (Chik et al., 1996), aligning subdomain 1, there is no longer any steric clash at subdomain 2 (unpublished data). However, a clash now appears at the N terminus of actin, which did not exist using the closed actin subunit. We know from spectroscopic and structural studies that actin's N terminus is highly mobile (Orlova et al., 1994; Heintz et al., 1996). Thus, models for the actin-ut261 interaction are quite reasonable with respect to steric clashes when the internal dynamics of actin are taken into consideration. Although it might be possible that very large distortions of both actin and ut261 occur such that similar contacts (with the exception of the subdomain 4 contact involving residues 228–235) are conserved between the two proteins in the two modes of binding, we think this unlikely due to the large distortions that would be needed. However, this question needs to be addressed in future studies.
Alternate explanations were considered for the half binding mode. The simplest is that there is some fraction of the ut261 protein that contains only one CH domain due to proteolysis. This possibility can be eliminated, as SDS-PAGE shows that ut261 runs as a single band (unpublished data). Another possibility is that the binding has the same stoichiometry as in the single decoration, but that the second CH domain is disordered, and therefore not seen in the reconstruction. There are three reasons to reject this possibility. First, such a binding would involve additional mass along the outside of the actin filament, even if this mass was disordered and therefore not seen in the reconstruction. Analysis of the radial density in images shows that such additional mass does not exist in this mode. It can clearly be seen that there is more projected density at high radius in the dark raw images (Fig. 3 B) than in the light raw images (Fig. 3 A). If the binding of the second CH domain was disorderd in the light filaments, it would still contribute to the projected density but not contribute to the reconstructions. In addition, we show that there is a direct correlation between the projected density at high radius and the strength of the second CH domain (Fig. 3, blue arrows).
Second, there is a clear difference in the rigidity of the decorated filaments between the two modes of binding. We have previously shown that modifications to subdomain 2 can introduce large changes in the rigidity of actin filaments (Orlova and Egelman, 1993; Orlova et al., 2001), consistent with the fact that the highest radius inter-subunit contact in the filament involves subdomain 2, and that the flexural rigidity of a filament depends upon the fourth power of the radial mass distribution. The orientation of CH1 with respect to actin is different in the two modes. If the binding of CH1 was the same between the two modes, we would expect to see the same rigidity in both states. In fact, we would expect to see an even greater rigidity in the singly decorated mode, where both CH domains are bound in an ordered manner to F-actin. But we actually see a much greater rigidity in the half-binding mode, consistent with different specific attachments between the two modes of the CH domain located in the cleft between subdomain 2 and subdomain 1 of a subunit above it.
Third, aggregation is seen only in the singly decorated mode, most likely caused by interactions between the CH2 domains on different filaments that are more weakly bound than the CH1 domains. If the binding in the half-decorated state involved a free CH domain dangling from the actin filament, we would expect to see an even greater extent of aggregation in this state.
Discussion
Using a novel approach to three-dimensional reconstruction of helical filaments (Egelman, 2000), we have been able to observe two different modes of binding of the utrophin ABD to F-actin involving two different stoichiometries. The use of this approach has been rather essential, as disorder in binding, the mixing of modes, and the variable twist of F-actin (Egelman et al., 1982) would tend to obscure the three-dimensional structure of these complexes using traditional helical methods of image analysis. A similar application of this method to complexes of actin with ADF was able to discern two different modes of binding of ADF to F-actin (Galkin et al., 2001), also involving two different stoichiometries. The application of the method to complexes of actin with a nebulin fragment has led to the first visualization of the interaction between nebulin and F-actin (Lukoyanova et al., 2002), and this was only possible after most filament segments were discarded during the cycles of image processing due to disorder or incomplete binding. The method has been extensively tested, as applications to protein-DNA filaments active in recombination have also been very successful (Yang et al., 2001a,b; Yu et al., 2001).
In both modes, we observe that the utrophin ABD is bound in an extended conformation, as predicted by the crystallographic study of Keep et al. (1999). A previous EM study of actin complexed with the same ut261 construct also suggested an extended conformation of the two CH domains (Moores et al., 2000). Unfortunately, we find little relation between our interpretation of the additional mass that we see bound to actin and what was presented in that paper. Comparison of our half-decorated reconstruction with their work suggests that the polarity used for their ut261-decorated filament with respect to undecorated actin was upside down. Further, it is likely that the two different modes of binding that we observe were present in their decorated filaments, and these were not separated during the reconstruction procedure.
We have shown that the putative actin-binding surfaces of utrophin (Keep et al., 1999) face actin when the crystal structure is oriented into the EM reconstructions. What can be said about the complementary utrophin-binding surfaces of actin? Fig. 6 C highlights the actin residues that we see involved in the interactions with ut261. Our results are in general agreement with the identification of residues in subdomains 1 and 2 of actin that were suggested to be involved in the binding of fimbrin (Hanein et al., 1998).
Is it possible that the two modes of binding are an artifact due to the fact that only the actin-binding domain of utrophin has been used, and not the intact protein? This cannot be answered unequivocally until structural studies are done with the full-length molecule. Nevertheless, the results show the plasticity in CH domain rearrangements predicted by Keep et al. (1999) based in part upon the comparison between crystal structures of the utrophin, dystrophin (Norwood et al., 2000) and fimbrin (Goldsmith et al., 1997) ABD's. Thus, we think it unlikely that this plasticity will no longer exist in the full-length molecule.
The recent determination of a structure for the bacterial MreB protein showed that it is an actin homologue (van den Ent et al., 2001), and provides a framework for understanding the prokaryotic origin of actin-based motility, the cytoskeleton, and muscle. Interestingly, there are six sequence inserts that appear in all eukaryotic actins that are absent in MreB; five of these appear to be involved in the subunit–subunit contacts that hold F-actin together, and at least three of these are involved in allosteric couplings within actin (Egelman, 2001b). It is noteworthy that many interactions with actin-binding proteins also appear to involve these inserts. We see that residues 40–48, which form the DNase I-binding loop within subdomain 2 and are an insert not present in MreB, are strongly involved in contacts with ut261. The residues 228–235, another insert in the actin sequence not present in MreB, form a helix that protrudes from subdomain 4 (Fig. 6 B, red residues), and this helix is likely to be involved in the interaction with the CH2 domain that is attached to a CH1 domain bound to an actin subunit on the opposite long-pitch helical strand (Fig. 6 B, black arrows). A third insert in actin that is not present in MreB is the C terminus, containing residues 353–375, and this is also involved in contacts with ut261 in both modes of binding. The reconstruction of a complex between F-actin and myosin light chain kinase suggested that residues 228–232 of one subunit and residues 364–375 from a subunit on the opposite long-pitch helical strand were involved in the contact region with myosin light chain kinase (Hatch et al., 2001), and these involve two of the three actin inserts that we see making contact with ut261.
The reconstructions of the two different modes of binding, and the fit of the ut261 crystal structure to these complexes, suggests that the utrophin ABD can make different interactions with actin that involve multiple surfaces on the actin subunit. We have previously shown that ADF can also bind F-actin in two different modes, using multiple nonoverlapping binding surfaces on actin (Galkin et al., 2001). An extensive literature exists about multiple binding positions of tropomyosin to F-actin (Lehman et al., 2000; Craig and Lehman, 2001), and other observations have shown that the weak (in the presence of ATP) and rigor (in the absence of nucleotide) binding of myosin to F-actin must involve different residues in actin (DasGupta and Reisler, 1989, 1991, 1992). The binding of a nebulin fragment to F-actin involves three different sites on actin (Lukoyanova et al., 2002). Thus, a picture emerges that in addition to being able to bind a large number of other proteins, many proteins can bind to multiple sites on actin. This may provide additional insight into the remarkable conservation of actin's sequence and structure over the course of eukaryotic evolution (Egelman, 2001a), as the selective pressure against mutations in actin will grow considerably when multiple interactions become important.
In addition, our results provide new insight into the modular architecture of the CH domains present in a superfamily of actin-binding proteins, and support the notion that a large degree of polymorphism may be present in the binding of these proteins to F-actin due to the ability of these domains to bind in multiple ways.
Materials and methods
Specimen preparation and EM
β-actin was purchased from Cytoskeleton, Inc. Lyophilized powder was dissolved in 10 mM Tris-HCl, pH 7.8, 0.05 mM CaCl2, 1 mM ATP, and clarified by centrifugation in TLX-Beckman centrifuge for 30 min at 75,000 g. G-Ca2+-actin was converted to G-Mg2+-actin by incubation for 6 min at room temperature in the presence of 0.02 mM EGTA and 0.02 mM MgCl2. G-Mg2+-actin was diluted to 5 μM by 10 mM Hepes, pH 7.8, 1 mM ATP, 0.5 mM DTT, and polymerized by the addition of 0.1 M KCl and 1 mM MgCl2. The utrophin ut261 fragment was expressed and purified as previously described (Moores and Kendrick-Jones, 2000). For EM samples, F-Mg2+-β-actin (2 μM) was mixed with ut261 (22 μM), and incubated 30–40 min on ice. Samples (6–7 μl) were applied to carbon-coated grids and negatively stained with 2% (wt/vol) uranyl acetate. A Technai-12 electron microscope was used at an accelerating voltage of 80 kV, at a nominal magnification of 30,000×. Negatives were densitometered with a Leaf 45 scanner, using a raster of 3.9 Å/pixel.
Image processing
Most of the methodology is described in Figs. 2–4, as well as in Galkin et al. (2001). Segments were cut from the light filaments as 40 × 100 pixel boxes, and cut from the dark filaments as 50 × 100 pixel boxes. These were padded to 100 × 100 pixels for most subsequent processing. Two control reconstructions for undecorated F-actin were used. An initial reconstruction was a previously published low-resolution structure of yeast F-actin (Orlova et al., 2001). Because the ut261-actin complexes involved cytoplasmic β-actin, a second control reconstruction of pure β-actin was generated from 6,725 segments. A subset containing 1,490 images of pure β-actin had a final symmetry after 34 IHRSR cycles of 165.8°, and was very similar to the yeast actin reconstruction. The resolution of the reconstructions was determined by generating two independent reconstructions from each data set, and comparing these using either the 0.5 criterion for the Fourier shell correlation or the 3σ criterion (in parentheses). The values found were 27 Å (21 Å) for the pure β-actin, 27 Å (22 Å) for the half-decorated, and 33 Å (23 Å) for the singly decorated. Comparisons with atomic models suggested that all reconstructions had a resolution of ∼22 Å, and that the 3σ criterion provided a more accurate estimate.
Model building
Crystal structures for both the closed- (Schutt et al., 1993) and open-cleft (Chik et al., 1996) conformations of β-actin and of the utrophin ABD (Keep et al., 1999) were used to generate low-resolution surfaces. Dimerization of two ABDs in the crystal resulted in a compact association between the CH1 domain of one monomer and the CH2 domain of the other monomer. This compact structure contains the same CH domain interface seen in the fimbrin crystal structure (Goldsmith et al., 1997). We first attempted to fit both the extended and compact conformations of the utrophin ABD observed in the crystal structure into the reconstructions. Neither provided a good fit to either the half- or singly-decorated reconstruction. The CH1 and CH2 domains of utrophin were then treated independently. Using shape as our primary guide, these surfaces were docked by eye into the EM reconstructions of the half- and singly decorated actin complexes. Transformations used in docking the surfaces were then applied to the atomic structure coordinates, followed by the imposition of helical symmetry to generate filament models. In both the half- and singly decorated models, the G-actin structure with the closed cleft fit better to the three-dimensional reconstructions. However, in the control β-actin reconstruction, the open conformation of the actin subunit provided the best fit. Residues 227–238 and 244–248 in subdomain 4 of actin penetrate the EM surface envelope in the single-decorated map, and subdomain 4 is directly involved in contacts with a utrophin fragment from the opposite strand. In the half-decorated reconstruction, subdomain 4 has no contact with utrophin and these residues lie within the EM surface envelope.
Acknowledgments
We thank Steve Winder (University of Glasgow, Glasgow, Scotland) for the ut261 expression construct.
This work was supported by National Institutes of Health grants AR42023 and AI50372 (E.H. Egelman) and AR42423 (J.M. Ervasti), and by the Muscular Dystrophy Association (I.N. Rybakova).
Footnotes
Abbreviations used in this paper: ABD, actin-binding domain; ADF, actin-depolymerizing factor; CH, calponin homology; IHRSR, iterative helical real space reconstruction.
References
- Chik, J.K., U. Lindberg, and C.E. Schutt. 1996. The structure of an open state of β-actin at 2.65 Ångstrom resolution. J. Mol. Biol. 263:607–623. [DOI] [PubMed] [Google Scholar]
- Craig, R., and W. Lehman. 2001. Crossbridge and tropomyosin positions observed in native, interacting thick and thin filaments. J. Mol. Biol. 311:1027–1036. [DOI] [PubMed] [Google Scholar]
- DasGupta, G., and E. Reisler. 1989. antibody against the amino terminus of α-actin inhibits actomyosin interactions in the presence of ATP. J. Mol. Biol. 207:833–836. [DOI] [PubMed] [Google Scholar]
- DasGupta, G., and E. Reisler. 1991. nucleotide-induced changes in the interaction of myosin subfragment 1 with actin: detection by antibodies against the N-terminal segment of actin. Biochemistry. 30:9961–9966. [DOI] [PubMed] [Google Scholar]
- DasGupta, G., and E. Reisler. 1992. Actomyosin interactions in the presence of ATP and the N-terminal segment of actin. Biochemistry. 31:1836–1841. [DOI] [PubMed] [Google Scholar]
- DeRosier, D.J., and A. Klug. 1968. Reconstruction of three-dimensional structures from electron micrographs. Nature. 217:130–134. [DOI] [PubMed] [Google Scholar]
- Egelman, E.H. 2000. A robust algorithm for the reconstruction of helical filaments using single-particle methods. Ultramicroscopy. 85:225–234. [DOI] [PubMed] [Google Scholar]
- Egelman, E.H. 2001. a. Actin allostery again? Nat. Struct. Biol. 8:735–736. [DOI] [PubMed] [Google Scholar]
- Egelman, E.H. 2001. b. Molecular evolution: actin's long lost relative found. Curr. Biol. 11:R1022–R1024. [DOI] [PubMed] [Google Scholar]
- Egelman, E.H., N. Francis, and D.J. DeRosier. 1982. F-actin is a helix with a random variable twist. Nature. 298:131–135. [DOI] [PubMed] [Google Scholar]
- Galkin, V.E., A. Orlova, N. Lukoyanova, W. Wriggers, and E.H. Egelman. 2001. Actin depolymerizing factor stabilizes an existing state of F-actin and can change the tilt of F-actin subunits. J. Cell Biol. 153:75–86. [DOI] [PMC free article] [PubMed] [Google Scholar]
- Goldsmith, S.C., N. Pokala, W. Shen, A.A. Fedorov, P. Matsudaira, and S.C. Almo. 1997. The structure of an actin-crosslinking domain from human fimbrin. Nat. Struct. Biol. 4:708–712. [DOI] [PubMed] [Google Scholar]
- Hanein, D., P. Matsudaira, and D.J. DeRosier. 1997. Evidence for a conformational change in actin induced by fimbrin (N375) binding. J. Cell Biol. 139:387–396. [DOI] [PMC free article] [PubMed] [Google Scholar]
- Hanein, D., N., Volkmann, S. Goldsmith, A.M. Michon, W. Lehman, R. Craig, D. DeRosier, S. Almo, and P. Matsudaira. 1998. An atomic model of fimbrin binding to F-actin and its implications for filament crosslinking and regulation. Nat. Struct. Biol. 5:787–792. [DOI] [PubMed] [Google Scholar]
- Hatch, V., G. Zhi, L. Smith, J.T. Stull, R. Craig, and W. Lehman. 2001. Myosin light chain kinase binding to a unique site on F-actin revealed by three-dimensional image reconstruction. J. Cell Biol. 154:611–617. [DOI] [PMC free article] [PubMed] [Google Scholar]
- Heintz, D., H. Kany, and H.R. Kalbitzer. 1996. Mobility of the N-terminal segment of rabbit skeletal muscle F-actin detected by 1H and 19F nuclear magnetic resonance spectroscopy. Biochemistry. 35:12686–12693. [DOI] [PubMed] [Google Scholar]
- Holmes, K.C., D. Popp, W. Gebhard, and W. Kabsch. 1990. Atomic model of the actin filament. Nature. 347:44–49. [DOI] [PubMed] [Google Scholar]
- Kabsch, W., H.G. Mannherz, D. Suck, E.F. Pai, and K.C. Holmes. 1990. Atomic structure of the actin:DNase I complex. Nature. 347:37–44. [DOI] [PubMed] [Google Scholar]
- Keep, N.H., S.J. Winder, C.A. Moores, S. Walke, F.L. Norwood, and J. Kendrick-Jones. 1999. Crystal structure of the actin-binding region of utrophin reveals a head-to-tail dimer. Struct. Fold. Des. 7:1539–1546. [DOI] [PubMed] [Google Scholar]
- Lehman, W., V. Hatch, V. Korman, M. Rosol, L. Thomas, R. Maytum, M.A. Geeves, J.E. Van Eyk, L.S. Tobacman, and R. Craig. 2000. Tropomyosin and actin isoforms modulate the localization of tropomyosin strands on actin filaments. J. Mol. Biol. 302:593–606. [DOI] [PubMed] [Google Scholar]
- Lukoyanova, N., M.S. VanLoock, A. Orlova, V.E. Galkin, K. Wang, and E.H. Egelman. 2002. Each actin subunit has three nebulin-binding sites: implications for steric blocking. Curr. Biol. 12:383–388. [DOI] [PubMed] [Google Scholar]
- McLaughlin, P.J., J.T. Gooch, H.G. Mannherz, and A.G. Weeds. 1993. Structure of gelsolin segment 1-actin complex and the mechanism of filament severing. Nature. 364:685–692. [DOI] [PubMed] [Google Scholar]
- Moores, C.A., and J. Kendrick-Jones. 2000. Biochemical characterisation of the actin-binding properties of utrophin. Cell Motil. Cytoskel. 46:116–128. [DOI] [PubMed] [Google Scholar]
- Moores, C.A., N.H. Keep, and J. Kendrick-Jones. 2000. Structure of the utrophin actin-binding domain bound to F-actin reveals binding by an induced fit mechanism. J. Mol. Biol. 297:465–480. [DOI] [PubMed] [Google Scholar]
- Norwood, F.L., A.J. Sutherland-Smith, N.H. Keep, and J. Kendrick-Jones. 2000. The structure of the N-terminal actin-binding domain of human dystrophin and how mutations in this domain may cause Duchenne or Becker muscular dystrophy. Struct. Fold. Des. 8:481–491. [DOI] [PubMed] [Google Scholar]
- Orlova, A., and E.H. Egelman. 1993. A conformational change in the actin subunit can change the flexibility of the actin filament. J. Mol. Biol. 232:334–341. [DOI] [PubMed] [Google Scholar]
- Orlova, A., X. Yu, and E.H. Egelman. 1994. Three-dimensional reconstruction of a co-complex of F-actin with antibody Fab fragments to actin's amino-terminus. Biophys. J. 66:276–285. [DOI] [PMC free article] [PubMed] [Google Scholar]
- Orlova, A., V.E. Galkin, M.S. VanLoock, E. Kim, A. Shvetsov, E. Reisler, and E.H. Egelman. 2001. Probing the structure of f-actin: cross-links constrain atomic models and modify actin dynamics. J. Mol. Biol. 312:95–106. [DOI] [PubMed] [Google Scholar]
- Otterbein, L.R., P. Graceffa, and R. Dominguez. 2001. The crystal structure of uncomplexed actin in the ADP state. Science. 293:708–711. [DOI] [PubMed] [Google Scholar]
- Schutt, C.E., J.C. Myslik, M.D. Rozycki, N.C.W. Goonesekere, and U. Lindberg. 1993. The structure of crystalline profilin:β-actin. Nature. 365:810–816. [DOI] [PubMed] [Google Scholar]
- Tinsley, J., N. Deconinck, R. Fisher, D. Kahn, S. Phelps, J.M. Gillis, and K. Davies. 1998. Expression of full-length utrophin prevents muscular dystrophy in mdx mice. Nat. Med. 4:1441–1444. [DOI] [PubMed] [Google Scholar]
- van den Ent, F., L.A. Amos, and J. Lowe. 2001. Prokaryotic origin of the actin cytoskeleton. Nature. 413:39–44. [DOI] [PubMed] [Google Scholar]
- Winder, S.J. 1996. Structure-function relationships in dystrophin and utrophin. Biochem. Soc. Trans. 24:497–501. [DOI] [PubMed] [Google Scholar]
- Winder, S.J., L. Hemmings, S.K. Maciver, S.J. Bolton, J.M. Tinsley, K.E. Davies, D.R. Critchley, and J. Kendrick-Jones. 1995. Utrophin actin binding domain: analysis of actin binding and cellular targeting. J. Cell Sci. 108:63–71. [DOI] [PubMed] [Google Scholar]
- Yang, S., M.S. VanLoock, X. Yu, and E.H. Egelman. 2001. a. comparison of bacteriophage T4 UvsX and human Rad51 filaments suggests that RecA-like polymers may have evolved independently. J. Mol. Biol. 312:999–1009. [DOI] [PubMed] [Google Scholar]
- Yang, S., X. Yu, E.M. Seitz, S. C. Kowalczykowski, and E.H. Egelman. 2001. b. Archaeal RadA protein binds DNA as both helical filaments and octameric rings. J. Mol. Biol. 314:1077–1085. [DOI] [PubMed] [Google Scholar]
- Yu, X., S.A. Jacobs, S.C. West, T. Ogawa, and E.H. Egelman. 2001. Domain structure and dynamics in the helical filaments formed by RecA and Rad51 on DNA. Proc. Natl. Acad. Sci. USA. 98:8419–8424. [DOI] [PMC free article] [PubMed] [Google Scholar]
- Zuellig, R.A., B.C. Bornhauser, I. Knuesel, F. Heller, J.M. Fritschy, and M.C. Schaub. 2000. Identification and characterisation of transcript and protein of a new short N-terminal utrophin isoform. J. Cell. Biochem. 77:418–431. [DOI] [PubMed] [Google Scholar]