

Abstract
Objective:
To determine if a supplement of soy protein improves body composition, body fat distribution, and glucose and insulin metabolism in non-diabetic postmenopausal women compared to an isocaloric casein placebo.
Design:
Randomized, double-blind, placebo-controlled 3-month trial
Setting:
Clinical Research Center
Patients:
15 postmenopausal women
Interventions:
CT scans at L4/L5, dual energy x-ray absorptiometry (DXA), hyperglycemic clamps
Main outcome measures:
Total fat, total abdominal fat, visceral fat, subcutaneous abdominal fat, and insulin secretion.
Results:
Weight by DXA did not change between groups (+1.38 ± 2.02 kg for placebo vs. +0.756 ± 1.32 kg for soy, p=0.48, means ± S.D.). Total and subcutaneous abdominal fat increased more in the placebo compared to the soy group (for differences between groups in total abdominal fat: +38.62 ± 22.84 cm2 for placebo vs. −11.86 ± 31.48 cm2 for soy, p=0.005; subcutaneous abdominal fat: +22.91 ± 28.58 cm2 for placebo vs. −14.73 ± 22.26 cm2 for soy, p=0.013). Insulin secretion, visceral fat, total body fat, and lean mass did not differ between groups. Isoflavone levels increased more in the soy group.
Conclusion:
A daily supplement of soy protein prevents the increase in subcutaneous and total abdominal fat observed with an isocaloric casein placebo in postmenopausal women.
Keywords: soy, isoflavones, menopause, body composition, insulin secretion
Introduction
Total and central body fat increase after menopause (1, 2, 3), while glucoregulation, including insulin secretion and insulin sensitivity, has been found to be impaired in some studies (4,5) but not others (6). Presently, options for reducing total and central body fat and improving glucoregulation after menopause in women is limited to traditional pharmacologic and lifestyle interventions.
Soy is a biologically active plant composed of soy protein plus several bioactive components: isoflavones (with structures similar to 17β-estradiol -- genistein, daidzein, glycitein), peptides, globulins, saponins, phytic acid, and protease inhibitors (7). The isoflavone component binds both to the traditional estrogen receptor alpha (ERα) and to the more recently described estrogen receptor beta (ERβ), with higher affinity for ERβ (8). Both ERα and ERβ are present in adipose tissue (9, 10), and ERα is present in skeletal muscle (11). Atypical receptors for estradiol have also been demonstrated on pancreatic islet cell membranes (12). Thus, isoflavones could participate in the regulation of adiposity and glucose metabolism via estrogen receptor-dependent mechanisms.
The effect of soy on body composition and body fat distribution is not well understood. In a cross-sectional study of postmenopausal women, those who consumed a high soy diet had a lower body mass index (BMI) and waist circumference compared to those who consumed no soy (13). In a randomized trial of soy protein in perimenopausal women, soy protein did not affect total body fat or lean mass based on DXA methodology (14). No randomized trials have reported the effect of soy protein on visceral and subcutaneous abdominal fat in humans. Effects on abdominal fat, particularly visceral fat, are particularly important because of their strong relationship to diabetes and cardiovascular disease (15).
Evidence from both animal and human studies also supports a favorable effect of soy protein or its bioactive components on glucoregulation. In ovariectomized monkeys, a diet containing soy proteins with isoflavones improves insulin sensitivity and glucose effectiveness compared to a diet containing casein/lactalbumin protein (16). In rats, plasma insulin concentrations during glucose tolerance tests are lower in soybean-fed animals (17). In mouse pancreatic islet cells, genistein acutely stimulates insulin secretion through a cAMP-dependent protein kinase pathway (18).
In cross-sectional (13) and cross-over trials (19) in postmenopausal women, there was a trend toward lower fasting insulin on high soy diets. In a trial of diabetic postmenopausal women, a soy protein supplement improved hemoglobin A1c, fasting insulin, and insulin resistance determined by HOMA-IR (20). We are unaware of any studies that have used euglycemic or hyperglycemic clamps to investigate the effect of soy on insulin sensitivity or insulin secretion in postmenopausal women without diabetes.
We hypothesized that increasing daily soy protein intake would reduce central abdominal fat and improve insulin secretion in postmenopausal women compared to an isocaloric placebo of casein protein.
Materials and Methods
Subjects and Shake Supplements
Eighteen postmenopausal women from the Burlington, Vermont region were randomized by block design to either to a daily shake containing soy (20 g soy protein + 160 mg isoflavones), versus a daily isocaloric casein placebo shake (both donated by Revival Soy, Kernersville, NC). Women were 55.6 ± 5.4 years of age, with a BMI of 30.5 ± 3.1 kg (means ± S.D.'s). All women were required to be without menses for the last 12 months to 5 years, with an FSH > 30 mIU/ml. Only 4 women in the study reported ever taking hormone replacement therapy (HRT)—3 in the soy group and 1 in the placebo group. The last time HRT was used by those who reported past HRT use in the soy group was 1, 2, and 5 years prior to the study; for the volunteer on placebo, progesterone skin cream was used 3 months previously. No volunteers reported ever taking selective estrogen receptor modulators (SERM's).
Volunteers were excluded if they had a surgically induced menopause, were on a strict vegetarian diet, high fiber, high soy, or low fat diets (based on standardized, short dietary screening questionnaires). Other exclusion criteria included regular consumption of vitamin and mineral supplementation greater than the RDA, regular participation in an exercise program (more than twice weekly), cigarette smoking, current HRT or SERM use, weight change of more than 10 lbs. within the last year, known allergy to casein/milk or to soy protein, moderate alcohol consumption (> 2 drinks/day), or known estrogen-dependent neoplasia. Furthermore, no subject had diabetes mellitus at screening based on a 75 gram 2-hour oral glucose tolerance test.
Fifteen postmenopausal women (N=9 on soy and N=6 on placebo), aged 55.6 ± 1.4 years with a BMI of 30.5 ± 0.8 kg/m2 (means ± S.E.M.), completed the 3-month study and were analyzed. The three women who dropped out of the study were all randomized to placebo; reasons given for dropping out were as follows: upset stomach with shakes, did not like the taste of shakes, and poor IV access during the first clamp. Composition of soy shakes was as follows: 120 calories, 2.5 g fat, 7 g carbohydrates, 20 g soy protein, 600 mg calcium, 500 mg phosphorus, 320 mg sodium, 560 mg potassium, 3 mg iron, 160 mg isoflavones (96 mg available as aglycones). Placebo shakes were isocaloric, but instead contained 20 g casein protein and no isoflavones. Volunteers were instructed to mix the powdered shakes with water in the morning and consume half with breakfast and the other half with supper. Subjects were instructed by the GCRC dietician to substitute the soy supplement for other items in their regular diet in order to maintain body weight during the 3 month trial. All volunteers returned at 2 weeks after randomization to soy or placebo shakes for a weight check; if their weight differed by more than 2.3 kg from their original weight, they were counseled further by the dietician on weight maintenance for the study.
This study was approved by the IRB and the GCRC at The University of Vermont, and all subjects gave their consent to participate.
Insulin secretion and insulin-stimulated glucose disposal
We performed hyperglycemic clamps according to the methods of DeFronzo et al (21). After three days of standardized meals (55% carbohydrate, 30% fat, 15% protein), volunteers were tested after a 12-hour overnight fast. An intravenous catheter was placed in an antecubital vein for the infusion of 20% dextrose. A second catheter was placed in the volunteer's contralateral hand and kept in a hot box (60 C) for sampling of arterialized blood samples. At 0700, a primed, constant infusion of [6,6-2H2] glucose (prime: 16.5 μmol/kg; infusion 18.3 μmol/kg/h) was started (time 0 min). Blood samples were taken at 90, 100, 110, and 120 min for measurement of glucose concentrations and enrichment, and at 120 min for insulin levels. At 120 min, a variable rate priming dose of 20% dextrose was started (240 mg/kg; 15 min duration) followed by a variable rate infusion of 20% dextrose. The dextrose infusion raised plasma glucose levels 125 mg/dL above baseline levels. Blood samples were drawn every 2 minutes from 120 to 136 min for the measurement of plasma glucose, C-peptide, and insulin levels (1st phase insulin response), and every 5 min from 140 to 240 min for glucose, and every 15 min for C-peptide and insulin levels (2nd phase response).
The average glucose infusion rate from 210 to 240 min was calculated as an estimate of tissue glucose uptake (M). The average glucose infusion rate was divided by the average insulin level over the same time period as an estimate of insulin sensitivity (M/I). The rate of appearance of glucose, an index of endogenous glucose production, was calculated according to our previous work (22). The rate of total insulin-stimulated glucose disposal corresponds to the removal of glucose from two sources: the mean dextrose infusion used to maintain hyperglycemia during the last 30 minutes of the clamp (milligrams per minute), and the residual endogenous glucose production. Total glucose disposal was calculated as the sum of peripheral glucose disposal plus endogenous glucose production.
Insulin secretion rates were estimated from peripheral plasma C-peptide levels by deconvolution analysis and linear regularization using a two-compartment model with standard parameters for C-peptide kinetics (23, 24). C-peptide kinetics was assumed to be biexponential, and the exponential parameters were taken to be equal to the mean values, as validated previously (23).
Body composition
Fat mass, percent fat, and fat-free mass were measured by dual-photon x-ray absorptiometry (DXA) using a Lunar DPX-L densitometer (Lunar Corp., Madison, WI) as reported previously (3, 22). Scans were analyzed using the Lunar version 1.3 DPX-L extended analysis program for body composition. The coefficient of variation for repeated measurements in our laboratory is 1% for fat mass.
Computed tomography (CT)
Visceral fat, subcutaneous abdominal fat, and total abdominal fat were measured by CT scan at the L4/L5 vertebral disk space at an attenuation range of −190 to −30 Hounsfield units, and analyzed offline using NIHimage software. Within-subject variation for repeated analysis of fat measurements is less than 1% (22).
Biochemical analysis
Plasma glucose concentrations were measured by the glucose oxidase method with an automated glucose analyzer (YSI instruments, Yellow Springs, OH). Serum insulin concentrations were determined with a double-antibody RIA (Diagnostic Products Corp., Los Angeles, CA). C-peptide was measured by RIA (Linco Research, St. Charles, MO). Inter- and intraassay coefficients of variation for insulin were 10% and 4% respectively, and for C-peptide were 9.1% and 4.6% respectively.
Serum isoflavones
Serum isoflavones (genistein, daidzein, glycitein, dihydrodaidzein, O-desmethylangiolensin, equol) were measured by LC-multiple reaction ion monitoring-mass spectrometry as previously described (25). The internal standards, phenolphthalein βglucuronide, 4-methylumbelliferone sulfate and chrysin, were added to each serum sample. Sera (200 μl) were treated with β-glucuronidase/sulfatase to release isoflavones as their aglucones. The latter were extracted into ether and after evaporation to dryness were dissolved in 100 μl of 80% aqueous methanol. Aliquots (5-10 μl) were analyzed by HPLC on a 15 cm × 2.1 mm i.d. C8 reverse-phase column. The column was equilibrated with 10% acetonitrile in 10 mM ammonium acetate. The isoflavones were eluted with a linear gradient of acetonitrile (10-55% at 3%/min) in 10 mM acetonitrile. The column eluate was passed into the heated nebulizer chemical ionization interface of an ABI-Sciex (Foster City, CA) 4000 Qtrap mass spectrometer. The interface was operated in the negative ion mode. Parent negatively charged molecular ions were individually selected and collided with argon gas. Selected fragment ions for each isoflavone were used for specific and quantitative measurements using a multiple reaction ion monitoring-mass spectrometry approach.
All sera were independently analyzed in duplicate. Positive and negative control sera were analyzed with the unknowns. Areas of the isoflavone peaks were normalized by ratio to the chrysin internal standard and were compared to normalized areas for isoflavone standards (1nM – 50 μM). The lower limit of quantitation (LOQ) using our current methodologies is at a signal-to-noise ratio of 10:1 (1-5 nM). Interassay coefficients of variation are <30% at LOQ. At the concentrations observed in the soy consuming subjects in this study, the intra assay coefficients of variation were 3-10%.
Statistical analysis
Means and standard deviations at baseline and at 3 months, and the differences between means over time, were compared between soy and placebo groups for all outcome variables. When the distribution of variables was normal, two-tailed paired and unpaired Student's t-tests were used to compare within group and between group differences. When the distribution of variables did not fit the assumption of normality, the Wilcoxon Rank Sum test was used. Significance was accepted with p<0.05.
Results
Demographic characteristics of study volunteers at baseline are shown in Table 1. Soy and placebo groups were not significantly different with regard to any baseline variable. Clamp parameters and body composition of study participants are shown in Table 2. There were no significant differences between groups with regard to any baseline variable.
Table 1.
Baseline Characteristics of Study Participants
| Soy Group | Placebo Group | ||
|---|---|---|---|
| Characteristic | (N=9) | (N=6) | P |
| Age (yrs) | 55.0 ± 5.4 | 57.8 ± 4.3 | 0.3174 |
| BMI (kg/m2) | 30.8 ± 2.9 | 29.9 ± 3.4 | 0.5938 |
| Weight (kg) | 80.6 ± 6.9 | 80.4 ± 16.8 | 0.9758 |
| Fasting glucose (mg/dl) | 84.7 ± 4.7 | 83.0 ± 4.7 | 0.5361 |
| Fasting insulin (μU/ml) | 17.6 ± 3.1 | 15.3 ± 2.4 | 0.7972 |
Data are presented as means ± S.D. There were no significant differences between groups.
Table 2.
Clamp and Body Composition Variables at Baseline
| Soy Group | Placebo Group | ||
|---|---|---|---|
| Characteristic | (N=9) | (N=6) | P |
| 1st phase insulin secretion AUC (pmol/min) |
10,488± 3,434 | 7,742±718 | 0.0965 |
| 2nd phase insulin secretion AUC (pmol/min) |
137,983 ± 44,738 | 119,106 ± 34,124 | 0.6182 |
| Peripheral glucose disposal (mg/min) |
588.6± 326.4 | 452.8± 121.8 | 0.3945 |
| Endogenous glucose production (mg/min) |
145.9± 25.4 | 134.0 ± 22.6 | 0.4010 |
| Total glucose disposal (mg/min) |
734.6± 348 | 579.8 ± 119.4 | 0.7972 |
| Peripheral glucose disposal / insulin (mg/min/μU/ml) |
5.30± 2.58 | 5.09 ± 1.10 | 0.8643 |
| Visceral fat (cm2) | 157.1± 58.8 | 131.9 ± 32.4 | 0.3596 |
| Subcutaneous abd fat (cm2) | 430.0 ± 68.8 | 385.3 ± 126.9 | 0.3895 |
| Total abd fat (cm2) | 587.1± 112.6 | 517.2 ± 152.3 | 0.3238 |
| Total body fat (kg) | 35.3 ± 6.1 | 35.2 ± 35.2 ± 9.1 | 0.9653 |
| Lean mass (kg) | 43.0 ± 2.8 | 42.5 ± 8.3 | 0.9099 |
Data are presented as means ± S.D. There were no significant differences between groups. AUC=area under the curve. Total glucose disposal = peripheral glucose disposal + endogenous glucose production.
Changes in body composition, body fat distribution, and BMI with soy versus placebo are shown in Figure 1. Total fat and lean mass as measured by DXA increased insignificantly with both placebo and soy treatments (for differences between groups: p=0.3466 for total fat, and p=0.7161 for lean mass) (Fig. 1A). Although BMI or weight did not change significantly between groups (for weight: +1.38 ± 2.02 kg for placebo vs. +0.756 ± 1.42 kg for soy, p=0.48, means ± S.D.), total abdominal fat and subcutaneous abdominal fat as measured by CT scan increased in the placebo group compared to a decrease in the soy group (for differences between groups: p=0.005 for total abdominal fat and p=0.013 for subcutaneous abdominal fat.) (Fig 1B). The differences in fat changes between groups were not due simply to an increase in abdominal fat in the placebo group, since there was a trend toward an absolute decrease in subcutaneous abdominal fat within the soy group (For differences within soy group: −14.73 ± 22.26 cm2 for subcutaneous abdominal fat, p= 0.0825; −11.86 ± 31.48 cm2 for total abdominal fat, p=0.2912). Visceral fat increased 5-fold more in the placebo group than in the soy group, but this difference between groups was not significant (+15.71 ± 17.85 cm2 in the placebo group vs. +2.87 ± 16.56 cm2 in the soy group, p=0.177).
Figure 1.
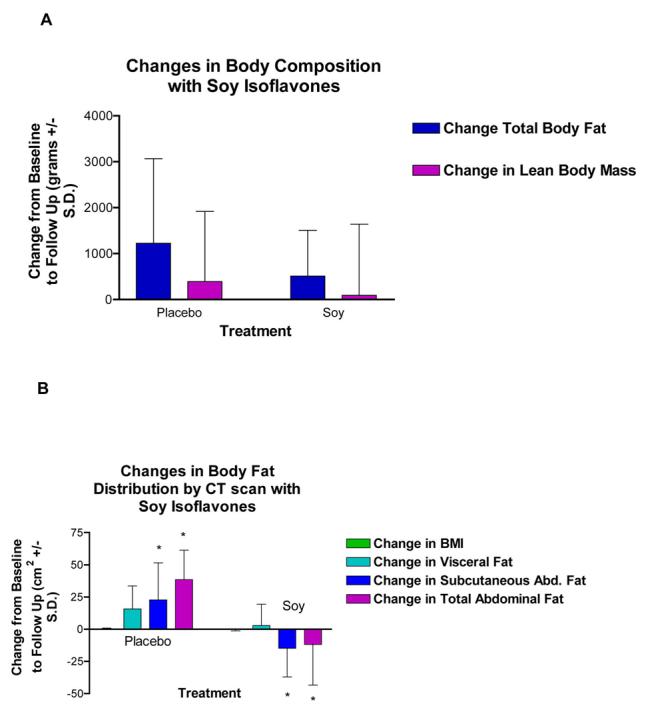
Effect of soy isoflavones on body composition and body fat distribution in women randomized to placebo or soy isoflavones. Values are means ± S.D. A) There were no differences between placebo and soy isoflavones in changes in total body fat or lean body mass as measured by DXA. B) Soy isoflavones prevented the gain in subcutaneous abdominal fat and total abdominal fat compared to an increase with placebo as measured by CT scan (differences between groups based on unpaired t-test, p=0.013 for subcutaneous abdominal fat and p=0.005 for total abdominal fat). There were no differences between groups in BMI or in visceral fat.
Total abdominal fat and subcutaneous abdominal fat changes were covaried for insignificant increases in total body fat, and differences between groups remained significant (p=0.008 for total abdominal fat and p=0.023 for subcutaneous abdominal fat). When visceral fat differences were covaried for insignificant increases in total body fat, visceral fat differences between groups approached significance (+17.6 cm2 difference between groups, p=0.053).
The effect of soy on insulin secretion is shown in Figure 2. Insulin secretion did not change during the study in the soy group (first or second phase insulin secretion) (Fig. 2A). In the placebo group, second phase insulin secretion increased insignificantly by 14% over time (p=0.5146) (Fig. 2B); there was no difference between groups over time in either first or second phase insulin secretion area under the curve (AUC) (p=0.5693 for first phase, p=0.5258 for second phase), (Fig. 2C).
Figure 2.

Effect of soy isoflavones and placebo on insulin secretion. Values are means ± S.D. A, B) There were no differences within groups in first or second phase insulin secretion with soy isoflavones or with placebo (differences within groups based on paired t-test). C) There were no differences between groups in the area under the curve (AUC) in pmol/min for first or second phase insulin secretion (differences between groups based on unpaired t-test).
There was no effect of soy compared to placebo on estimates of peripheral insulin sensitivity as measured in mg/min during the last 30 minutes of the clamp (M), when adjusted for circulating insulin levels (M/I), or when adjusted for kg lean mass (M/kg), (for M: +15.0 ± 165 for placebo and +131.2 ± 228 mg per min for soy, p=0.3388 for differences between groups; for M/I: −0.134 ± 0.80 for placebo and 0.9622 ± 2.14 for soy, p=0.2985 for differences between groups; for M/kg lean mass: 0.582 ± 4.53 mg/min/kg for placebo vs. 3.25 ± 5.59 mg/min/kg for soy, p=0.3816). In addition, changes in fasting insulin (−1.1 ±1.6 for soy vs. 1.9 ± 2.0 for placebo, p=0.2872) and fasting glucose (−0.33±0.97 for soy vs. 1.80 ± 2.6 for placebo, p=0.6993) did not differ between groups. Similarly, there were no differences between groups in suppression of endogenous glucose production by hyperinsulinemia during the clamp, as determined by stable isotope methodology (changes in endogenous glucose disposal: −0.80 ± 39.8 mg/min for placebo and +6.889 ± 40.35 mg/min for soy, p=0.7372).
Serum isoflavone levels at baseline were not different between groups (Fig. 3A). Isoflavone levels increased more in the soy isoflavone group compared to the placebo group during the study (p=0.01 for genistein, p=0.004 for daidzein, p=0.005 for glycitein, p=0.002 for dihydrodaidzein, p=0.03 for O-desmethylangiolensin; all differences between groups), (Figure 3B). There were no differences between groups in equol level changes (p=0.17).
Figure 3.
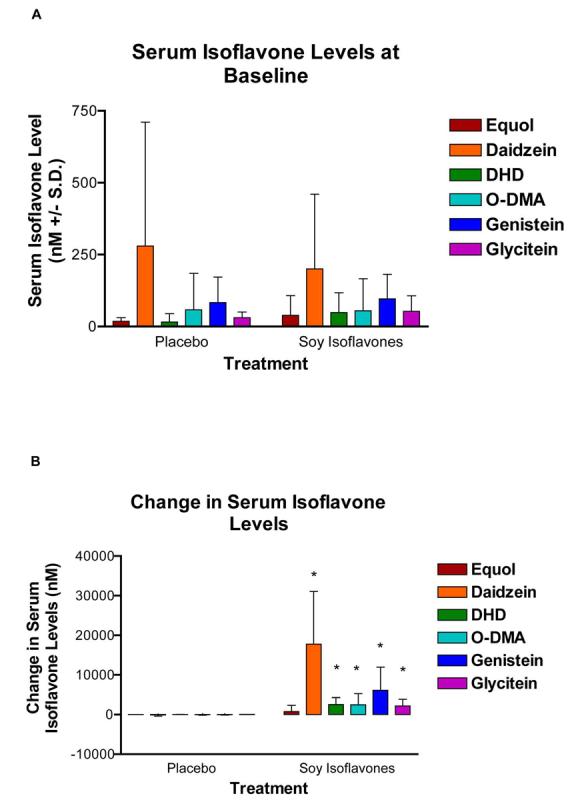
Serum isoflavone levels at baseline and changes with placebo versus soy isoflavones. Values are means ± S.D. A) There were no differences in serum isoflavone levels between groups at baseline. B) There were significant increases during the study in daidzein (p=0.004), dihydrodaidzein (DHD, p=0.002), O-desmethylangiolensin (O-DMA, p=0.03), genistein (p=0.01), glycitein (p=0.005), (differences between groups based on unpaired t-tests). There were no differences between groups in equol levels (p=0.17).
Discussion
We report that a daily supplement of soy protein reduces the gain in total abdominal fat and subcutaneous abdominal fat compared to a daily isocaloric casein placebo in postmenopausal women. This reduction in the gain in abdominal fat by soy compared to placebo occurs despite similar changes in weight and total body fat between groups, and persists after statistical adjustment for insignificant increases in total body fat. A trend toward a decrease in subcutaneous fat within the soy group during the study, and the fact that adjustment for small increases in total fat between groups does not change the ability of soy to prevent the increase in abdominal fat, suggests that the supplement may have a particular effect on subcutaneous abdominal adiposity. To the best of our knowledge, this is the first report of an effect of soy isoflavones on abdominal body fat distribution in humans.
Current information regarding the effect of soy on body composition and body fat distribution is very limited. In a cross-sectional study of postmenopausal women, those who consumed a diet high in soy were found to have a lower body mass index and waist circumference than those who consumed none (13). To our knowledge, only two randomized placebo-controlled trials of soy on body composition have been performed in perimenopausal or postmenopausal women, both reporting that soy did not affect BMI (14, 26), consistent with our findings.
Moeller and colleagues employed DXA to measure body composition and body fat distribution, concluding that soy protein containing isoflavones did not affect body mass, total body fat, lean mass, or estimates of “waist fat” in perimenopausal women compared to a 500 kcal whey protein group or to an isoflavone-poor soy protein group (14). DXA is highly reproducible and is the gold standard for measuring body composition (total fat and lean mass), and we report similar findings of soy on total body fat and lean mass with DXA as did Moeller and colleagues (14). However, CT scans were not performed in this study, so abdominal fat compartments could not be examined. Furthermore, perimenopausal women in this study were younger (mean age 50.6 years), thinner (mean BMI of 24 kg/m2), with serum estradiol levels up to 202 ng/ml, and may respond differently than postmenopausal women in our study with mean age of 55.6 years and BMI of 30.5 kg/m2. Soy may not improve adiposity in an already lean population.
Perhaps most importantly, differences in the type of soy supplement may explain variability among studies. Moeller and colleagues employed a once daily supplement of 80.4 mg aglycone equivalents plus a separate supplement of 20 g of soy or whey powder. Urinary measurement of genistein and daidzein were performed by HPLC and reported as total urinary isoflavones, which increased by 25-fold at 12 weeks. Our supplement, which is produced from soy protein isolate and soy germ rather than from whole soybeans, produced a marked increase in 5 different serum isoflavone levels during the same time period, including a 90-fold increase in daidzein, a 65-fold increase in genistein, and a 42-fold increase in glycitein. Thus, our supplement may not be comparable to other supplements.
Kok and colleagues reported waist-to-hip ratio as an estimate of central body fat, concluding that soy isoflavones did not affect the waist-to-hip ratio in a randomized trial of older postmenopausal women, aged 60-75 years (26). Waist-to-hip ratio is a rough estimate of central body fat distribution. The use of CT scan to measure total abdominal fat, subcutaneous abdominal fat, and visceral fat in our study allowed us to assess directly the effect of soy isoflavones on visceral and subcutaneous fat in postmenopausal women.
The mechanism for the effect of isoflavones on adipose tissue is not well understood. In mice, genistein decreased parametrial and inguinal adipose tissue weight, adipocyte circumference, and decreased lipoprotein lipase mRNA, which may be beneficial toward reducing lipid accumulation in adipocytes (27). Specifically, genistein decreased fat pad weights by 37-57% in juvenile and adult ovariectomized animals in a dose-dependent manner compared to controls in this study (27). This effect was specific for these fat depots, and did not involve differences in muscle weight, body weight, or in food consumption, suggesting that this effect is not due to a generalized effect of genistein on energy balance. The effect of isoflavones on adipocytes may occur via regulation of genes controlling lipid accumulation, such as lipoprotein lipase (28), or may be through repression of adipocyte differentiation (29). Whatever the mechanism, our data suggest that soy protein containing isoflavones may prevent the accumulation of fat in the abdominal depot.
Our study reports a significant effect of soy on total abdominal fat and subcutaneous abdominal fat. Although a 5-fold reduction in visceral fat gain with soy compared to placebo was noted, this did not reach significance. After adjusting for total body fat, however, there was a strong trend toward an effect of soy to prevent visceral fat accumulation (p=0.053). A strong trend toward reducing visceral fat gain by soy may have implications in the prevention of insulin resistance and cardiovascular disease. The greater effect on subcutaneous versus visceral fat partly may be explained by the greater absolute amount of subcutaneous fat, and the fact that total abdominal fat is the summation of subcutaneous and visceral abdominal fat. However, Anwar and colleagues report differential regulation of ERα and ERβ in subcutaneous and visceral fat of postmenopausal women (10). Specifically, estradiol stimulation increased ERβ expression but decreased ERα expression in subcutaneous adipocytes but not in visceral adipocytes in vitro (10). Thus, isoflavones in soy that stimulate primarily ERβ may have a greater response on subcutaneous compared to visceral adipocytes.
We did not find an effect of the soy supplement on first or second phase insulin secretion with hyperglycemic clamp studies. A reduced first and/or second phase insulin response to sustained hyperglycemia has been reported in those with beta cell dysfunction and family histories of diabetes mellitus (30). In non-diabetic Caucasian men and women, insulin secretion in response to a physiological challenge is increased to compensate for insulin resistance, but the dynamics of beta cell function are preserved (31). In addition, hyperinsulinemia is appropriate for the degree of insulin resistance regardless of obesity or abdominal fat distribution in this study. Thus, the insignificant increase in second phase insulin response from baseline to follow up in the placebo group may represent a compensatory response by these non-diabetic individuals to an insignificant decrease in M/I.
Our findings are similar to a cross-sectional study (13) and a cross-over trial (19) that report no difference in fasting insulin with a soy supplement in postmenopausal women without diabetes. However, our findings differ from those of Jayagopal and colleagues, who reported that soy reduced fasting insulin, insulin resistance, and improved hemoglobin A1c in postmenopausal women with diabetes (20). It is possible that soy has a greater effect on diabetics. Those with decreased insulin secretion due to beta cell dysfunction in diabetes may benefit more from the ability of genistein to increase pancreatic islet cell insulin secretion.
Our study has strengths as well as limitations. We have studied overweight and obese postmenopausal women who are at risk of developing diabetes in a randomized placebo-controlled trial. CT scans, the gold-standard, were used to measure regional fat distribution in our study, DXA was used to measure total body fat and lean mass, and hyperglycemic clamps were employed to measure insulin secretion and estimate insulin sensitivity. Serum levels of isoflavones were performed to distinguish differences between groups. However, our study was a pilot, short-term trial of Caucasian women, and results may not be generalized to other racial and ethnic groups or to all soy supplements. In addition, our trial was not a controlled feeding study. Women were instructed to substitute the supplement for other foods in their diet to maintain weight, yet both groups gained weight (but not significantly different within groups and not significantly different between groups). Furthermore, our study cannot distinguish whether soy protein, isoflavones, or other components in the supplement are responsible for the reduction in abdominal adipose tissue gain.
In summary, we found a significant reduction in the gain in total abdominal fat and subcutaneous abdominal fat with a soy supplement compared to casein placebo in postmenopausal women despite no differences in weight changes or total body fat changes between groups. Our trial suggests a new dietary option for the prevention of abdominal adipose tissue gain that occurs after menopause. Long-term trials in a population that is more ethnically diverse should be conducted in the future.
Acknowledgments
The authors would like to acknowledge Penny Fairhurst, R.N., for her work as study coordinator, Susan Ridzon, M.S., R.D. for assisting with dietary questionnaires and patient screening, Suzanne P. Cliver, B. A., for assisting with statistical analysis, D. Ray Moore II for mass spectrometer analysis, and all of the women who volunteered for this study. We also acknowledge Revival Soy for their donation of soy isoflavone and placebo shakes for this study.
This work was supported by NIH grants K24 RR019705, M01 RR109, M01 RR00032, S10 RR19261, P30 CA13148, and by the American Heart Association 0355680T.
Footnotes
Publisher's Disclaimer: This is a PDF file of an unedited manuscript that has been accepted for publication. As a service to our customers we are providing this early version of the manuscript. The manuscript will undergo copyediting, typesetting, and review of the resulting proof before it is published in its final citable form. Please note that during the production process errors may be discovered which could affect the content, and all legal disclaimers that apply to the journal pertain.
References
- 1.Ley CJ, Lees B, Stevenson JC. Sex- and menopause-associated changes in body fat distribution. Am J Clin Nutr. 1992;55:950–54. doi: 10.1093/ajcn/55.5.950. [DOI] [PubMed] [Google Scholar]
- 2.Svendsen OL, Hassager C, Christiansen C. Age- and menopause-associated variations in body composition and fat distribution in healthy women as measured by dual-energy x-ray absorptiometry. Metabolism. 1995;44:369–73. doi: 10.1016/0026-0495(95)90168-x. [DOI] [PubMed] [Google Scholar]
- 3.Toth MJ, Tchernof A, Sites CK, Poehlman ET. Effect of menopausal status on body composition and abdominal fat distribution. Int J Obesity. 2000;24:226–31. doi: 10.1038/sj.ijo.0801118. [DOI] [PubMed] [Google Scholar]
- 4.Walton C, Godsland IF, Proudler AJ, Wynn V, Stevenson JC. The effects of the menopause on insulin sensitivity, secretion and elimination in non-obese, healthy women. Eur J Clin Invest. 1993;8:466–73. doi: 10.1111/j.1365-2362.1993.tb00792.x. [DOI] [PubMed] [Google Scholar]
- 5.Wu SI, Chou P, Tsai ST. The impact of years since menopause on the development of impaired glucose tolerance. J Clin Epidemiol. 2001;54:117–20. doi: 10.1016/s0895-4356(00)00284-5. [DOI] [PubMed] [Google Scholar]
- 6.Toth MJ, Sites CK, Eltabbakh GH, Poehlman ET. Effect of menopausal status on insulin-stimulated glucose disposal. Diabetes Care. 2000;23:801–806. doi: 10.2337/diacare.23.6.801. [DOI] [PubMed] [Google Scholar]
- 7.Bhathena SJ, Velasquez MT. Beneficial role of dietary phytoestrogens in obesity and diabetes. Am J Clin Nutr. 2002;76:1191–01. doi: 10.1093/ajcn/76.6.1191. [DOI] [PubMed] [Google Scholar]
- 8.Kuiper GGJM, Lemmen JG, Carlsson B, Corton JC, Safe SH, vanderSaag PT, et al. Interaction of estrogen chemicals and phytoestrogens with estrogen receptor β. Endocrinology. 1998;139:4252–63. doi: 10.1210/endo.139.10.6216. [DOI] [PubMed] [Google Scholar]
- 9.Pedersen SB, Hansen PS, Lund S, Andersen PH, Odgaard A, Richelsen B. Identification of oestrogen receptors and oestrogen receptor mRNA in human adipose tissue. Eur J Clin Invest. 1996;4:262–9. doi: 10.1046/j.1365-2362.1996.145278.x. [DOI] [PubMed] [Google Scholar]
- 10.Anwar A, McTernan PG, Anderson LA, Askaa J, Moody CG, Barnett AH, et al. Site-specific regulation of oestrogen receptor-alpha and – beta by oestradiol in human adipose tissue. Diabetes Obes Metab. 2001;5:338–49. doi: 10.1046/j.1463-1326.2001.00145.x. [DOI] [PubMed] [Google Scholar]
- 11.Lemoine S, Granier P, Tiffoche C, Rannou-Bekono F, Thieulant ML, Delamarche P. Estrogen receptor alpha mRNA in human skeletal muscles. Med Sci Sports Exerc. 2003;35:439–43. doi: 10.1249/01.MSS.0000053654.14410.78. [DOI] [PubMed] [Google Scholar]
- 12.Nadal A, Rovira JM, Laribi O, Leon-quinto T, Andreu E, Ripoll C, et al. Rapid insulinotropic effect of 17beta-estradiol via a plasma membrane receptor. FASEB J. 1998;12:1341–8. doi: 10.1096/fasebj.12.13.1341. [DOI] [PubMed] [Google Scholar]
- 13.Goodman-Gruen D, Kritz-Sliverstein D. Usual dietary isoflavone intake is associated with cardiovascular disease risk factors in postmenopausal women. J Nutr. 2001;131:1202–06. doi: 10.1093/jn/131.4.1202. [DOI] [PubMed] [Google Scholar]
- 14.Moeller LE, Peterson CT, Hanson KB, Dent SB, Lewis DS, King DS, et al. Isoflavone-rich soy protein prevents loss of hip lean mass but dos not prevent the shift in regional fat distribution in perimenopausal women. Menopause. 2003;4:322–31. doi: 10.1097/01.GME.0000054763.94658.FD. [DOI] [PubMed] [Google Scholar]
- 15.Despres JP. Intra-abdominal obesity: an untreated risk factor for Type 2 diabetes and cardiovascular disease. J Endocrinol Invest. 2006;29(3 Suppl):77–82. [PubMed] [Google Scholar]
- 16.Wagner JD, Cefalu WT, Anthony MS, Litwak KN, Zhang L, Clarkson TB. Dietary soy protein and estrogen replacement therapy improve cardiovascular risk factors and decrease aortic cholesteyl ester content in ovariectomized cynomologus monkeys. Metabolism. 1997;46:698–705. doi: 10.1016/s0026-0495(97)90016-0. [DOI] [PubMed] [Google Scholar]
- 17.Iritani N, Sugimoto T, Fukuda H. Dietary soybean protein increases insulin receptor gene expression in male Wistar fatty rats when dietary polyunsaturated fatty acid level is low. J Nutr. 1997;127:1077–83. doi: 10.1093/jn/127.6.1077. [DOI] [PubMed] [Google Scholar]
- 18.Liu D, Zhen W, Yang Z, Carter JD, Si H, Reynolds KA. Genistein acutely stimulates insulin secretion in pancreatic beta-cells through a cAMP-dependent protein kinase pathway. Diabetes. 2006;55:1043–50. doi: 10.2337/diabetes.55.04.06.db05-1089. [DOI] [PubMed] [Google Scholar]
- 19.Duncan AM, Underhill KEW, Xu X, Lavalleur J, Phipps WR, Durzer MS. Modest hormonal effects of soy isoflavones in postmenopausal women. J Clin Endcrinol Metab. 1999;84:3479–84. doi: 10.1210/jcem.84.10.6067. [DOI] [PubMed] [Google Scholar]
- 20.Jayagopal V, Albertazzi P, Kilpatrick ES, Howarth EM, Jennings PE, Hepburn DA, et al. Beneficial effects of soy phytoestrogen intake in postmenopausal women with type 2 diabetes. Diabetes Care. 2002;25:1709–14. doi: 10.2337/diacare.25.10.1709. [DOI] [PubMed] [Google Scholar]
- 21.DeFronzo RA, Tobin JD, Andres R. Glucose clamp technique: a method for quantifying insulin secretion and resistance. Am J Physiol: Endocrinol Metab. 1979;237(3):E214–E223. doi: 10.1152/ajpendo.1979.237.3.E214. [DOI] [PubMed] [Google Scholar]
- 22.Sites CK, L'Hommedieu GD, Toth MJ, Brochu M, Cooper BC, Fairhurst PA. The effect of hormone replacement therapy on body composition, body fat distribution, and insulin sensitivity in menopausal women: a randomized, double-blind, placebo-controlled trial. J Clin Endocrinol Metab. 2005;90:2701–7. doi: 10.1210/jc.2004-1479. [DOI] [PubMed] [Google Scholar]
- 23.Van Cauter E, Mestrez F, Sturis J, Polonsky KS. Estimation of insulin secretion rates from C-peptide levels. Comparison of individual and standard kinetic parameters for C-peptide clearance. Diabetes. 1992;41:368–77. doi: 10.2337/diab.41.3.368. [DOI] [PubMed] [Google Scholar]
- 24.Kashyap S, Belfort R, Gastaldelli A, Pratipanawatr T, Berria R, Pratipanawatr W, et al. A sustained increase in plasma free fatty acids impairs insulin secretion in nondiabetic subjects genetically predisposed to develop type 2 diabetes. Diabetes. 2003;10:2461–74. doi: 10.2337/diabetes.52.10.2461. [DOI] [PubMed] [Google Scholar]
- 25.Coward L, Kirk M, Albin N, Barnes S. Analysis of plasma isoflavones by reversed-phase HPLC-multiple reaction ion monitoring-mass spectrometry. Clin Chim Acta. 1996;247(12):121–42. doi: 10.1016/0009-8981(95)06242-4. [DOI] [PubMed] [Google Scholar]
- 26.Kok L, Kreijkamp-Kaspers S, Grobbee DE, Lampe JW, van der Schouw YT. Soy isoflavones, body composition, and physical performance. Maturitas. 2005;52:102–10. doi: 10.1016/j.maturitas.2005.01.003. [DOI] [PubMed] [Google Scholar]
- 27.Naaz A, Yellayi S, Zakroczymski MA, Bunick D, Doerge DR, et al. The soy isoflavone genistein decreases adipose deposition in mice. Endocrinology. 2003;144:3315–20. doi: 10.1210/en.2003-0076. [DOI] [PubMed] [Google Scholar]
- 28.Homma H, Kurachi H, Nishio Y, Takeda T, Yamamoto T, Adachi K, et al. Estrogen suppresses transcription of lipoprotein lipase gene. Existence of a unique estrogen response element on the lipoprotein lipase promoter. J Biol Chem. 2000;275(15):11404–11. doi: 10.1074/jbc.275.15.11404. [DOI] [PubMed] [Google Scholar]
- 29.Heim M, Frank O, Kampmann G, Sochocky N, Pennimpede T, Fuchs P, et al. The phytoestrogen genistein enhances osteogenesis and represses adipogenic differentiation of human primary bone marrow stromal cells. Endocrinology. 2004;145:848–59. doi: 10.1210/en.2003-1014. [DOI] [PubMed] [Google Scholar]
- 30.Gerich JE. Is reduced first-phase insulin release the earliest detectable abnormality in individuals destined to develop type 2 diabetes? Diabetes. 2002;51(Suppl 2):S117–21. doi: 10.2337/diabetes.51.2007.s117. [DOI] [PubMed] [Google Scholar]
- 31.Gastaldelli A, Seroni AM, Diociaro D, Positano V, Buzzigoli E, Giannessi D, et al. Visceral fat and beta cell function in non-diabetic humans. Diabetologia. 2005;48:2090–06. doi: 10.1007/s00125-005-1891-3. [DOI] [PubMed] [Google Scholar]