

Abstract
A readily releasable pool (RRP) of synaptic vesicles has been identified at hippocampal synapses with application of hypertonic solution. RRP size correlates with important properties of synaptic function such as release probability. However, a discrepancy in RRP size has been reported depending on the method used to evoke synaptic release. This study was undertaken to determine quantitative relationships between the RRP defined with hypertonic solution and that released with trains of action potentials. We find that asynchronous release at cell culture synapses contributes significantly to the discharge of the RRP with trains of action potentials and that RRP size is the same when elicited by either nerve stimuli or hypertonic challenge.
INTRODUCTION
Various functional pools of synaptic vesicles have been identified including a readily releasable pool (RRP) that is immediately available for exocytosis (Rizzoli and Betz 2005). The size of the RRP is a primary determinant of synaptic strength (Dobrunz and Stevens 1997; Elmqvist and Quastel 1965; Rosenmund and Stevens 1996) and corresponds morphologically with the number of docked vesicles at the active zone (Murthy et al. 2001; Schikorski and Stevens 1997, 2001). As an important parameter of synaptic performance, several methods have been developed for physiological RRP size estimation.
In cultured hippocampal neurons, one of the most commonly employed techniques for RRP size estimation is hypertonic solution application. Hypertonic challenges are advantageous because they do not depend on increases in presynaptic calcium (Rosenmund and Stevens 1996). The processes of short-term plasticity such as augmentation, facilitation, and accelerated refilling are dependent on presynaptic increases in calcium (Magelby 1987; Zucker and Regehr 2002), and probing the RRP size without presynaptic calcium increases can offer a compelling advantage for some experiments (Otsu et al. 2004; Pyle et al. 2000; Stevens and Sullivan 1998; Stevens and Wesseling 1999a). Also pertinent for the findings in the following text, presynaptic calcium increases are necessary for asynchronous or tonic neurotransmitter release that occurs during action potential trains (Barrett and Stevens 1972; Cummings et al. 1996; Goda and Stevens 1994; Hagler and Goda 2001; Jensen et al. 2000; Lu and Trussell 2000; Otsu et al. 2004).
With multiple calcium-dependent mechanisms at work, it can be difficult to predict RRP size using action potential trains. Despite these difficulties, several analytic methods have been developed (Elmqvist and Quastel 1965; Schneggenburger et al. 1999, 2002; Wesseling and Lo 2002). A recent study applied one of these methods and concluded that there is a discrepancy in RRP size in glutamatergic hippocampal synapses depending on the method used to evoke synaptic release (Molder and Mennerick 2005). These investigators found RRP size was approximately five times smaller when elicited with action potential trains compared with hypertonic solution application, and concluded that reluctant vesicles (Schneggenburger et al. 2002; Wu and Borst 1999) contribute to this discrepancy. This paper does not address heterogeneous sub-populations of the RRP, but we apply published methods to our data and conclude that RRP size is the same when discharged by either nerve stimuli or hypertonic challenge.
Independent of RRP size estimation, the study began with a seemingly similar but actually quite different question: in excitatory hippocampal neurons, how many action potentials are required to evoke an equivalent amount of synaptic release as a brief hypertonic challenge? We then performed several experiments demonstrating the importance of asynchronous release before developing an estimate of RRP size based solely on the responses to action potentials. We will conclude that a remarkably consistent finding is that 25–30 action potentials at 20 Hz are sufficient to release the RRP.
METHODS
Cell culture
Primary cultures of hippocampal neurons were prepared from P0 to P1 rat pups using standard methods (Bekkers and Stevens 1991; Segal and Furshpan 1990; Stevens and Sullivan 1998). Briefly, glass coverslips were coated with 0.15% agarose in 24-well tissue culture plates and then sprayed with a permissive substrate of rat-tail collagen and poly-d-lysine. “Islands” or “microdots” were formed by application of an astrocyte feeder layer that grew only on regions with the permissive substrate. Hippocampal tissue from the CA1 region was dissected and dissociated into a suspension that was placed in the tissue culture wells. On those islands with a single neuron, synaptic connections from the neuron formed on itself (“autapses”). All laboratory animals were managed in accordance with institutional and national guidelines.
Solutions
Cultures were superfused with 50 μM d,l-2-amino-5-phosphonovaleric acid (Research Biochemicals, Natick, MA) in physiological saline [which contained (in mM) 132 NaCl, 2 KCl, 2.6 CaCl2, 1.3 MgCl2, 10 glucose, and 10 HEPES with pH ~7.2 and osmolarity adjusted to ~0.3 Osm with sorbitol]. In addition, 10 μM 6-cyano-7-nitroquinoxaline-2,3-dione (Research Biochemicals) was added in some experiments to block synaptic currents and allow accurate measurement of action potential and shock artifacts. Where indicated, cultures were incubated for 5 min with 300 μM of the membrane-permeable calcium buffer EGTA-acetoxymethyl ester in physiological saline. Solutions were made hypertonic with the addition of sucrose, and values reported give the tonicity in excess of the ~0.3 Osm from the saline. Solutions were applied with a rapid-switching local superfusion system controlled by computer. All experiments were carried out at room temp (~22°C).
Electrophysiology
Voltage-clamp recordings were obtained using a standard perforated-patch method [amphotericin B, ~0.1 mg/ml freshly added to internal solution (containing, in mM) 140 potassium gluconate, 10 HEPES, 9 NaCl, 1 EGTA, 1 MgCl2, 0.2 CaCl2, 2 MgATP, and 0.2 LiGTP with pH ~7.2 and osmolarity adjusted to ~0.3 Osm with sorbitol]). Cells were grown 8–14 days in culture prior to use except for 4-day cultures used for measurements of miniature excitatory postsynaptic current (mEPSC) amplitude (so that individual release events could be resolved). Excitatory cells were identified by measuring the reversal potential of the synaptic currents. Measurements for Fig. 1 were made under three conditions (hypertonic solution, action potential train, action potential train + CNQX) with each epoch of three separated by 5 min to allow decay of any short-term plasticity.
FIG. 1.

Discharge of the readily releasable pool (RRP) by action potentials. A: cumulative charge in terms of the RRP size vs. time during 4-s action potential trains at 3 frequencies (○, 10 Hz, 4 trials; ■, 20 Hz, 20 trials; Δ, 40 Hz, 8 trials; 6 total cells). Each data point is a 200-ms bin with cumulative charge (±SE) normalized to the RRP size determined with hypertonic solution challenge. Artifacts of nonsynaptic charge were removed by subtraction of an action potential train in the presence of 6-cyano-7-nitroquinoxalene-2,3-dione (CNQX). B: subset of A showing cumulative charge (±SE) ≤ 1 RRP. C: cumulative charge in terms of the RRP size plotted vs. stimulus number (instead of time as in B).
Data analysis
The RRP at hippocampal synapses was defined physiologically by a 4.5-s application of 0.5 Osm hypertonic solution to an entire single-cell island (Rosenmund and Stevens 1996; Stevens and Tsujimoto 1995; Stevens and Wesseling 1998). RRP size was quantified with a charge integral of the synaptic current. To improve the accuracy of this measurement, a correction was made for the active replenishment process (Stevens and Sullivan 1998; Stevens and Wesseling 1998). The steady-state charge transfer from the tail of the response was calculated, and then the correction consisted of subtracting this value beginning at the peak of synaptic release until the end of the response. Starting the correction from the onset of the synaptic current would result in a slight underestimate of the pool size, whereas starting the subtraction from the onset of the steady state would slightly overestimate the pool size by including release from the refilling process. The dynamics of vesicle replenishment during hypertonic challenge have not been studied so our correction splits the difference between an upper and lower bound.
To compare the response to nerve stimuli to the RRP defined by hypertonic challenge, recordings during trains of action potentials were evaluated for total synaptic charge transfer. The responses to action potentials were first corrected for nonsynaptic artifacts by subtraction of a record obtained in the presence of CNQX and then analyzed with charge integrals to be inclusive of all synchronous and asynchronous (phasic and tonic) release. When responses to nerve stimuli are reported in terms of the RRP size determined with hypertonic challenge, the charge integrals were normalized by the hypertonic charge integral from the paired measurement in the same epoch.
Cumulative methods (Habets and Borst 2007; Molder and Mennerick 2005; Schneggenburger et al. 1999, 2002) were used to estimate RRP size from the 20-Hz action potential data set. For cumulative amplitude analysis (Fig. 5A), peak synaptic currents were identified visually, and the line of best fit was calculated by linear regression. To facilitate comparison to the RRP size defined by hypertonic challenge, a ballpark approximation of current and charge in terms of vesicles used scaling factors of mean mEPSC amplitude −18.3 pA and mean mEPSC charge −81.5 fC (Molder and Mennerick 2005). For the secondary y axis in Fig. 5A, the cumulative amplitude was first scaled to vesicles by dividing by mean mEPSC amplitude and then normalized to the scaled hypertonic RRP in terms of vesicles (mean RRP charge from hypertonic solution application/mean mEPSC charge). For cumulative area analysis (Fig. 5B), the data set consisted of charge integrals of total synaptic charge transfer inclusive of both synchronous and asynchronous release and a line of best fit was calculated by linear regression. An operationally equivalent presentation of cumulative area analysis is shown in Fig. 5D.
FIG. 5.
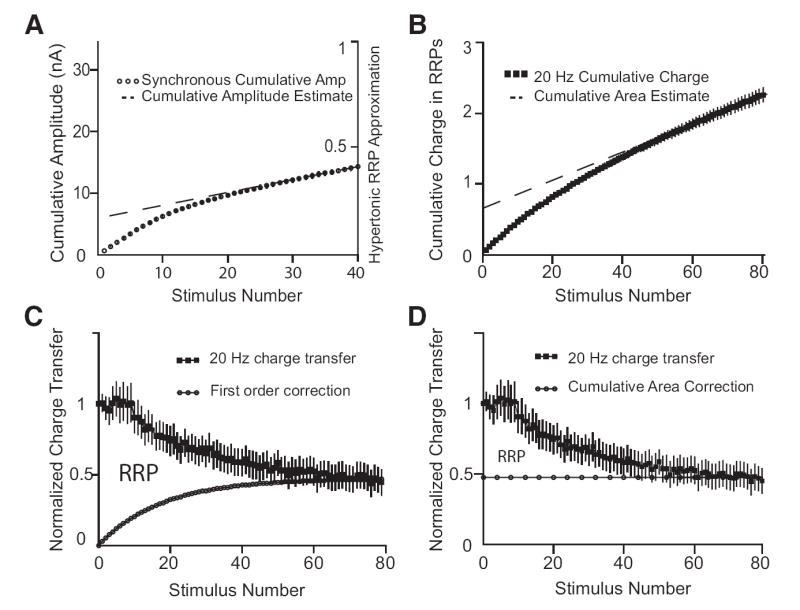
Methods for estimating RRP size from action potential trains. A: cumulative amplitude analysis in a representative cell. This is the 1st cell in the series analyzed in Fig. 1. On the primary y axis, ○ (7 trials) are accumulated peak synaptic currents (means ± SE) after the 1st 40 stimuli during a 4-s 20-Hz action potential train. For cumulative amplitude analysis, a line of best fit is calculated from the last 10 points in the graph representing 1.5–2 s in the stimulus train. At time 0, this line intersects the y axis at 5.9 nA and is an estimate of RRP size. To relate the cumulative amplitude estimate to the RRP defined by hypertonic solution application, the cumulative amplitude values were normalized by a rough approximation of the hypertonic RRP size (see METHODS) on the secondary y axis. On this scale, the cumulative amplitude estimate intersects time 0 at 17% of the hypertonic RRP size. B: cumulative area analysis; ■ (20 trials, 5 cells) are the cumulative synaptic charge transfer in terms of the hypertonic RRP size during a 4-s 20-Hz action potential train. Each data point is a 50-ms bin (for individual responses) with mean cumulative charge (±SE) normalized to the RRP size determined with hypertonic solution challenge. Artifacts of nonsynaptic charge were removed by subtraction of an action potential train in the presence of CNQX. This is the same data set as Fig. 1 except that the charge integrals are calculated in 50-ms bins. For cumulative area analysis, a line of best fit is calculated from the last 10 points in the graph representing 3.5– 4 s in the stimulus train. At time 0, this line intersects the y axis at 65% of the hypertonic RRP size. C: method of Wesseling and Lo. Top: (■, 20 trials, 5 cells) is the charge transfer (±SE) in 50-ms bins for individual responses in a 20-Hz action potential train normalized to the 1st response. This is the same data set as B but plotted in a different manner. The area under the curve formed by the normalized responses is a measure of the total charge transfer during the 20-Hz action potential trains. A correction (○) for the active refilling process is derived using a model with first order kinetics. This correction represents the increasing fraction of total charge transfer predicted to result from vesicles that become replenished during the course of the action potential train. The area between these 2 curves is the estimate for the RRP size. The correction depicted follows from the model but note that the actual correction [ω(S) – see METHODS] is for charge transfer from vesicles that become newly available and are subsequently released over the course of the action potential train. D: alternative presentation of cumulative area analysis. D equivalent to C except that the curve that corrects for the active replenishment process (○) is now derived using cumulative area analysis. For clarity of comparison, the cumulative area method is demonstrated in this manner instead of the typical presentation in B. This format is operationally equivalent to the typical presentation except that the location of the linear correction is derived from the average of the normalized responses between 3.5 and 4 s. The area between these 2 curves is the estimate for the RRP size from cumulative area analysis. Consistent with the typical cumulative area analysis in B, the RRP area in D is 63% of the area in C.
An alternative measurement of the RRP size was obtained using the method of Wesseling and Lo (2002). For details of the model, please refer to the appendix in Wesseling and Lo (2002). Select equations include the two independent equations for the fusion efficiency (fe)
that were solved numerically with parameters from the experimental data to obtain common solutions for α (rate constant of refilling = 0.42) and fe (fusion efficiency = 0.04) for the 20-Hz train. ν is the frequency of stimulation and r(1) and r(∞) are the amount of synaptic release (measured with charge integrals) with the first stimulus and stimulation when the RRP is empty. R(∞) was calculated as the mean response to the last 10 stimuli of 80 in the 20-Hz train. Consistent with results from the hippocampal slice preparation (Wesseling and Lo 2002), the value for 40 Hz is approximately half that for 20 Hz (data not shown). A value for the size of the RRP was obtained from the difference between the cumulative charge released during the action potential train and a correction calculated with the following expression
This expression corrects for the charge transfer from synaptic vesicles that became newly available and were released in the course of the action potential train. This is conceptualized in Fig. 5C as an increasing fraction of total charge transfer predicted to result from synaptic vesicles that became newly available during the course of the action potential train. The correction shown in Fig. 5C follows from the model but is not a plot of the expression in the preceding text.
Spontaneous events were obtained from the baseline period preceding each train and starting 1 s after the end of the train. Asynchronous release has 100- to 200-ms time constant (Goda and Stevens 1994) so asynchronous quantal release was measured between 50 ms (to avoid any synchronous release) and 300 ms after the end of the action potential train where asynchronous release would be maximal and the predominant mechanism.
RESULTS
Discharge of the RRP by action potentials
Our main observation is a measurement of synaptic release during action potential trains at three different frequencies shown in Fig. 1. Cumulative charge integrals during the action potential trains are shown normalized to the RRP size determined with hypertonic solution application. For clarity, until the final section, we reserve the term “RRP” to refer to the transfer of synaptic charge elicited by a brief application of hypertonic solution (Rosenmund and Stevens 1996; Stevens and Tsujimoto 1995). We use the terms “release” and “discharge” of this RRP to refer to transfer of synaptic charge equivalent to one full RRP. This contrasts to a RRP that is “empty” or “depleted,” which refers to a minimum of RRP fullness after sustained synaptic activity (Wesseling and Lo 2002). These states are not equivalent because there is an active replenishment process.
The basic experimental strategy was to determine the RRP size with hypertonic solution application and then use this value to normalize measurements of synaptic release during action potential stimulation. As postsynaptic quantal size does not change during the osmotic shock or short trains of action potential (Bekkers et al. 1990; Mennerick and Zorumski 1995; Stevens and Tsujimoto 1995; Stevens and Wesseling 1998, 1999b) (Fig. 4), the RRP size and amount of synaptic release can be measured up to a proportionality constant with charge integrals of the synaptic currents (Stevens and Wesseling 1998). Although the absolute value of the charge integrals depends on the number of synaptic connections, relative values within the same cell are directly comparable as both forms of stimulation draw from the same population of vesicles (Rosenmund and Stevens 1996).
FIG. 4.

Quantal size is unchanged after action potential trains. Cumulative amplitude histogram and frequency histogram of miniature excitatory postsynaptic current (mEPSC) amplitudes obtained from periods of baseline spontaneous release and asynchronous release (see METHODS). Data includes 20 trials in 3 cells, and P > 0.1 by Kolmogorov-Smirnov test.
The experimental design took into account various advantages and disadvantages of our preparation. We used primary tissue cultures that included isolated hippocampal neurons on small “islands” that form synaptic connections with themselves called “autapses” (Bekkers and Stevens 1991; Segal and Furshpan 1990). Only excitatory neurons were included in the study. Action potentials evoked in the cell body activate the neuron’s entire complement of synapses, and by superfusion of the entire island with hypertonic solution, the same population of synapses can be studied with both forms of stimulation. However, because a single patch electrode is used to both evoke action potentials and record the response, the resulting record includes nonsynaptic currents from the shock artifact and action potentials. Therefore the experimental design for Fig. 1 was successive measurements under three conditions: hypertonic solution application, action potential train, and then action potential train in the presence of non-N-methyl-d-aspartate (NMDA) glutamate receptor blocker CNQX. In the presence of CNQX, synaptic currents are blocked and nonsynaptic currents isolated; the record obtained with action potential stimulation in the presence of CNQX was subtracted from the standard action potential train to remove artifacts from non-synaptic currents.
Figure 1 shows the amount of synaptic release in terms of the RRP size (from hypertonic challenge) during simple action potential trains at three different frequencies. More than a single RRP is released as there is an active refilling process; at rest, the RRP in hippocampal synapses is refilled with an ~5-to 10-s time constant (Rosenmund and Stevens 1996; Stevens and Tsujimoto 1995) that is accelerated with accumulation of intracellular calcium (Dittman and Regehr 1998; Stevens and Wesseling 1998; Wang and Kaczmarek 1998). As we will show in the following text, asynchronous release contributes greatly to discharging the RRP and continued release during the action potential trains. The continued accumulation of charge in Fig. 1 is consistent with previous studies showing a steady-state “plateau” of release predominantly composed of asynchronous events (Hagler and Goda 2001; Lu and Trussell 2000; Otsu et al. 2004). Despite a fourfold difference in stimulus frequency, there is not a fourfold difference in synaptic release; presumably the overall release rate becomes limited by the rapidity of refilling (Abbott et al. 1997; Elmqvist and Quastel 1965; Otsu et al. 2004; Wesseling and Lo 2002).
Asynchronous and synchronous discharge of the RRP
While making our measurements, we noticed that release of the RRP with action potential trains occurred both synchronously and asynchronously (Cummings et al. 1996; Hagler and Goda 2001; Jensen et al. 2000; Lu and Trussell 2000; Otsu et al. 2004). Figure 2 shows examples of the synaptic currents recorded during this study. At the start of action potential trains, there is a slow build-up of asynchronous or tonic release (A) that by the end of the train predominates (B). Despite the lack of synchronous currents (pulse train depression), there is substantial synaptic release as shown with the continued accumulation of charge in Fig. 1. This can be appreciated in the example currents by noting the area between the baseline and the asynchronous currents in Fig. 2B; this area forms the basis of the charge integral. To take into account asynchronous release and to allow comparison to the response to hypertonic challenge, our measurements during action potential trains are in terms of charge instead of an alternative such as peak amplitude.
FIG. 2.

Asynchronous and synchronous discharge of the RRP. Examples of synaptic currents during action potential trains showing asynchronous and synchronous release. Nonsynaptic currents from the shock artifact and action potentials were removed for clarity. A: response to the 1st 10 action potentials in a autapse recording showing build-up of asynchronous release. (Scale bars are 500 pA and 50 ms for all 3 recordings.) B: response to the final 4 action potentials (shown with hash marks) in a 4-s 20-Hz train from the same recording as A. At the end of the action potential train, asynchronous release predominates. C: response to 1st 10 action potentials in the postsynaptic cell of a cell pair showing similar build-up of asynchronous release.
To ensure that our measurements during action potential trains are valid, we tested whether these currents arose from synaptic release. In particular, we wanted to make sure that the currents we were associating with asynchronous release were actually synaptic in origin (Otsu et al. 2004). During a train of action potential stimulation when the predominant form of release was asynchronous, the non-NMDA receptor blocker CNQX was applied; CNQX blocked all currents in our recordings except the known nonsynaptic currents from the shock artifact and action potentials (data not shown).
We also tested to make sure that these currents were not unique to the autapse preparation. Figure 2C shows a recording from a postsynaptic cell in a cell pair (Cummings et al. 1996; Jensen et al. 2000). Action potentials were elicited in one cell, and the resulting synaptic currents are recorded in the nearby postsynaptic cell. The synaptic currents in cell pairs exhibit a similar build-up of asynchronous release. However, measurements in terms of the hypertonic RRP like Fig. 1 could not be made because action potentials and hypertonic solution application do not activate the same population of synapses in cell pairs.
Chelation of intracellular calcium slows discharge of the RRP
As a further test of the quantal nature of the currents during our action potential trains, we utilized the membrane-permeable calcium chelator EGTA-AM. Previous studies have shown that asynchronous release is favored by accumulation of presynaptic calcium but inhibited by EGTA-AM (Cummings et al. 1996; Hagler and Goda 2001; Lu and Trussell 2000; Otsu et al. 2004). Chelation of intracellular calcium also impacts processes of short-term plasticity (reviewed in Zucker and Regehr 2002) but does not affect hypertonic challenge (Rosenmund and Stevens 1996). In our preparation, we predicted that treatment with the membrane-permeable calcium chelator EGTA-AM would increase the number of action potentials needed to discharge the RRP.
Figure 3 confirms that longer action potentials trains are needed to discharge the RRP in the presence of EGTA-AM. In preliminary experiments, a concentration of 300 μM EGTA-AM was found to be near maximal without interfering with synchronous release (where interference with synchronous release was equated to change in the amplitude of the initial response). B shows example currents before and after 5-min incubation with EGTA-AM; synchronous release is maintained but the build-up of asynchronous release is blocked. In A, the cumulative charge during 20-Hz action potential trains is plotted in terms of the RRP from hypertonic challenge. A substantially longer train is needed to discharge the RRP in the presence of EGTA-AM presumably due to inhibition of asynchronous release. The difference in charge accumulation with EGTA-AM treatment reflects the significant contribution of asynchronous release to discharging the RRP.
FIG. 3.

Chelation of intracellular calcium slows discharge of the RRP. A: cumulative charge (±SE) in terms of the RRP during 20-Hz action potential trains in the absence (■, 20 trials, 4 cells, data from Fig. 1) or presence (◊, 12 trials, 3 cells) of 300 μM EGTA-AM. Each data point is a 200-ms bin with cumulative charge (±SE) normalized to the RRP size determined with hypertonic challenge. Only data ≤1 RRP are shown for clarity. Artifacts of nonsynaptic charge were removed by subtraction of an action potential train in the presence of CNQX. B: example currents from the same cell before (top) and after (bottom) incubation with 300 μM EGTA-AM showing decreased asynchronous release following chelation of intracellular calcium. (Scale bars are 500 pA and 100 ms.)
Quantal size is unchanged after action potential trains
To ensure the accuracy of our measurements, postsynaptic quantal size was determined before and after action potential trains. This also served as a final test that our currents were indeed synaptic in origin. Although quantal size in our preparation has been found to be unchanged under various conditions (Bekkers et al. 1990; Mennerick and Zorumski 1995; Otsu et al. 2004; Stevens and Tsujimoto 1995; Stevens and Wesseling 1998, 1999b; Stevens and Williams 2000), one of the assumptions of this study is that the postsynaptic sensitivity to neurotransmitter is unchanged during the action potential trains. We tested this assumption by comparing the distribution of mEPSC amplitudes between control conditions and after our action potential train.
Figure 4 shows that there is no difference in the distribution of mEPSC amplitudes (P > 0.1 by Kolmogorov-Smirnov test) that occur spontaneously or those released asynchronously after a 4-s 20-Hz action potential train. Our strategy was to obtain measurements from cells in their fourth day in culture where individual release events could be resolved after the action potential train. Quantal size could not be directly obtained from recordings used to make our other measurements because individual release events could not be resolved (see Fig. 2B). Evidence that postsynaptic sensitivity to neurotransmitter is unchanged supports a key assumption of this study.
Discrepancy in RRP size with cumulative methods
We next applied published methods to our data to make RRP size estimates based solely on the recordings during action potential trains. Thus far, the term “RRP” has been used to refer to the transfer of synaptic charge elicited by a brief application of hypertonic solution, but now we present an independent measure of RRP size based only on the response to the action potentials. Three alternative methods for calculating this estimate are assessed.
Two cumulative methods are presented (Habets and Borst 2007; Molder and Mennerick 2005; Schneggenburger et al. 1999, 2002). Cumulative amplitude analysis (Fig. 5A) and cumulative area analysis (Fig. 5B) form RRP estimates based on different features of the data set. Cumulative amplitude analysis focuses on synchronous synaptic release with accumulation of peak synaptic currents in the action potential train. Cumulative area analysis focuses on both synchronous and asynchronous synaptic release with accumulation of charge integrals in the action potential train. In this paper, we attempt to be inclusive of synchronous and asynchronous release with a very literal interpretation of cumulative area analysis; after correcting for nonsynaptic charge artifacts, we accumulate total synaptic charge transfer with charge integrals across the entire recording.
A cumulative amplitude analysis for calculating RRP size during action potential trains is plotted in Fig. 5A. Because of ambiguities in peak detection later in the 20-Hz train (see Fig. 2B), the analysis was limited to the first 40 stimuli. The peak synaptic currents are mostly composed of synchronous synaptic release, so the ○ are labeled “synchronous cumulative amplitude.” For the series of cells from Fig. 1 with responses to 20-Hz action potentials, cumulative amplitude analysis finds a range of RRP size estimates from 5.4 to 25 nA (data not shown). One of the most significant sources of variability in these measurements is that the number of synapse differs between cells. When compared with the ballpark hypertonic RRP approximation (see METHODS), the cumulative amplitude estimate is 6 –17% of hypertonic RRP size in the series of cells from Fig. 1 (data not shown). We find that when the RRP size is estimated from the responses to 20-Hz action potential trains by cumulative amplitude, there is a discrepancy with the RRP size estimate from hypertonic challenge.
A cumulative area analysis for calculating RRP size during nerve stimuli is plotted in Fig. 5B. In previous sections of the manuscript, we have argued for the importance of asynchronous release in discharge of the RRP. So for cumulative area analysis in this paper, we accumulate total synaptic charge transfer with charge integrals across the entire recording. A line of best fit based on the 20-Hz responses between 3.5 and 4 s estimates the cumulative area at time 0 to be 65% of the RRP size measured with hypertonic challenge. We do not plot the 10- and 40-Hz results, but lines of best fit from the responses between 3.4 and 4 s in Fig. 1A provide RRP size estimates of 37 and 70%, respectively (data not shown).
Application of cumulative methods led to a recent report that there is a discrepancy between RRP size estimates when synaptic release is evoked with hypertonic solution application or action potential trains (Molder and Mennerick 2005). We also note a discrepancy in RRP size estimates with these methods applied to our data. However, we do not find a difference with the alternative method presented in the next section. Graphical demonstrations of the methods are presented in Fig. 5, and we return to this issue in the discussion.
RRP size is the same with action potentials or hypertonic challenge
A third RRP size estimate based solely on the action potential train can be made based on a theory that models refilling of the RRP with first-order kinetics (Stevens and Tsujimoto 1995; Wesseling and Lo 2002). RRP size estimates derived solely from the action potential train are separate and independent from our standard RRP size estimate from hypertonic challenge. Two cumulative methods for estimating RRP size from the action potential train were presented in the previous section, and now we present the method published by Wesseling and Lo (2002). A graphical demonstration of this method is shown in Fig. 5C, and select equations and parameters of the fit are reported in the METHODS section. The analysis begins with total synaptic charge transfer inclusive of both synchronous and asynchronous release and then applies a correction for refilling modeled as a first order process. This method differs from cumulative area analysis that applies a linear correction for the replenishment process (Fig. 5D).
Figure 6A shows the accumulated charge transfer during the first 30 stimuli of a 20-Hz action potential train (same data set as Fig. 1) plotted in terms of two independent measures of RRP size. The two measures of RRP size are our standard one from the response to hypertonic challenge (□) and another derived using the method of Wesseling and Lo (○). The analysis for each curve began with a simple charge integral across the portion of the recording corresponding to the first 30 stimuli that is plotted as cumulative charge in 50-ms bins. However, instead of plotting the absolute value of total synaptic charge transfer each curve is normalized by one of two independent measures of RRP size. The □ are normalized by the hypertonic RRP size estimate, and this curve is nearly equivalent to the squares in Fig. 1C except for a difference in bin size. Although there are differences in plot details, the analysis for the squares in Fig. 6A is equivalent to that presented in Fig. 1 where RRP size is estimated from the response to a brief hypertonic challenge. In contrast, the ○ in Fig. 6A are normalized by an estimate of the RRP size derived using the method of Wesseling and Lo. It is the characteristics of the action potential train itself that form the basis of this estimate and this value is used to normalize the ○ in Fig. 6A. We report the RRP size estimates in this manner because absolute values are dependent on the number of synaptic connections.
FIG. 6.

RRP size is the same with action potentials or hypertonic challenge. A: cumulative charge transfer in terms of 2 independent estimates of RRP size. Each data point is the cumulative charge (±SE) in 50-ms bins for the 1st 30 responses in a 4-s 20-Hz action potential train (20 trials, 5 cells) normalized to 2 independent RRP size estimates. Artifacts of nonsynaptic charge were removed by subtraction of an action potential train in the presence of CNQX. The same data underlie both curves (and also Fig. 1), but the analysis differs so the error bars are not identical. □ plotted in terms of our standard RRP size estimate from the response to hypertonic solution application; ○ plotted in terms of an independent RRP size estimate based solely on the action potentials. The RRP size estimate from the action potentials utilized the model of Wesseling and Lo (2002) with parameters of the fit α = 0.42 and fe = 0.04 (see METHODS). Hypothesis testing reveals no significant difference between cumulative charge transfer in terms of these 2 estimates (P > 0.1, Kolmogorov-Smirnov). B: cumulative charge transfer in a 20-Hz action potential train in terms of RRP size in hippocampal cell culture and hippocampal slice preparations. Each data point is the cumulative charge (±SE) in 50-ms bins for individual responses in a 20-Hz action potential train. □, hippocampal cell culture data set from A where RRP size is estimated from a brief hypertonic challenge. Δ, re-plotted with permission (copyright 2002 Society for Neuroscience) from Wesseling and Lo (2002) where RRP size is estimated solely from the response to action potentials in the hippocampal slice preparation. There is no difference in cumulative charge transfer during 20Hz action potential trains in hippocampal cell culture and slice preparations (P > 0.1 by Kolmogorov-Smirnov).
The two independent RRP size estimates are remarkably similar. In Fig. 6A, a value of “1” on the primary y axis corresponds to the RRP size estimated from hypertonic challenge while a value of “1” on the secondary y axis corresponds to the RRP size estimated from the action potential train using the method of Wesseling and Lo. Hypothesis testing reveals no significant difference between cumulative charge transfer in terms of these two estimates (P > 0.1, Kolmogorov-Smirnov). These are separate and independent RRP size estimates derived from different data. Because the RRP size is nearly identical with these two independent measurements, it is reasonable to conclude that the size of the RRP elicited by hypertonic challenge or action potential stimulation is within experimental error the same.
By drawing on the literature, we can compare our estimates of RRP size in primary hippocampal cell culture with similar results from a hippocampal slice preparation. Figure 6B is a plot of cumulative charge transfer during 20-Hz action potential trains in our hippocampal cell culture preparation (□), and similar data (Δ) from the hippocampal slice preparation of Wesseling and Lo (2002) that has been re-plotted in a consistent format. The cell culture results are plotted in terms of our standard RRP estimate from hypertonic challenge (same data are in Fig. 6A), but the hippocampal slice results are plotted in terms of a RRP estimate derived solely from the response to action potentials using the model. Hypothesis testing reveals no significant difference between cumulative charge transfer in the two experimental preparations (P > 0.1, Kolmogorov-Smirnov). Although not explicitly plotted, we also find no significant difference (P > 0.1, Kolmogorov-Smirnov) between cumulative charge transfer in terms of the RRP estimated from action potentials in hippocampal cell culture (Fig. 6A, ○) and hippocampal slice (Fig. 6B, Δ). In summary, we note consistent findings with 20-Hz action potential trains in three conditions: hippocampal cell culture where RRP size is estimated from the response to hypertonic solution application; hippocampal cell culture where RRP size is estimated solely from the response to action potentials; and in the hippocampal slice preparation (Wesseling and Lo 2002).
We conclude whether RRP size is estimated from the response to a hypertonic challenge or action potential trains, ~25–30 action potentials at 20 Hz are necessary to discharge the RRP. The basis for this conclusion is the consistency of findings with two independent measures of RRP size. By drawing on the literature, we find that these findings extend to the hippocampal slice preparation.
DISCUSSION
Discharge of the RRP by action potentials
Our main observation is measurements of action potential trains that discharge the RRP defined by brief applications of hypertonic solutions. Asynchronous release contributes significantly to release of the RRP with trains of action potentials (Hagler and Goda 2001; Otsu et al. 2004). This result is independent of methods of estimating RRP solely from action potentials and is simply a comparison of synaptic charge transfer with the two forms of stimuli. Predicting the sort of action potential trains that may discharge the RRP is difficult because changes in presynaptic calcium lead to changes in synaptic strength (short-term plasticity) and mode of release (synchronous to asynchronous). Unique characteristics of our cell culture preparation allowed us to make a direct measurement. We find that relatively short action potential trains are needed because of the substantial contribution of asynchronous release. In fact, an analysis based only on synchronous responses might overestimate the length of the action potential trains needed to discharge the RRP. This study may prove especially useful for the rational design of stimulation parameters to discharge the RRP (Stevens and Williams 2000).
There are several sources of variability that could impact these measurements (Atwood and Karunanithi 2002). Most importantly, the amount of synaptic release is inferred through charge integrals of the postsynaptic currents. We report that postsynaptic quantal size is unchanged after trains of action potentials (Fig. 4) and cite similar findings in the literature. In addition, several studies find the magnitude of other postsynaptic effects such as receptor desensitization and saturation limited in this preparation (Liu et al. 1999; McAllister and Stevens 2000; Molder and Mennerick 2005; Otsu et al. 2004). Another potential source of variability is action potential conduction failure (Brody and Yue 2000), but much of our analysis is based on data with a moderate (20 Hz) action potential stimulation frequency that has been found to be effectively linked with exocytosis (He et al. 2002; Molder and Mennerick 2005). We cannot exclude effects from inhibition of presynaptic calcium currents as found at the calyx of Held (Forsythe et al. 1998; Xu and Wu 2005), but note that this would not influence the validity of our main observation of discharge of the RRP with action potentials. Our main observation is simply a comparison of synaptic charge transfer with the two forms of stimuli.
Methods for estimating RRP size from action potential trains
We also applied published methods to our data to estimate RRP size based solely on the response to action potentials. The conclusion from these analyses is dependent on the method that is applied. Why are the three estimates (Fig. 5) so different? In this paper, we identify two sources of variability: the inclusion of asynchronous release and the nature of the correction for replenishment.
When cumulative methods are used to estimate RRP size from the response to action potential trains, there is a discrepancy compared with the RRP size estimated from the application of hypertonic solution. The largest discrepancy is with cumulative amplitude analysis (Fig. 5A). However, the magnitude of the discrepancy is much less when asynchronous release is included with the cumulative area analysis (Fig. 5B). In this paper, we accumulate total synaptic charge transfer with charge integrals across the entire recording for cumulative area analysis. Of the cumulative methods, we argue that cumulative area analysis is more accurate because of the inclusion of asynchronous release.
Both cumulative area analysis and the method of Wesseling and Lo are inclusive of synchronous and asynchronous release but differ in the nature of the correction for active replenishment. Cumulative area analysis applies a linear correction (Habets and Borst 2007; Molder and Mennerick 2005; Schneggenburger et al. 1999, 2002), whereas the method of Wesseling and Lo models replenishment with first-order kinetics (Wesseling and Lo 2002). Cumulative area analysis (Fig. 5D) assumes refilling is uniform and maximal throughout the stimulus; as such, this method will tend to overcorrect and thus underestimate RRP size. With this method, the same maximal correction is applied to synaptic release from the first action potential as that at the end of an entire train. It is important to note that the accuracy of this estimator is impacted by characteristics of the action potential train; very reasonable estimates can be expected with the use of rapid (i.e., 100 Hz) action potential trains that minimize the time for the stimulus compared with time course of refilling (Habets and Borst 2007; Schneggenburger et al. 1999, 2002). The method of Wesseling and Lo (2002) also makes an assumption of uniform and maximal behavior, but it is for the rate constant of the replenishment process modeled with first-order kinetics. This leads to a correction for the replenishment process that increases over the course of the action potential train until the RRP is depleted to steady-state minima. This correction is conceptualized in Fig. 5C as an increasing fraction of the total charge transfer predicted to result from vesicles that become newly available during the course of the action potential train.
RRP size is the same with action potentials or hypertonic challenge
Different conclusions follow depending on the estimator chosen to calculate RRP pool size solely from the action potential train. Like previous investigators (Molder and Mennerick 2005), we find a discrepancy between the RRP size estimates based on hypertonic solution application and that from action potential trains when cumulative methods are applied. These investigators concluded that there is a heterogeneous or reluctant vesicle (Schneggenburger et al. 2002; Wu and Borst 1999) population that is differentially released with varying calcium influx. Our study was not designed to investigate questions of heterogeneous release probability but instead focused on developing quantitative relationships between the RRP previously defined with hypertonic solution and that discharged with trains of action potentials. Our results argue that the conclusions from cumulative methods represent an underestimation of the RRP size during nerve stimuli. With an alternative estimate that is inclusive of synchronous and asynchronous release and utilizes a time-varying correction for refilling, the discrepancy is not observed. This study included only excitatory hippocampal neurons so we cannot address reported differences between glutamatergic and GABAergic neurons (Molder and Mennerick 2005).
In summary, our main observation is measurements of action potential trains that discharge the RRP defined by brief applications of hypertonic solutions. Asynchronous release contributes significantly to release of the RRP with trains of action potentials. In excitatory hipppocampal neurons in cell culture, a reasonable conclusion is that the size of the RRP elicited by hypertonic challenge or action potential stimulation is within experimental error the same. For both hippocampal slices and cell culture preparations, ~25–30 action potentials at 20 Hz are sufficient to release the equivalent of one full RRP previously defined with hypertonic challenge.
Acknowledgments
The authors thank J. Wesseling for many helpful discussions.
GRANTS This work was supported by the Howard Hughes Medical Institute and by grants from the National Institutes of Health to C. F. Stevens. J. H. Williams was funded by the medical scientist training program (T32GM07198-32) at the University of California San Diego and by departmental generosity and NIH training grant T32GM07592 at Massachusetts General Hospital.
References
- Abbott LF, Varela JA, Sen K, Nelson SB. Synaptic depression and cortical gain control. Science. 1997;275:220–224. doi: 10.1126/science.275.5297.221. [DOI] [PubMed] [Google Scholar]
- Atwood HL, Karunanithi S. Diversification of synaptic strength: presynaptic elements. Nat Rev Neurosci. 2002;3:497–516. doi: 10.1038/nrn876. [DOI] [PubMed] [Google Scholar]
- Barrett EF, Stevens CF. The kinetics of transmitter release at the frog neuromuscular junction. J Physiol. 1972;227:691–708. doi: 10.1113/jphysiol.1972.sp010054. [DOI] [PMC free article] [PubMed] [Google Scholar]
- Bekkers JM, Richerson GB, Stevens CF. Origin of variability in quantal size in cultured hippocampal neurons and hippocampal slices. Proc Natl Acad Sci USA. 1990;87:5359–5362. doi: 10.1073/pnas.87.14.5359. [DOI] [PMC free article] [PubMed] [Google Scholar]
- Bekkers JM, Stevens CF. Excitatory and inhibitory autaptic currents in isolated hippocampal neurons maintained in cell culture. Proc Natl Acad Sci USA. 1991;88:7834–7838. doi: 10.1073/pnas.88.17.7834. [DOI] [PMC free article] [PubMed] [Google Scholar]
- Brody DL, Yue DT. Release-independent short-term synaptic depression in cultured hippocampal neurons. J Neurosci. 2000;20:2480–2494. doi: 10.1523/JNEUROSCI.20-07-02480.2000. [DOI] [PMC free article] [PubMed] [Google Scholar]
- Cummings DD, Wilcox KS, Dichter MA. Calcium-dependent paired-pulse facilitation of miniature EPSC frequency accompanies depression of EPSCs at hippocampal synapses in culture. J Neurosci. 1996;16:5312–5323. doi: 10.1523/JNEUROSCI.16-17-05312.1996. [DOI] [PMC free article] [PubMed] [Google Scholar]
- Dittman JS, Regehr WG. Calcium dependence and recovery kinetics of presynaptic depression at the climbing fiber to Purkinje cell synapse. J Neurosci. 1998;18:6147–6162. doi: 10.1523/JNEUROSCI.18-16-06147.1998. [DOI] [PMC free article] [PubMed] [Google Scholar]
- Dobrunz LE, Stevens CF. Heterogeneity of release probability, facilitation, and depletion at central synapses. Neuron. 1997;18:995–1008. doi: 10.1016/s0896-6273(00)80338-4. [DOI] [PubMed] [Google Scholar]
- Elmqvist D, Quastel DM. A quantitative study of end-plate potentials in isolated human muscle. J Physiol. 1965;178:505–529. doi: 10.1113/jphysiol.1965.sp007639. [DOI] [PMC free article] [PubMed] [Google Scholar]
- Forsythe ID, Tsujimoto T, Barnes-Davies M, Cuttle MF, Takahashi T. Inactivation of presynaptic calcium current contributes to synaptic depression at a fast central synapse. Neuron. 1998;20:797–807. doi: 10.1016/s0896-6273(00)81017-x. [DOI] [PubMed] [Google Scholar]
- Goda Y, Stevens CF. Two components of transmitter release at a central synapse. Proc Natl Acad Sci USA. 1994;91:12942–12946. doi: 10.1073/pnas.91.26.12942. [DOI] [PMC free article] [PubMed] [Google Scholar]
- Habets RL, Borst JG. Dynamics of the readily releasable pool during post-tetanic potentiation in the rat calyx of Held synapse. J Physiol. 2007;581:467–478. doi: 10.1113/jphysiol.2006.127365. [DOI] [PMC free article] [PubMed] [Google Scholar]
- Hagler DJ, Jr, Goda Y. Properties of synchronous and asynchronous release during pulse train depression in cultured hippocampal neurons. J Neurophysiol. 2001;85:2324–2334. doi: 10.1152/jn.2001.85.6.2324. [DOI] [PubMed] [Google Scholar]
- He Y, Zorumski CF, Mennerick S. Contribution of presynaptic Na(+) channel inactivation to paired-pulse synaptic depression in cultured hippocampal neurons. J Neurophysiol. 2002;87:925–936. doi: 10.1152/jn.00225.2001. [DOI] [PubMed] [Google Scholar]
- Jensen K, Jensen MS, Bonefeld BE, Lambert JD. Developmental increase in asynchronous GABA release in cultured hippocampal neurons. Neuroscience. 2000;101:581–588. doi: 10.1016/s0306-4522(00)00416-4. [DOI] [PubMed] [Google Scholar]
- Liu G, Choi S, Tsien RW. Variability of neurotransmitter concentration and nonsaturation of postsynaptic AMPA receptors at synapses in hippocampal cultures and slices. Neuron. 1999;22:395–409. doi: 10.1016/s0896-6273(00)81099-5. [DOI] [PubMed] [Google Scholar]
- Lu T, Trussell LO. Inhibitory transmission mediated by asynchronous transmitter release. Neuron. 2000;26:683–694. doi: 10.1016/s0896-6273(00)81204-0. [DOI] [PubMed] [Google Scholar]
- Magelby K. Short-term changes in synaptic efficacy. In: Edelman G, Gall V, Cowan K, editors. Synaptic Function. New York: Wiley; 1987. pp. 21–56. [Google Scholar]
- McAllister AK, Stevens CF. Nonsaturation of AMPA and NMDA receptors at hippocampal synapses. Proc Natl Acad Sci USA. 2000;97:6173–6178. doi: 10.1073/pnas.100126497. [DOI] [PMC free article] [PubMed] [Google Scholar]
- Mennerick S, Zorumski CF. Paired-pulse modulation of fast excitatory synaptic currents in microcultures of rat hippocampal neurons. J Physiol. 1995;488:85–101. doi: 10.1113/jphysiol.1995.sp020948. [DOI] [PMC free article] [PubMed] [Google Scholar]
- Moulder KL, Mennerick S. Reluctant vesicles contribute to the total readily releasable pool in glutamatergic hippocampal neurons. J Neurosci. 2005;25:3842–3850. doi: 10.1523/JNEUROSCI.5231-04.2005. [DOI] [PMC free article] [PubMed] [Google Scholar]
- Murthy VN, Schikorski T, Stevens CF, Zhu Y. Inactivity produces increases in neurotransmitter release and synapse size. Neuron. 2001;32:673–682. doi: 10.1016/s0896-6273(01)00500-1. [DOI] [PubMed] [Google Scholar]
- Otsu Y, Shahrezaei V, Li B, Raymond LA, Delaney KR, Murphy TH. Competition between phasic and asynchronous release for recovered synaptic vesicles at developing hippocampal autaptic synapses. J Neurosci. 2004;24:420–433. doi: 10.1523/JNEUROSCI.4452-03.2004. [DOI] [PMC free article] [PubMed] [Google Scholar]
- Pyle JL, Kavalali ET, Piedras-Renteria ES, Tsien RW. Rapid reuse of readily releasable pool vesicles at hippocampal synapses. Neuron. 2000;28:221–231. doi: 10.1016/s0896-6273(00)00098-2. [DOI] [PubMed] [Google Scholar]
- Rizzoli SO, Betz WJ. Synaptic vesicle pools. Nat Rev Neurosci. 2005;6:57–69. doi: 10.1038/nrn1583. [DOI] [PubMed] [Google Scholar]
- Rosenmund C, Stevens CF. Definition of the readily releasable pool of vesicles at hippocampal synapses. Neuron. 1996;16:1197–1207. doi: 10.1016/s0896-6273(00)80146-4. [DOI] [PubMed] [Google Scholar]
- Schikorski T, Stevens CF. Quantitative ultrastructural analysis of hippocampal excitatory synapses. J Neurosci. 1997;17:5858–5867. doi: 10.1523/JNEUROSCI.17-15-05858.1997. [DOI] [PMC free article] [PubMed] [Google Scholar]
- Schikorski T, Stevens CF. Morphological correlates of functionally defined synaptic vesicle populations. Nat Neurosci. 2001;4:391–395. doi: 10.1038/86042. [DOI] [PubMed] [Google Scholar]
- Schneggenburger R, Meyer AC, Neher E. Released fraction and total size of a pool of immediately available transmitter quanta at a calyx synapse. Neuron. 1999;23:399–409. doi: 10.1016/s0896-6273(00)80789-8. [DOI] [PubMed] [Google Scholar]
- Schneggenburger R, Sakaba T, Neher E. Vesicle pools and short-term synaptic depression: lessons from a large synapse. Trends Neurosci. 2002;25:206–212. doi: 10.1016/s0166-2236(02)02139-2. [DOI] [PubMed] [Google Scholar]
- Segal MM, Furshpan EJ. Epileptiform activity in microcultures containing small numbers of hippocampal neurons. J Neurophysiol. 1990;64:1390–1399. doi: 10.1152/jn.1990.64.5.1390. [DOI] [PubMed] [Google Scholar]
- Stevens CF, Sullivan JM. Regulation of the readily releasable vesicle pool by protein kinase C. Neuron. 1998;21:885–893. doi: 10.1016/s0896-6273(00)80603-0. [DOI] [PubMed] [Google Scholar]
- Stevens CF, Tsujimoto T. Estimates for the pool size of releasable quanta at a single central synapse and for the time required to refill the pool. Proc Natl Acad Sci USA. 1995;92:846–849. doi: 10.1073/pnas.92.3.846. [DOI] [PMC free article] [PubMed] [Google Scholar]
- Stevens CF, Wesseling JF. Activity-dependent modulation of the rate at which synaptic vesicles become available to undergo exocytosis. Neuron. 1998;21:415–424. doi: 10.1016/s0896-6273(00)80550-4. [DOI] [PubMed] [Google Scholar]
- Stevens CF, Wesseling JF. Augmentation is a potentiation of the exocytotic process. Neuron. 1999a;22:139–146. doi: 10.1016/s0896-6273(00)80685-6. [DOI] [PubMed] [Google Scholar]
- Stevens CF, Wesseling JF. Identification of a novel process limiting the rate of synaptic vesicle cycling at hippocampal synapses. Neuron. 1999b;24:1017–1028. doi: 10.1016/s0896-6273(00)81047-8. [DOI] [PubMed] [Google Scholar]
- Stevens CF, Williams JH. “Kiss and run” exocytosis at hippocampal synapses. Proc Natl Acad Sci USA. 2000;97:12828–12833. doi: 10.1073/pnas.230438697. [DOI] [PMC free article] [PubMed] [Google Scholar]
- Wang LY, Kaczmarek LK. High-frequency firing helps replenish the readily releasable pool of synaptic vesicles. Nature. 1998;394:384–388. doi: 10.1038/28645. [DOI] [PubMed] [Google Scholar]
- Wesseling JF, Lo DC. Limit on the role of activity in controlling the release-ready supply of synaptic vesicles. J Neurosci. 2002;22:9708–9720. doi: 10.1523/JNEUROSCI.22-22-09708.2002. [DOI] [PMC free article] [PubMed] [Google Scholar]
- Wu LG, Borst JG. The reduced release probability of releasable vesicles during recovery from short-term synaptic depression. Neuron. 1999;23:821–832. doi: 10.1016/s0896-6273(01)80039-8. [DOI] [PubMed] [Google Scholar]
- Xu J, Wu LG. The decrease in the presynaptic calcium current is a major cause of short-term depression at a calyx-type synapse. Neuron. 2005;46:633–645. doi: 10.1016/j.neuron.2005.03.024. [DOI] [PubMed] [Google Scholar]
- Zucker RS, Regehr WG. Short-term synaptic plasticity. Annu Rev Physiol. 2002;64:355–405. doi: 10.1146/annurev.physiol.64.092501.114547. [DOI] [PubMed] [Google Scholar]