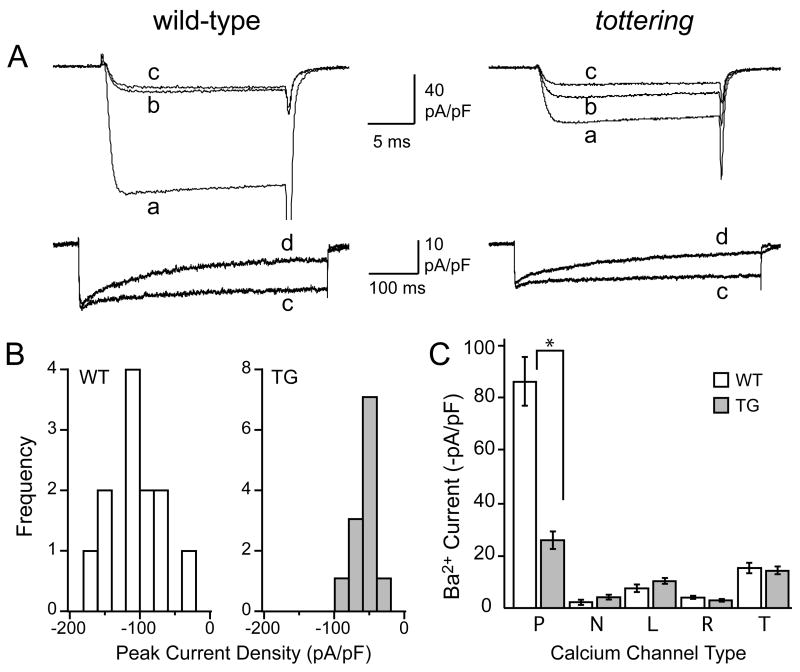
Figure 1. Ca2+ channel complement in PCs at postnatal day 6.
A) Representative current recordings from 6 day-old wild-type and tottering PCs (as marked) in response to depolarizing voltage steps from −80 to 0 mV for 20 ms (upper panels) or from −80 to −10 mV for 500 ms (lower panels). Superimposed currents were taken under control conditions (a), then during exposure to ω-agatoxin IVA (b), then ω-agatoxin IVA + ω-conotoxin GVIA (c), then ω-agatoxin IVA + ω-conotoxin GVIA + nimodipine (d), each at saturating concentration, as noted in the text. B) Amplitude histograms illustrating the distribution of peak Ba2+ current densities measured in the sample of P6 wild-type (WT) and tottering (TG) PCs. C) Histogram illustrating the peak Ba2+ current densities through the pharmacologically-isolated calcium channel types recorded from wild-type (white bars) and tottering (grey bars) PCs (*, p<0.001).

