Abstract
Hydroxylations of octane and lauric acid by Cytochrome P450-BM3 (CYP102A1) wild-type and three active site mutants—F87A, L188Q/A74G, and F87V/L188Q/A74G—were rationalized using a combination of substrate orientation from docking, substrate binding statistics from molecular dynamics simulations, and barrier energies for hydrogen atom abstraction from quantum mechanical calculations. Wild-type BM3 typically hydroxylates medium- to long-chain fatty acids on subterminal (ω−1, ω−2, ω−3) but not the terminal (ω) positions. The known carboxylic anchoring site Y51/R47 for lauric acid, and hydrophobic interactions and steric exclusion, mainly by F87, for octane as well as lauric acid, play a role in the binding modes of the substrates. Electrostatic interactions between the protein and the substrate strongly modulate the substrate's regiodependent activation barriers. A combination of the binding statistics and the activation barriers of hydrogen-atom abstraction in the substrates is proposed to determine the product formation. Trends observed in experimental product formation for octane and lauric acid by wild-type BM3 and the three active site mutants were qualitatively explained. It is concluded that the combination of substrate binding statistics and hydrogen–atom abstraction barrier energies is a valuable tool to rationalize substrate binding and product formation and constitutes an important step toward prediction of product ratios.
Keywords: Cytochrome P450, enzyme catalysis, substrate dynamics, substrate activation barriers, essential dynamics, protein dynamics
Cytochromes P450 (CYPs) constitute one of the most important families of enzymes involved in the metabolism of drugs and their pharmacological and toxicological effects. CYPs can catalyze oxidation and reduction reactions, and their versatility and capacity to introduce one atom of oxygen into nonactivated bonds makes them an especially interesting class of enzymes in biocatalysis (Guengerich 2002a), notably for the hydroxylation of nonactivated compounds like alkanes (Peters et al. 2003), often in a regio- and enantioselective manner (Schneider et al. 1999; Glieder et al. 2002). Several mechanisms for the mono-oxygenase activity of CYPs have been proposed (Meunier et al. 2004). For alkane hydroxylation, radical formation by an initial H-abstraction followed by recombination with oxygen is thought to be the most likely mechanism, mainly based on the observation of large kinetic isotope effects (Koymans et al. 1993a; Jones et al. 2002). H-abstraction has been shown to be the rate-limiting step for several isoforms (Guengerich 2002b).
One of the Cytochromes P450 that has been used as alkane hydroxylase is CYP102A1 (BM3) from Bacillus megaterium. This is a water-soluble enzyme that has a very high activity and turnover capacity (Matson et al. 1977; Munro et al. 2002), making it intrinsically suited for biotechnological applications. In its wild-type (WT) form, BM3 catalyzes the hydroxylation and epoxidation of unbranched medium- and long-chain saturated fatty acids (from lauric, C12, to palmitic acid, C16) and unsaturated fatty acids (like eicosapentaenoic and arachidonic acid, C20) at the subterminal positions (Graham-Lorence et al. 1997). Interestingly, the regio- and substrate-selectivity of BM3 are known to be changed drastically by specific site-directed mutations (Oliver et al. 1997b; Appel et al. 2001) and by random mutagenesis and directed evolution approaches (Glieder et al. 2002). Several extensively mutated variants of BM3 have recently been reported for the first time that convert octane into 1-octanol, although not at high activity and regioselectivity (Peters et al. 2003).
For large BM3 substrates such as eicosapentaenoic acid, it is suggested that binding mode dominates regiospecific metabolite formation (Graham-Lorence et al. 1997; Cowart et al. 2001), but for smaller substrates, predicted binding modes could not fully explain measured metabolites (Graham-Lorence et al. 1997; Appel et al. 2001; Cowart et al. 2001). In addition, large movements in the protein structure have been associated with ligand binding (Modi et al. 1996). This implies that there will probably be a balance between substrate binding orientations and regiodependent chemical reactivity within the substrate (Appel et al. 2001; Ensing et al. 2004). Most computational methods used so far for prediction of substrate- and regioselectivities of CYPs have relied on the assumption that either a unique binding orientation of the substrate is dominant, as is the case for, for example, R-camphor to CYP101 (cam) (De Voss and Ortiz de Montellano 1995; De Voss et al. 1997; Verras et al. 2004), or that the dominant factor are so-called (chemical) hot-spots in the substrate that are prone to react with the enzyme reactive center (Koymans et al. 1993b; Lightfoot et al. 2000; Jones et al. 2002). For several CYPs, product formation has been explained by combining substrate dynamics from molecular dynamics (MD) simulations and substrate activation barriers from quantum mechanics (QM) calculations (De Graaf et al. 2005b), i.e., for the bacterial CYP101 (cam) (Jones et al. 1993; Harris and Loew 1995; Keseru et al. 1997) and CYP107A (EryF) (Harris and Loew 1996) and the mammalian CYP2E1 (Park and Harris 2003), but in these cases substrates were relatively rigid and bound in relatively well-defined binding modes.
The aim of this study was the rationalization of product formation of BM3 oxygenase activity toward the flexible aliphatic substrates octane and lauric acid by WT and the F87A, L188Q/A74G, and F87V/L188Q/A74G mutants. For this we combined computational methods in a four-stage procedure: (1) docking is used to obtain initial approximate substrate binding orientations; (2) MD simulations of the substrate bound to the enzyme to estimate the statistics of substrate binding orientations; (3) semi-empirical QM calculations of activation energy barriers in the substrate to estimate and compare substrate activation barriers at different locations in the substrates; and (4) the statistics of substrate binding and the substrate activation barriers are combined to rationalize the product formation. The combination of substrate binding statistics and substrate activation barrier energies is used as a basis for better understanding of the BM3 monooxygenase activity toward aliphatic substrates, and provides an important step toward the prediction of regioselectivity in product formation.
Results
WT BM3 and mutant protein models
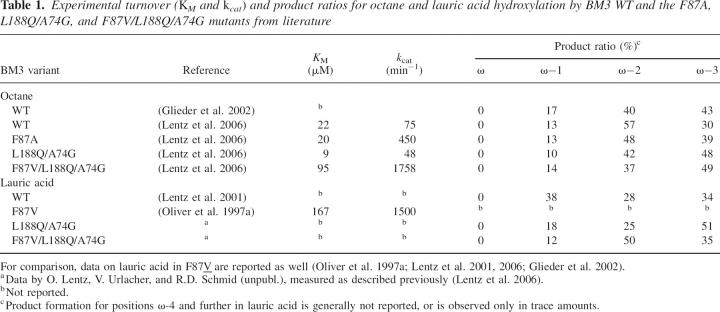
After energy minimization of the F87A, L188Q/A74G, and F87V/L188Q/A74G BM3 mutant structures, the root-mean-square deviation (RMSD) of backbone positions with respect to the WT crystal structure was 0.85 Å for the F87A model, 1.2 Å for L188Q/A74G, and 1.2 Å for F87V/L188Q/A74G, indicating negligible overall structural changes in the protein (the resolution of the WT X-ray structure is 1.65 Å) (Sevrioukova et al. 1999). Visual inspection of the active site binding cavity surface showed that a change toward the “closed,” substrate-bound state occurred, similar to that described by Pylypenko and Schlichting (2004) (data not shown). All available experimental data on product formation for octane and lauric acid by WT and these mutants is presented in Table 1 (Oliver et al. 1997a; Lentz et al. 2001, 2006; Glieder et al. 2002). In Figure 1A the location of the mutated residues can be seen in relation to the heme, and the substrate binding site is represented by snapshots of bound octane from the MD simulations.
Table 1.
Experimental turnover (K M and k cat) and product ratios for octane and lauric acid hydroxylation by BM3 WT and the F87A, L188Q/A74G, and F87V/L188Q/A74G mutants from literature
Figure 1.
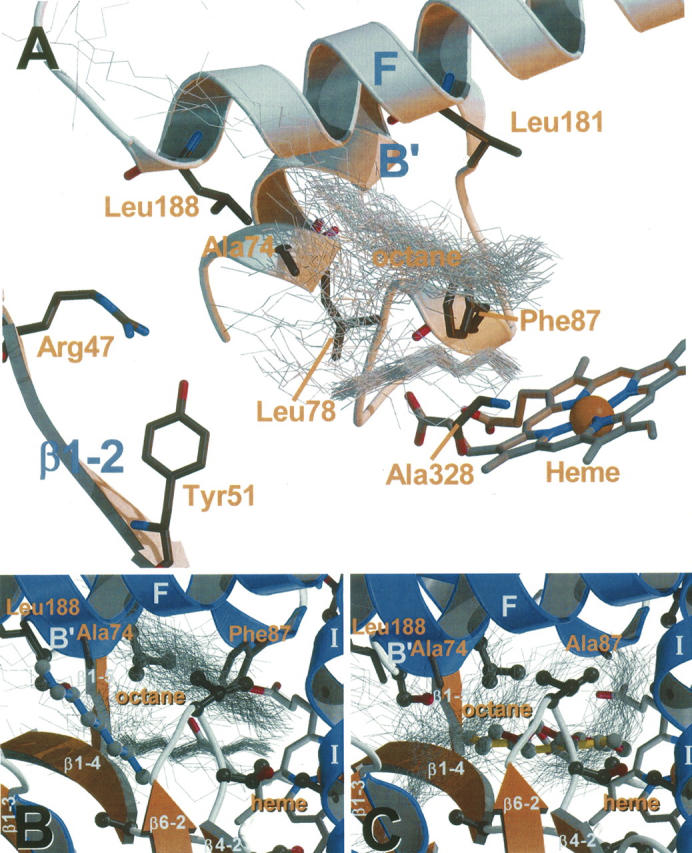
(A) BM3 active site and residues mentioned in the text. Snapshots of bound octane conformations from MD simulations and selected secondary structure elements are shown for reference and labeled according to PDB id 1bu7. (B) Illustrative example of substrate binding and dynamics in BM3. Starting conformations of octane in the BM3 WT are shown in ball and sticks, snapshots from MD simulations are shown in thin gray lines. The three residues mutated in the three mutants, Ala74, Phe87/Ala87, and Leu188 are shown in ball and stick. (C) Id. for octane in the F87A mutant.
Substrate docking
The docked conformations of octane and lauric acid in BM3 WT and the three mutants showed a wide variety of distances and orientations of each of the substrates in the active site cavity. Distances between substrate and heme iron from 2 Å up to around 20 Å were found, and many different orientations were observed as well, e.g., for lauric acid binding with the carboxylate distal as well as proximal to the iron and many possibilities in between. Only negligible differences between docking results were observed with and without atomic or molecular oxygen on the heme iron during the docking. Because oxygen parameters for MD simulations in the Gromos 43a1 force field are not well-validated, we chose to leave the sixth iron–ligand out altogether. Docking poses of the substrates that were in proximity to active site residues and the heme and were significantly different (RMSD >1 Å) were selected from the docked conformations and used as starting points for MD simulations. For octane, five distinct docking poses were found in the WT, seven in F87A, seven in L188Q/A74G, and nine in F87V/L188Q/A74G. For lauric acid, four docking poses were found in the WT, 11 in F87A, five in L188Q/A74G, and three in F87V/L188Q/A74G. Comparing all binding poses closer than 10 Å to the heme–iron for the two substrates in the WT and the mutant proteins, four distinct relevant poses were found for octane and four for lauric acid.
Substrate binding and dynamics
In Figure 1, B and C, two typical examples are shown of many different binding conformations of octane (thin gray lines) observed during the MD simulations in the WT and F87A, respectively; the starting conformations are shown as well (in ball and stick). The different bound conformations for octane in the WT and the F87A mutant are immediately apparent from Figure 1. During the MD simulations, the substrates octane and lauric acid showed much more variation in conformations and orientations than was apparent from the docking; moreover, the docked conformations were neither representative for the MD-generated conformations nor for the differences between the WT and mutants (see Fig. 1B,C for octane in the WT and F87A, respectively). In fact, the orientational sampling of individual MD simulations overlapped sufficiently to assume that the simulations were independent of the starting orientations, and statistical averaging over the simulations was therefore considered appropriate.
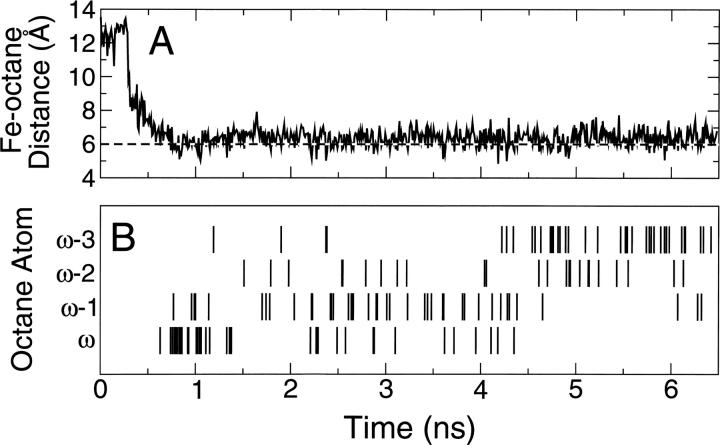
For all MD simulations, distances between the heme iron and the terminal and subterminal carbon atoms (i.e., ω to ω−4, where ω is distal to the carboxylic group) in octane and lauric acid were calculated every picosecond to determine which atom was closest to the iron at that time. Figure 2A shows the minimum distance between octane and the heme iron for one simulation of octane in the WT, and Figure 2B shows which of the carbon atoms in octane is closest at that time if it is within the 6 Å cutoff. Octane can move around in much of the active site region irrespective of the starting position, which is also apparent from Figure 1.
Figure 2.
Orientation and dynamics of octane in BM3 WT during an example MD simulation. (A) Distance between the heme iron and the closest octane carbon atom vs. time. (B) The corresponding atom index (i.e., ω, ω−1, ω−2, or ω−3) of the closest carbon atom in octane vs. time.
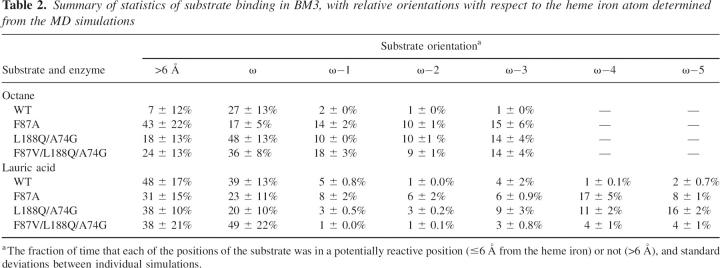
A maximum distance of 6 Å for the Fe–C distance was chosen as “reactive” and corresponds to a distance of about 4–4.5 Å between the oxygen bound to the heme iron during the catalytic cycle and a C–H in the substrate, i.e., a short enough distance for hydroxylation (Schoneboom et al. 2004). The time during each MD simulation that each of the carbon atoms in the substrates was within this 6 Å cutoff from the heme iron, i.e., at a reactive distance, was determined, as summarized in Table 2 for octane and lauric acid in BM3 WT and the three mutants.
Table 2.
Summary of statistics of substrate binding in BM3, with relative orientations with respect to the heme iron atom determined from the MD simulations
In all four BM3 variants, octane and lauric acid were bound with strong preference for the ω carbon near the heme iron. This effect was most profound for octane and lauric acid in the WT and for lauric acid in the F87V/L188Q/A74G mutant. Only for octane in the F87A and F87V/L188Q/A74G mutants was this preference less pronounced. For the ω−1, ω−2, and ω−3 carbon atoms along the aliphatic chains, the preference for binding of different carbon atoms depends on the substrate as well as the enzyme (as shown in Table 2). For octane in the F87A mutant, all four positions have nearly equal preference for approaching the heme iron. In the L188Q/A74G and F87V/L188Q/A74G mutants, however, octane bound preferentially with its ω-position, but not exclusively like in the WT. The dynamic behavior of lauric acid in the active site during the MD simulations was different from that of octane, as can been seen in Table 2. During the simulations, the carboxyl-anion of lauric acid formed a salt bridge with Arg47 and was hydrogen-bonded to Tyr51, making lauric acid much more restricted to fluctuations around its initial position.
The differences observed between separate simulations for each combination of substrate and enzyme are expressed as standard deviation (Table 2), and were generally relatively small. The trends observed clearly show that the preference for different reactive binding orientations of octane and lauric acid depends on the properties of the BM3 WT or mutant.
Protein dynamics
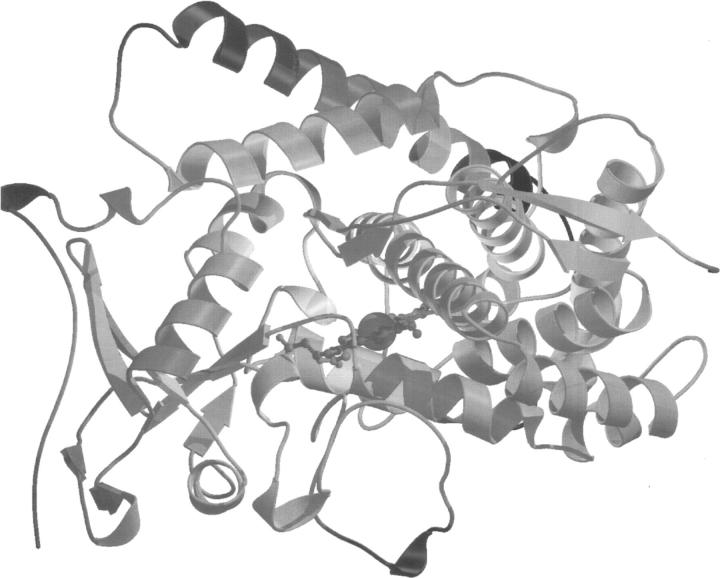
In the course of several nanosecond MD simulations, the RMSD for the protein backbone with respect to the starting structure increased gradually to a steady plateau at ∼3 Å for BM3 WT and between 3 and 3.5 Å for the mutants; only in seven out of 44 simulations deviations of ∼4 Å were found for the L188Q/A74G and F87V/L188Q/A74G mutants. These structural fluctuations are very reasonable for this size and type of protein on a time scale of nanoseconds, and indicate good dynamical stability of the protein during simulation (Hess 2002). Moreover, most of these motions were located in loop regions that are relatively far away from the binding pocket, as is shown in Figure 3. The “closing” motion of the binding cavity, toward a substrate-bound state, which was already observed during the initial minimization step and that has been observed previously (Pylypenko and Schlichting 2004), continued during the MD simulations (data not shown). This closing motion, therefore, is mainly caused by side chain rearrangements.
Figure 3.
The BM3 protein structure and MSF per residue in the first two essential modes over all simulations combined. Dark (mobile) and light (static) shading correspond to an MSF of, respectively, around 5 nm and zero.
Further analysis of the protein dynamics was performed using essential dynamics (ED) analysis over all MD simulations combined (Amadei et al. 1993; Hünenberger et al. 1995). For the whole enzyme, the two largest general essential modes of all trajectories combined describe 22% of the total MSF, for only the 54 residues surrounding the active site this was 27%. This is less than is seen for ED analysis of single simulations, where the first two modes typically describe 40%–60% of the MSF (Amadei et al. 1993; Hünenberger et al. 1995). This difference in MSF described by the first two modes can be ascribed to the fact that in the current case, many simulations (about 35) were analyzed simultaneously and together these represent a much more diverse sampling of the phase-space of the protein than one single simulation could achieve. ED projections of simulations of the BM3 WT and the three mutants (data not shown) yield a significant difference in dynamical behavior for the active site but less for the whole protein. Average projections were well-separated for the WT and F87A, versus the other two mutants on the first essential mode, and for F87V/L188Q/A74G, versus the other three mutants on the second essential mode. For the whole protein these differences were not significant. Interestingly, similar ED analysis revealed differences neither in protein dynamics nor in active site dynamics with the two substrates bound (data not shown).
Substrate H-abstraction energies
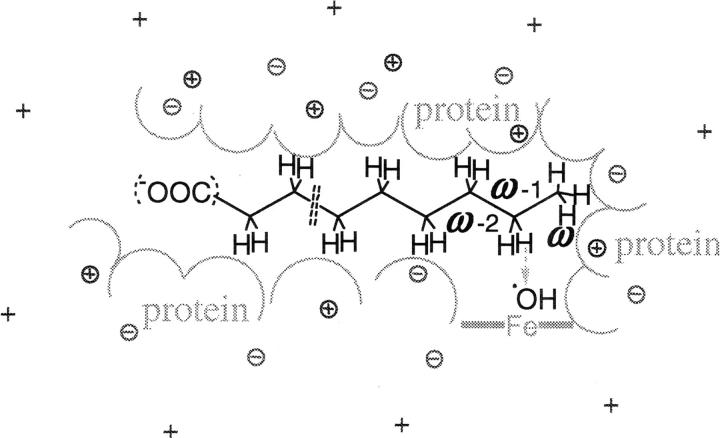
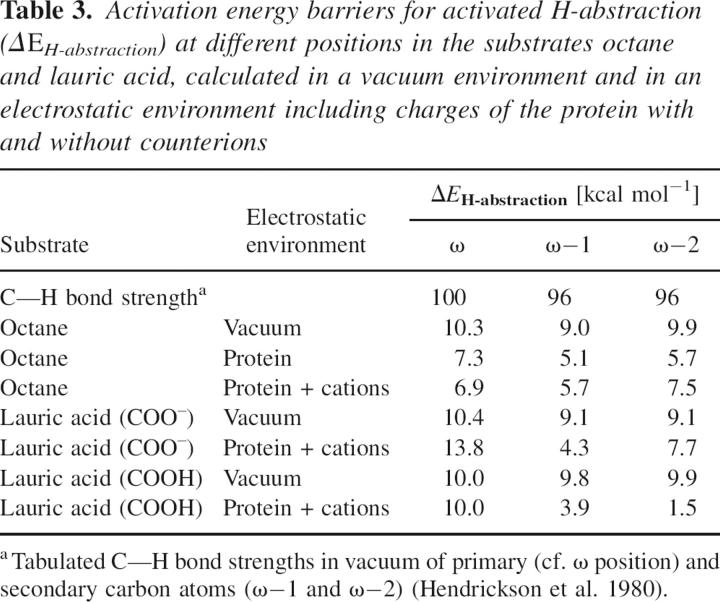
Activation barrier energies for the H-abstraction step (ΔE H-abstraction) were obtained from unrestricted Hartree-Fock (UHF) AM1 SE-QM calculations on octane and lauric acid with a hydroxyl radical as reactive species (Jones et al. 2002). Barrier energies (ΔE H-abstraction) were calculated in vacuo as well as surrounded by charged groups of the protein with and without counterions outside the protein, shown schematically in Figure 4. For the BM3 mutants studied, at this level of approximation there were no differences in the electrostatic interactions between the enzyme and the substrate. In all conditions studied, the ω position was predicted to be the least reactive as indicated by the highest H-abstraction barriers (Table 3). Generally, ω−1 had a slightly higher barrier than ω−2. The H-abstraction barriers for ω−3 were taken the same as for ω−2, both having secondary carbon atoms as neighbors on both sides. In addition, differences in H-abstraction barriers between ω−1 and ω−2 were smaller than between ω and ω−1 in all but one case. The trends in H-abstraction barriers between ω, ω−1, and ω−2 were consistent for octane and lauric acid. The dependence of the H-abstraction barriers on substrate conformation—aliphatic torsional angles—and orientation with respect to the hydroxyl radical—distances and angles between the reacting C, H, and O atoms—were found to be negligible (data not shown).
Figure 4.
Schematic drawing of the setup for the SE-QM substrate activation energy barrier calculations and those parts of the “environment” of the substrate that were included in the calculations: substrate (alkane chain in black), hydroxyl radical (•OH), charged residues in protein (positive and negative circled crosses), counterions (cross: +) and schematically the inner surface of the binding cavity in gray. The arrow indicates the reaction path calculated for the H-abstraction from the substrate. The active site cavity and heme-iron complex (—Fe—), although not explicitly included in the qm calculations, are schematically depicted in gray.
Table 3.
Activation energy barriers for activated H-abstraction (ΔE H-abstraction) at different positions in the substrates octane and lauric acid, calculated in a vacuum environment and in an electrostatic environment including charges of the protein with and without counterions
Interestingly, when the H-abstraction activation barrier energies (ΔE H-abstraction) were calculated in the enzyme environment (Table 3) for octane and neutral lauric acid, all barriers were lowered considerably, and with inclusion of explicit counterions in the calculation, the H-abstraction barriers for the ω-position decreased even more. For lauric acid in the protein the barriers for ω−1 H-abstraction, when compared to ω (and ω−2), were lowered even further than in vacuo. For octane, on the other hand, inclusion of the enzyme environment lowered H-abstraction barriers for ω, although here as well ω−1 remains the most favorable (Table 3). Inclusion of counterions decreased the barriers for the ω-position in octane slightly, but increased them for ω−1 and even more for ω−2. This reflects the importance of the electrostatic protein surroundings for the H-abstraction step in octane and lauric acid.
Discussion
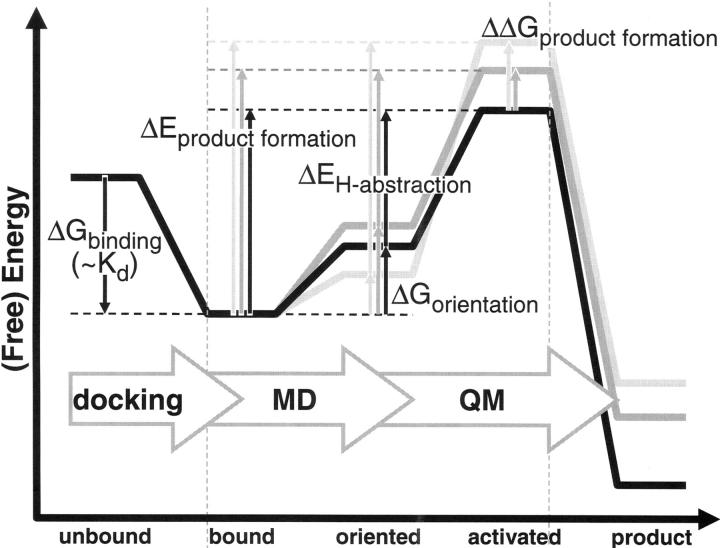
The aim of this study was to rationalize the regioselectivity of hydroxylation of octane and lauric acid by WT CYP102A1 (BM3) and three active site mutants—F87A, L188Q/A74G, and F87V/L188Q/A74G. In Figure 5 an energy diagram of intermediate states considered is presented, going from unbound substrate to product. The ratio of hydroxylated products formed depends on the relative rate of each of the corresponding reactions. The rate of the reaction depends on the activation energy (ΔE product formation) and the measured product ratios, and it is, therefore, corresponding to the differences in free energy of activation (ΔΔG product formation). In the present study, this process has been described in two discrete steps: first, the free energy of orientation (ΔG orientation) of the bound ligand in the active site cavity and, second, the subsequent initiation of the reaction by overcoming the activation energy for H-abstraction (ΔE H-abstraction) of the substrate by activated iron–oxygen species. The sum of these last two energies, therefore, should correspond to the overall rate of product formation, and differences between them correspond to observed product ratios.
Figure 5.
Schematic representation of different states and corresponding (free) energy differences considered in this study. Docking was used to go from unbound to bound state, but since the free energy of binding (ΔG binding) would be identical for all products formed from a substrate, no free energy barriers (ΔG binding) were calculated for this step. MD was used to calculate the free energy associated with substrate orientation (ΔG orientation). QM was used to calculated the activation barrier for H-abstraction (ΔE H-abstraction). Experimental product formation corresponds to the (free) energy barrier of product formation (ΔE product formation), and can be calculated as the sum of the orientation free energy barrier and the energy barrier of H-abstraction (ΔG orientation + ΔE H-abstraction). Finally, product ratios correspond to the relative free energy of product formation (ΔΔG product formation).
Docking has been used to obtain starting conformations of bound substrates. For a given substrate, the change in free energy associated with the first step, i.e., substrate binding (ΔG binding), is identical for all possible products of that substrate and is, therefore, not considered in the current study. Statistics of substrate binding orientations were obtained from MD simulations and H-abstraction activation energy barriers (ΔE H-abstraction) at different positions in the substrates from QM calculations. The combination of substrate binding orientation and H-abstraction activation is subsequently used as a basis for a better understanding of the BM3 monooxygenase activity toward aliphatic substrates, and provides an important step toward the quantitative prediction of product formation.
Binding and dynamics
In Cytochromes P450, the substrate is believed to bind before molecular oxygen binds to the iron (Guengerich 2002b). Recent advances in experimental techniques that shed light on details of the P450 catalytic cycle are impressive (e.g., Davydov et al. 2005; Sono et al. 2005); however, it is still impossible to determine whether the substrate binding orientation is influenced by the presence of oxygen at the heme–iron. Although several accurate force field parameter sets for this type of atomic species are available, none is validated for use with the GROMOS “43a1” force field (Daura et al. 1996; Van Gunsteren et al. 1996). Recent work on catalytic site prediction in CYP2D6 has also been successful using the same force field without explicit inclusion of the iron–oxygen (De Graaf et al. 2005a). During the MD simulations described in the current study, therefore, no atomic or molecular oxygen was located at the sixth coordination position of the heme iron.
By using MD simulations, entropic factors in the determination of product formation are explicitly taken into account. In the simulations presented, octane and lauric acid were found to bind in a broad distribution of conformations (see Fig. 1B, C; Table 2), corresponding with the high internal flexibility of typical fatty acid substrates for BM3 and their small size with respect to the binding cavity (Ravichandran et al. 1993; Sevrioukova et al. 1999). This substrate flexibility corresponds with large substrate movements that have been implicated in the catalytic mechanism of BM3 (Modi et al. 1996; Appel et al. 2001).
The binding orientations found were strongly biased toward the ω position. For the other positions (ω−1, ω−2, and ω−3), the trends observed in measured product formation of octane and lauric acid between WT and the mutants were qualitatively reproduced by the statistics of substrate binding orientations derived from the MD simulations. In particular, Phe87 (see also Fig. 1A) is implicated in determining regioselectivity (Graham-Lorence et al. 1997; Cowart et al. 2001) and plays a key role in hydrophobic interactions shifting the substrates away from a ω-orientation. For lauric acid, the anchoring of its carboxyl group to Arg47 and Tyr51, postulated for crucial ligand interactions in BM3 (Haines et al. 2001; Glieder et al. 2002; see Fig. 1A), was indeed a dominant factor in determining the binding statistics of this substrate.
In the current MD simulations, the dynamics of the active site as analyzed with ED were influenced by the active site mutations investigated (Fig. 3). The dynamics of the rest of the protein appeared unaffected by the mutations, indicating that the influence of the mutations on the protein dynamics does not extend much beyond the active site. The dynamics of neither the active site nor the whole protein were affected by binding of octane and lauric acid. Conversely, ligand binding itself did not seem to be affected by the changes in protein dynamics resulting from the mutations.
H-abstraction barriers
The current QM calculations were used to quantify relative regioselective H-abstraction barriers as a measure for reactivity of the octane and lauric acid (see Table 3). Although in the present QM calculations no distinction could be made between the WT and the mutants studied, the method would be able to distinguish mutations involving addition or removal of charged residues.
For octane and neutral lauric acid, inclusion of the electrostatic protein environment lowered H-abstraction barriers overall, and addition of explicit counterions lowered them even further. In contrast, for deprotonated lauric acid, the H-abstraction barriers for ω increased with inclusion of the protein charges or counterions. This suggests that neutralizing the anionic charge of the carboxylic acid group in lauric acid may be a crucial factor for the reaction to proceed at the ω position. The modulations of the H-abstraction barrier height by the surrounding electrostatics reflect the importance of the electrostatic surroundings for the H-abstraction step and may be a contributing factor in the actual catalytic function of the enzyme.
The observed differences in H-abstraction barriers show that modifications of the electrostatic properties of the enzyme (e.g., by introducing or removing charged side chains, or changing pH) (Ost et al. 2000; Li et al. 2001) could be used to tune the reactivity of different positions in alkane substrates. Indeed, several BM3 mutants which change turnover and product ratios of polycyclic aromatic hydrocarbons without changing the iron spin state have been reported (Carmichael and Wong 2001), which supports the suggestion that substrate binding orientations and electrostatic interactions between substrate and enzyme also affect the enzymatic action.
Predicting product formation
The relatively high H-abstraction barrier energies (ΔE H-abstraction) for the ω position (see Table 3), may explain the absence of ω-hydroxylated product but not the observed differences between WT and the mutants (Table 1). On the other hand, the distribution of binding orientations (see Table 2) explains most of the differences between the WT and the three mutants, but not the absence of ω-hydroxylated product (Table 1).
From the MD simulations, free energies associated with different orientations of the substrates (ΔG orientation) were calculated based on the statistics of all simulations of each combination of substrate and enzyme, as explained further in Materials and Methods. In Figure 6A the calculated free energies of orientation (ΔG orientation) are shown. A lower energy corresponds to a higher overall fraction oriented (cf. Table 2). The QM calculations yield the activation energies of the H-abstraction reaction (ΔE H-abstraction). In Figure 6B the calculated H-abstraction barriers (cf. Table 3) are also shown. Subsequent to H-abstraction the product is formed and finally released from the enzyme; these steps are not taken into account in this study.
Figure 6.
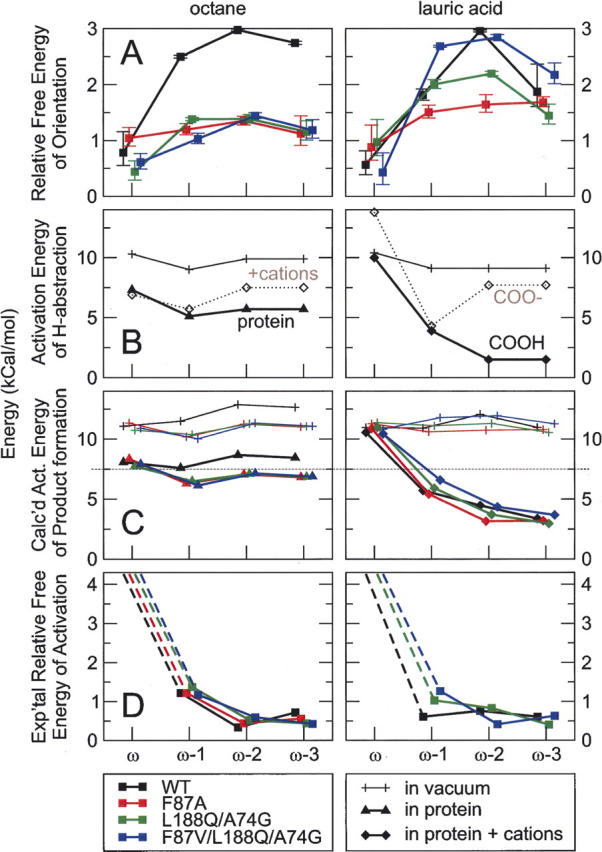
Orientation, dynamics, H-abstraction, and product formation of octane and lauric acid for BM3 WT and mutants expressed as free energies and activation energies. For clarity, traces of WT and the mutants have been given slight offsets in the horizontal direction; WT, single, double, and triple mutant from left to right. (A) Free energy of orientation (ΔG orientation) of octane and lauric acid for the WT and the three mutants cf. the population of orientations in Table 2, and standard deviation shown as error bars. (B) Activation energy of H-abstraction (ΔE H-abstraction) for octane and lauric acid cf. Table 3. (C) The calculated activation energy for product formation (ΔG product formation = ΔG orientation + ΔE H-abstraction) for octane and lauric acid. (D) The relative free energy corresponding to the experimentally determined product formation (ΔΔG product formation) for octane and lauric acid, cf. Table 1. For the ω positions an approximate detection limit of 0.1% was used for calculating the apparent activation energy.
Taking together the free energy of orientation (ΔG orientation) and activation energy of H-abstraction (ΔE H-abstraction) into the calculated activation energy of product formation (ΔE product formation) is proposed to rationalize product formation for octane and lauric acid hydroxylation by BM3, as shown in Figure 6C. Taking a cutoff value of 7.5 kcal/mol as the maximum activation barrier that could be overcome by the enzyme, leading to product formation, the overall absence of ω hydroxylated product for octane and lauric acid can be explained. In addition, the nearly absent hydroxylation of octane by BM3 WT found experimentally can thus also be explained.
For octane, using the orientational energy (ΔG orientation) for BM3 WT and mutants and the H-abstraction barriers (ΔE H-abstraction) in the protein without counterions, the calculated activation energy (ΔE product formation) for ω hydroxylation was only slightly higher than for the other positions (Fig. 6C). Although the trend is correct, this relatively low activation energy (ΔE product formation) for the ω position would lead to a predicted ω-hydroxylation that does not accurately match the experimental results, where no ω-hydroxylation was measured (Table 1). Furthermore, for the ω−1 position, a slightly lower activation energy (ΔE product formation) was calculated than for ω−2, which neither completely matches the experimental observation. For lauric acid, on the other hand, using the H-abstraction barriers (ΔE H-abstraction) obtained with the protonated carboxylic acid (—COOH) in the protein with counterions, the relative ranking of ω, ω−1, ω−2, and ω−3 hydroxylation was reproduced rather well (Table 1). Also, the relatively high amount of ω−1 hydroxylated lauric acid formed by the WT was reproduced well, in that the calculated activation energy (ΔE product formation) for ω−1 hydroxylation in the WT was lower than in the L188Q/A74G and F87V/L188Q/A74G mutants.
The combination of almost exclusive “ω” binding orientation (ΔG orientation) of octane in the WT and a high activation barrier (ΔE H-abstraction) at the “ω” position explains the near absence of activity of BM3 WT toward octane. In correspondence with this, the closely homologous CYP102A3 WT (from Bacillus subtilis) does not convert octane, while a CYP102A3 triple mutant containing the F-V mutation corresponding to the BM3 (CYP102A1) F87V produces only 11% 1-octanol, and a CYP102A3 double mutant containing the “wild-type” F produces 45% 1-octanol, although at a very low turnover and coupling efficiency (Lentz et al. 2004, 2006). Another crucial mutation in CYP102A3 is A330V (corresponding to A328 in BM3), which narrows the binding pocket and hence restricts variations in the substrate binding modes considerably. The corresponding A328V mutation is reported as well for BM3 in an 11-mutant (most nonactive-site residues), which produces modest amounts (10%) of 1-octanol, but at even lower turnover and coupling (Peters et al. 2003). It is interesting to note the existence of isoforms and mutants that are able to form ω-hydroxylated alkane products and, thus, would be useful to be investigated whether indeed in those cases the electrostatic properties of the isoform or mutant also modulates the activation barrier at the ω-position to enable ω-hydroxylation.
The high activation barriers (ΔE H-abstraction) for the charged (unprotonated) lauric acid at the ω position indicate a possible important role of binding of the carboxyl group to the Arg47/Tyr51 anchoring point in neutralizing the negative carboxylic charge. For deprotonated octanoic acid (—COO–), similarly high activation barriers were found (data not presented), but octanoic acid is shorter than lauric acid and therefore unable to reach from the Arg47/Tyr51 binding site to the vicinity of the heme–iron (data not presented). This is in correspondence with the very low (or no) turnover of octanoic acid by BM3 WT. A recently reported L75T/L181K mutant that introduces a cationic/H-bonding site closer to the heme results in a fivefold increased catalytic efficiency for octanoic acid (Ost et al. 2000).
Our relatively simple approach is capable of capturing several important features of the BM3 catalyzed hydroxylation of alkanes and alkanoic acids. Clearly, there is a certain room for improvement of our methodology, and several recent and well-established QM/MM approaches may be applied for this purpose.
Conclusions
Understanding the oxygenation activity of CYP biotransformation enzymes is crucial to the prediction of ADME-Tox properties of drugs (Clark and Grootenhuis 2002; Vermeulen 2003; Hou and Xu 2004) and the successful application of these enzymes in (industrial) biocatalysis (Ost et al. 2000; Li et al. 2001). Trends observed in experimentally determined product formation for octane and lauric acid by the WT enzyme and three active site mutants were qualitatively explained by our calculations including MD simulations to obtain relative free energies for alternate binding orientations (ΔG orientation) and QM calculations to obtain the activation energies for the rate-limiting H-abstraction (ΔE H-abstraction).
Our computational approach helps explain the recently reported regioselective product formation for octane and lauric acid of wild-type and engineered CYP102A1 (F87A, L188Q/A74G, and F87V/L188Q/A74G mutants), some of which already show some preference for hydroxylation at the ω-position in octane (Peters et al. 2003). In addition to the known carboxylic anchoring site Arg47/Tyr51, hydrophobic interactions and hydrophobic interactions and steric exclusion, mainly by Phe87, play a determining role in the binding modes of the substrates. Electrostatic interactions between the protein and the substrate strongly modulate the substrate's regiodependent H-abstraction barriers. The fine details of the electrostatic and steric interactions between the BM3 enzyme and the substrate are important to capture the effects of mutations, changes in protein conformation, substrate orientations, and protonation state, as we have shown in our current calculations.
More quantitative estimates of the H-abstraction barrier energies (ΔE H-abstraction) could be obtained by extending the method applied here to include a more accurate description of the protein, heme, and possibly the solvent surrounding the substrate during calculation of the H-abstraction. Nevertheless, the current approach has provided a better understanding of the mechanisms underlying the substrate binding, H-abstraction, and product formation in CYP102A1, and constitutes an important step toward more quantitative predictions of product ratios and substrate turnover.
Materials and methods
CYP102A1 (P450 BM3) protein structures
The structure of the CYP102A1 (BM3) WT was taken from the ligand-free crystal structure (PDB id 1bu7) (Sevrioukova et al. 1999). Water molecules present in the X-ray structure were not included during docking, while explicit water was added for the MD simulations. Structures of the mutants F87A, L188Q/A74G, and F87V/L188Q/A74G were constructed from the WT by point mutation using the Modeller software package (Marti-Renom et al. 2000) keeping all overlapping atoms and using identical rotamer states, and energy minimized (EM) using the CHARMM software package and force field (Brooks et al. 1983; Foloppe and MacKerell Jr. 2000).
Substrate binding and dynamics: automated docking and MD simulations
The GOLD software package version 2.0 (Jones et al. 1997) was used to dock octane and lauric acid into BM3 WT and the F87A, L188Q/A74G, and F87V/L188Q/A74G mutants. GOLD 2.0 explores the conformational flexibility of the ligand fully and of the protein within a sphere of so-called “active atoms” around the heme iron; balancing accuracy versus computational cost, a radius of 20 Å was found to perform best. All other GOLD 2.0 docking parameters were set at the available defaults (Jones et al. 1997). In the GOLD 2.0 force field, only the steric effects of atomic or molecular oxygen attached to the heme iron is taken into account. Each of the three substrates was successively docked into the ligand-free BM3 WT structure and into the three mutant protein models.
MD simulations and EM calculations were performed using the GROMACS molecular simulation package version 3.1.4 (Van der Spoel et al. 1999, Lindahl et al. 2001) and the GROMOS “43a1” force field (Daura et al. 1996; Van Gunsteren et al. 1996). The default GROMOS “43a1” heme building block was used for the heme. Upon binding of the iron to the cysteine sulphur as the fifth ligand, the iron is in the Fe(III) state. The BM3 protein structure including the heme porphyrin system and substrate was energy minimized in vacuum, first with harmonic position restraints on all nonhydrogen atoms, and then without position restraints. Subsequently, pre-equilibrated simple point-charge (SPC) water was added around the protein and inside the enzyme in a dodecahedral box with a minimum distance of 1.2 nm between the protein and box edges, and the system was minimized again with position restraints on the protein, substrate and cofactor. Finally, the water was allowed to relax for 1 psec while the protein, cofactor and substrate were position restrained. The force constant for position restraints was 1000 kJ mol−1 nm−1. Unrestrained production runs were performed for 1–10 nsec. During all MD simulations the following setup was used. Pressure was maintained at 1 Bar and temperature at 300 K by weak coupling to a bath (Berendsen et al. 1984) and starting velocities were randomly generated from a 300 K Maxwell distribution. The LINCS algorithm (Hess et al. 1997) was used to constrain the length of all covalent bonds and a time step of 2 fsec was used. A twin-range 0.8/1.2 nm cutoff was used for Van der Waals and Coulomb interactions with a neighbor-list update every five steps. Periodic boundary conditions and a relative dielectric constant (ɛr) of 1.0 were used.
Statistics of substrate binding were gathered from all simulations. For each time frame the carbon atom in the substrate closest to the heme iron was determined, and the fraction of simulation time that each carbon atom was closest was reported. Typically, during a single simulation a substrate could adopt multiple conformations, and different carbon atoms will be closest at different moments. For each combination of substrate and enzyme, the multiple simulations started from the different docked orientations were added together for the purpose of gathering statistics.
Protein dynamics—essential dynamics analysis
The dynamic behavior of the enzyme during MD simulations was analyzed using ED analysis (Amadei et al. 1993; Hünenberger et al. 1995) for the whole protein and separately for the residues lining the active site binding pocket. The resulting essential modes describe the mean-square fluctuation (MSF) of atoms in large-scale collective motions that involve many atoms simultaneously, and may be used to discriminate dynamical behavior between different simulations, or between groups of simulations—e.g., WT vs. mutant, or octane vs. lauric-acid bound enzyme.
Substrate energetics and activation barriers: QM calculations
Activation energy barriers for H-atom abstraction (ΔE H-abstraction) from the substrates were calculated using an AM1 SE Hamiltonian for open-shell systems (radicals) within MOPAC7 (Stewart 1989) and an uncharged hydroxyl radical to mimic the activated oxygen–heme–iron moiety as reactive center for the hydroxylation reaction catalyzed by CYPs (Jones et al. 2002). The relevant reaction coordinate is the distance of the hydrogen to its bound carbon, going from C-bound to •OH-bound. Octane and lauric acid were considered at the ω, ω−1, and ω−2 positions in the aliphatic chains. The barrier energy calculations consisted of the following three steps: (1) minimizing the total energy of the substrate and hydroxyl radical attacking the specific location; (2) minimizing the total energy of the substrate radical at the specific location and a water molecule; and (3) finding the corresponding transition state along the reaction coordinate. For each substrate, an initial geometry was taken from the highest scoring docked conformation with the carbon atoms at 6 Å or less from the heme iron. The •OH was positioned at the appropriate distance from the ω, ω-1, and ω-2 carbon atoms and in an orientation nearest to the original location of the heme. Preliminary calculations showed negligible influence of calculated barrier energies on substrate dihedral angles, C–•O distance and C–•O–H angle and the barriers for ω−1 and ω−2 were sufficiently similar to approximate the barriers for ω−3 and further by the ω−2 barrier. The activation barrier of the hydrogen atom abstraction was calculated from the energy diagram as the difference between the minimized energy of the reactants (substrate and hydroxyl radical) and the transition state. To investigate the role of the protein environment, the QM calculations were performed (1) in vacuum (i.e., all possible influence from the enzyme was neglected); (2) in a cloud of point charges located at the charged sidechains in the enzyme crystal structure (positive for Lys and Arg, negative for Glu and Asp); and (3) with point charges corresponding to 13 or 14 monovalent counterions (outside the protein) to neutralize the charge of the system. In Figure 4 the different parts of the substrate–enzyme system and counterions that were taken into account during the QM calculations are schematically depicted.
Product formation: prediction and experiment
Data on regioselectivity of product formation from octane and lauric acid by BM3 WT and the three mutants were taken from the literature (Oliver et al. 1997a; Lentz et al. 2001, 2006; Glieder et al. 2002), and together with additional data derived from new experimental studies by O. Lentz, V. Urlacher, and R.D. Schmid (unpubl.), these are summarized in Table 1.
For the substrate binding orientation as well as for the experimentally measured product ratios, apparent free energies G (ΔG orientation and ΔΔG product formation, respectively) were calculated taking the substrate orientation at each carbon atom (for the binding orientation) or product (for the experimental data) as a state and all states together as the reference state (i.e., a fraction or population of 1 corresponds to an apparent free energy of 0) from the respective population p of each state using G = –kBT ln(p), with kBT = 0.596 kcal mol−1 at 300 K.
Acknowledgments
Financial support from the EC grant “Industrial biocatalysis with new oxygenases in a novel electro-enzyme reactor” in the “Quality of Life and Management of Living Resources” program is acknowledged. We thank Dr. Chris Oostenbrink for helpful discussions.
Footnotes
Reprint requests to: Nico P.E. Vermeulen, Leiden/Amsterdam Center for Drug Research (LACDR), Division of Molecular Toxicology, Department of Pharmacochemistry, Vrije Universiteit, De Boelelaan 1083, 1081HV Amsterdam, The Netherlands; e-mail: NPE.Vermeulen@few.vu.nl; fax: 31 20 5987610.
Article and publication are at http://www.proteinscience.org/cgi/doi/10.1110/ps.062224407.
References
- Amadei A., Linssen, A.B.M., and Berendsen, H.J.C. 1993. Essential dynamics of proteins. Proteins 17: 412–425. [DOI] [PubMed] [Google Scholar]
- Appel D., Lutz-Wahl, S., Fischer, P., Schwaneberg, U., and Schmid, R.D. 2001. A P450 BM-3 mutant hydroxylates alkanes, cycloalkanes, arenes and heteroarenes. J. Biotechnol. 88: 167–171. [DOI] [PubMed] [Google Scholar]
- Berendsen H.J.C., Postma, J.P.M., Van Gunsteren, W.F., DiNola, A., and Haak, J.R. 1984. Molecular dynamics with coupling to an external bath. J. Chem. Phys. 81: 3684–3690. [Google Scholar]
- Brooks B.R., Bruccoleri, R.E., Olafson, B.D., States, D.J., Swaminathan, S., and Karplus, M. 1983. Charmm: a program for macromolecular energy, minimization, and dynamics calculation. J. Comput. Chem. 4: 187–217. [Google Scholar]
- Carmichael A.B. and Wong, L.L. 2001. Protein engineering of Bacillus megaterium CYP102. The oxidation of polycyclic aromatic hydrocarbons. Eur. J. Biochem. 268: 3117–3125. [DOI] [PubMed] [Google Scholar]
- Clark D.E. and Grootenhuis, P.D.J. 2002. Progress in computational methods for the prediction of ADMET properties. Curr. Opin. Drugs Dicov. Devel. 5: 382–390. [PubMed] [Google Scholar]
- Cowart L.A., Falck, J.R., and Capdevila, J.H. 2001. Structural determinants of active site binding affinity and metabolism by cytochrome P450 BM-3. Arch. Biochem. Biophys. 387: 117–124. [DOI] [PubMed] [Google Scholar]
- Daura X., Oliva, B., Querol, E., Aviles, F.X., and Tapia, O. 1996. On the sensitivity of MD trajectories to changes in water–protein interaction parameters: The potato carboxypeptidase inhibitor in water as a test case for the GROMOS force field. Proteins 25: 89–103. [DOI] [PubMed] [Google Scholar]
- Davydov R., Perera, R., Jin, S., Yang, T.C., Bryson, T.A., Sono, M., Dawson, J.H., and Hoffman, B.M. 2005. Substrate modulation of the properties and reactivity of the oxy-ferrous and hydroperoxo-ferric intermediates of cytochrome P450cam as shown by cryoreduction-EPR/ENDOR spectroscopy. J. Am. Chem. Soc. 127: 1403–1413. [DOI] [PubMed] [Google Scholar]
- De Graaf C., Pospisil, P., Pos, W., Folkers, G., and Vermeulen, N.P.E. 2005a. Binding mode prediction of cytochrome P450 and thymidine kinase protein–ligand complexes by consideration of water and rescoring in automated docking. J. Med. Chem. 48: 2308–2318. [DOI] [PubMed] [Google Scholar]
- De Graaf C., Vermeulen, N.P.E., and Feenstra, K.A. 2005b. Cytochrome P450 in silico: An integrative modeling approach. J. Med. Chem. 48: 2725–2755. [DOI] [PubMed] [Google Scholar]
- De Voss J.J. and Ortiz de Montellano, P.R. 1995. Computer-assisted, structure-based prediction of substrates for cytochrome P450(Cam). J. Am. Chem. Soc. 117: 4185–4186. [Google Scholar]
- De Voss J.J., Sibbesen, O., Zhang, Z.P., and Ortiz de Montellano, P.R. 1997. Substrate docking algorithms and prediction of the substrate specificity of cytochrome P450(cam) and its L244A mutant. J. Am. Chem. Soc. 119: 5489–5498. [Google Scholar]
- Ensing B., Buda, F., Gribnau, M.C., and Baerends, E.J. 2004. Methane-to-methanol oxidation by the hydrated iron(IV) oxo species in aqueous solution: A combined DFT and car-parrinello molecular dynamics study. J. Am. Chem. Soc. 126: 4355–4365. [DOI] [PubMed] [Google Scholar]
- Foloppe N. and MacKerell Jr, A.D. 2000. All-atom empirical force field for nucleic acids. I. Parameter optimization based on small molecule and condensed phase macromolecular target data. J. Comput. Chem. 21: 86–104. [Google Scholar]
- Glieder A., Farinas, E.T., and Arnold, F.H. 2002. Laboratory evolution of a soluble, self-sufficient, highly active alkane hydroxylase. Nat. Biotechnol. 20: 1135–1139. [DOI] [PubMed] [Google Scholar]
- Graham-Lorence S., Truan, G., Peterson, J.A., Falck, J.R., Wei, S., Helvig, C., and Capdevila, J.H. 1997. An active site substitution, F87V, converts cytochrome P450 BM-3 into a regio- and stereoselective (14S,15R)-arachidonic acid epoxygenase. J. Biol. Chem. 272: 1127–1135. [DOI] [PubMed] [Google Scholar]
- Guengerich F.P.. 2002a. Cytochrome P450 enzymes in the generation of commercial products. Nat. Rev. Drug Discov. 1: 359–366. [DOI] [PubMed] [Google Scholar]
- Guengerich F.P.. 2002b. Rate-limiting steps in cytochrome P450 catalysis. Biol. Chem. 383: 1553–1564. [DOI] [PubMed] [Google Scholar]
- Haines D.C., Tomchick, D.R., Machius, M., and Peterson, J.A. 2001. Pivotal role of water in the mechanism of P450BM-3. Biochemistry 40: 13456–13465. [DOI] [PubMed] [Google Scholar]
- Harris D. and Loew, G. 1995. Prediction of regiospecific hydroxylation of camphor analogs by cytochrome-P450(Cam). J. Am. Chem. Soc. 117: 2738–2746. [Google Scholar]
- Harris D.L. and Loew, G.H. 1996. Investigation of the proton-assisted pathway to formation of the catalytically active, ferryl species of P450s by molecular dynamics studies of P450eryF. J. Am. Chem. Soc. 118: 6377–6387. [DOI] [PubMed] [Google Scholar]
- Hendrickson J.B., Cram, D.J., and Hammond, G.S. 1980. Organic chemistry, 4th ed, p. 1039. McGraw-Hill, London.
- Hess B.. 2002. Convergence of sampling in protein simulations. Phys. Rev. E 65: 31911. [DOI] [PubMed] [Google Scholar]
- Hess B., Bekker, H., Berendsen, H.J.C., and Fraaije, J.G.E.M. 1997. Lincs: A linear constraint solver for molecular simulations. J. Comput. Chem. 18: 1463–1472. [Google Scholar]
- Hou T.J. and Xu, X.J. 2004. Recent development and application of virtual screening in drug discovery: An overview. Curr. Pharm. Des. 10: 1011–1033. [DOI] [PubMed] [Google Scholar]
- Hünenberger P.H., Mark, A.E., and Van Gunsteren, W.F. 1995. Fluctuation and cross-correlation analysis of protein motions observed in nanosecond molecular dynamics simulations. J. Mol. Biol. 252: 492–503. [DOI] [PubMed] [Google Scholar]
- Jones J.P., Trager, W.F., and Carlson, T.J. 1993. The binding and regioselectivity of reaction of (R)-nicotine and (S)-nicotine with cytochrome-P-450cam—Parallel experimental and theoretical-studies. J. Am. Chem. Soc. 115: 381–387. [Google Scholar]
- Jones G., Willett, P., Glen, R.C., Leach, A.R., and Taylor, R. 1997. Development and validation of a genetic algorithm for flexible docking. J. Mol. Biol. 267: 727–748. [DOI] [PubMed] [Google Scholar]
- Jones J.P., Mysinger, M., and Korzekwa, K.R. 2002. Computational models for cytochrome P450: A predictive electronic model for aromatic oxidation and hydrogen atom abstraction. Drug Metab. Dispos. 30: 7–12. [DOI] [PubMed] [Google Scholar]
- Keseru G.M., Kolossvary, I., and Bertok, B. 1997. Cytochrome P-450 catalyzed insecticide metabolism. Prediction of regio- and stereoselectivity in the primer metabolism of carbofuran: A theoretical study. J. Am. Chem. Soc. 119: 5126–5131. [Google Scholar]
- Koymans L., Donne-op den Kelder, G.M., Koppele Te, J.M., and Vermeulen, N.P.E. 1993a. Cytochromes P450: Their active-site structure and mechanism of oxidation. Drug Metab. Rev. 25: 325–387. [DOI] [PubMed] [Google Scholar]
- Koymans L., Donne-Op den Kelder, G.M., te Koppele, J.M., and Vermeulen, N.P.E. 1993b. Generalized cytochrome P450-mediated oxidation and oxygenation reactions in aromatic substrates with activated N-H, O-H, C-H, or S-H substituents. Xenobiotica 23: 633–648. [DOI] [PubMed] [Google Scholar]
- Lentz O., Li, Q.-S., Schwaneberg, U., Lutz-Wahl, S., Fischer, P., and Schmid, R.D. 2001. Modifications of the fatty acid specificity of cytochrome P450 BM-3 from Bacillus megaterium by directed evolutuion: A validated assay. J. Mol. Catal. B Enzym. 15: 123–133. [Google Scholar]
- Lentz O., Urlacher, V., and Schmid, R.D. 2004. Substrate specificity of native and mutated cytochrome P450 (CYP102A3) from Bacillus subtilis . J. Biotechnol. 108: 41–49. [DOI] [PubMed] [Google Scholar]
- Lentz O., Urlacher, V., Feenstra, K.A., and Schmid, R.D. 2006. Changing the regioselectivity of cytochrome P450 CYP102A3 from Bacillus subtilis by directed evolution. ChemBioChem 7: 345–350. [DOI] [PubMed] [Google Scholar]
- Li Q.S., Schwaneberg, U., Fischer, M., Schmitt, J., Pleiss, J., Lutz-Wahl, S., and Schmid, R.D. 2001. Rational evolution of a medium chain-specific cytochrome P-450 BM-3 variant. Biochim. Biophys. Acta 1545: 114–121. [DOI] [PubMed] [Google Scholar]
- Lightfoot T., Ellis, S.W., Mahling, J., Ackland, M.J., Blaney, F.E., Bijloo, G.J., De Groot, M.J., Vermeulen, N.P.E., Blackburn, G.M., and Lennard, M.S., et al. 2000. Regioselective hydroxylation of debrisoquine by cytochrome P4502D6: Implications for active site modelling. Xenobiotica 30: 219–233. [DOI] [PubMed] [Google Scholar]
- Lindahl E., Hess, B., and Van der Spoel, D. 2001. GROMACS 3.0: A package for molecular simulation and trajectory analysis. J. Mol. Model. 7: 306–317. [Google Scholar]
- Marti-Renom M.A., Stuart, A.C., Fiser, A., Sanchez, R., Melo, F., and Sali, A. 2000. Comparative protein structure modeling of genes and genomes. Annu. Rev. Biophys. Biomol. Struct. 29: 291–325. [DOI] [PubMed] [Google Scholar]
- Matson R.S., Hare, R.S., and Fulco, A.J. 1977. Characteristics of a cytochrome P-450-dependent fatty acid omega-2 hydroxylase from bacillus megaterium. Biochim. Biophys. Acta 487: 487–494. [DOI] [PubMed] [Google Scholar]
- Meunier B., De Visser, S.P., and Shaik, S. 2004. Mechanism of oxidation reactions catalyzed by cytochrome p450 enzymes. Chem. Rev. 104: 3947–3980. [DOI] [PubMed] [Google Scholar]
- Modi S., Sutcliffe, M.J., Primrose, W.U., Lian, L.Y., and Roberts, G.C. 1996. The catalytic mechanism of cytochrome P450 BM3 involves a 6 Å movement of the bound substrate on reduction. Nat. Struct. Biol. 3: 414–417. [DOI] [PubMed] [Google Scholar]
- Munro A.W., Leys, D.G., McLean, K.J., Marshall, K.R., Ost, T.W., Daff, S., Miles, C.S., Chapman, S.K., Lysek, D.A., and Moser, C.C., et al. 2002. P450 BM3: The very model of a modern flavocytochrome. Trends Biochem. Sci. 27: 250–257. [DOI] [PubMed] [Google Scholar]
- Oliver C.F., Modi, S., Primrose, W.U., Lian, L.Y., and Roberts, G.C. 1997a. Engineering the substrate specificity of Bacillus megaterium cytochrome P-450 BM3: Hydroxylation of alkyl trimethylammonium compounds. Biochem. J. 327: 537–544. [DOI] [PMC free article] [PubMed] [Google Scholar]
- Oliver C.F., Modi, S., Sutcliffe, M.J., Primrose, W.U., Lian, L.Y., and Roberts, G.C. 1997b. A single mutation in cytochrome P450 BM3 changes substrate orientation in a catalytic intermediate and the regiospecificity of hydroxylation. Biochemistry 36: 1567–1572. [DOI] [PubMed] [Google Scholar]
- Ost T.W., Miles, C.S., Murdoch, J., Cheung, Y., Reid, G.A., Chapman, S.K., and Munro, A.W. 2000. Rational re-design of the substrate binding site of flavocytochrome P450 BM3. FEBS Lett. 486: 173–177. [DOI] [PubMed] [Google Scholar]
- Park J.Y. and Harris, D. 2003. Construction and assessment of models of CYP2E1: Predictions of metabolism from docking, molecular dynamics, and density functional theoretical calculations. J. Med. Chem. 46: 1645–1660. [DOI] [PubMed] [Google Scholar]
- Peters M.W., Meinhold, P., Glieder, A., and Arnold, F.H. 2003. Regio- and enantioselective alkane hydroxylation with engineered cytochromes P450 BM-3. J. Am. Chem. Soc. 125: 13442–13450. [DOI] [PubMed] [Google Scholar]
- Pylypenko O. and Schlichting, I. 2004. Structural aspects of ligand binding to and electron transfer in bacterial and fungal P450s. Annu. Rev. Biochem. 73: 991–1018. [DOI] [PubMed] [Google Scholar]
- Ravichandran K.G., Boddupalli, S.S., Hasemann, C.A., Peterson, J.A., and Deisenhofer, J. 1993. Crystal-structure of hemoprotein domain of P450BM-3, a prototype for microsomal P450s. Science 261: 731–736. [DOI] [PubMed] [Google Scholar]
- Schneider S., Wubbolts, M.G., Oesterhelt, G., Sanglard, D., and Witholt, B. 1999. Controlled regioselectivity of fatty acid oxidation by whole cells producing cytochrome P450BM-3 monooxygenase under varied dissolved oxygen concentrations. Biotechnol. Bioeng. 64: 333–341. [DOI] [PubMed] [Google Scholar]
- Schoneboom J.C., Cohen, S., Lin, H., Shaik, S., and Thiel, W. 2004. Quantum mechanical/molecular mechanical investigation of the mechanism of C-H hydroxylation of camphor by cytochrome P450cam: Theory supports a two-state rebound mechanism. J. Am. Chem. Soc. 126: 4017–4034. [DOI] [PubMed] [Google Scholar]
- Sevrioukova I.F., Li, H., Zhang, H., Peterson, J.A., and Poulos, T.L. 1999. Structure of a cytochrome P450-redox partner electron-transfer complex. Proc. Natl. Acad. Sci. 96: 1863–1868. [DOI] [PMC free article] [PubMed] [Google Scholar]
- Sono M., Perera, R., Jin, S., Makris, T.M., Sligar, S.G., Bryson, T.A., and Dawson, J.H. 2005. The influence of substrate on the spectral properties of oxyferrous wild-type and T252A cytochrome P450-CAM. Arch. Biochem. Biophys. 436: 40–49. [DOI] [PubMed] [Google Scholar]
- Stewart J.J.P.. 1989. Optimization of parameters for semiempirical methods. 1. Method. J. Comput. Chem. 10: 209–220. [Google Scholar]
- Van der Spoel D., Hess, B., Feenstra, K.A., Lindahl, E., and Berendsen, H.J.C. 1999, Gromacs user manual version 2.0.
- Van Gunsteren W.F., Billeter, S.R., Eising, A.A., Hunenberger, P.H., Kruger, P., Mark, A.E., Scott, W.R.P., and Tironi, I.G. 1996. Biomolecular simulation: Gromos96 manual and user guide. Biomos B.V, Zurich, Groningen.
- Vermeulen N.P.E.. 2003. Prediction of drug metabolism: The case of cytochrome P450 2D6. Curr. Top. Med. Chem. 3: 1227–1239. [DOI] [PubMed] [Google Scholar]
- Verras A., Kuntz, I.D., and Ortiz de Montellano, P.R. 2004. Computer-assisted design of selective imidazole inhibitors for cytochrome P450 enzymes. J. Med. Chem. 47: 3572–3579. [DOI] [PubMed] [Google Scholar]


