

Abstract
The different types of naturally occurring, normal human hemoglobins vary in their tetramer–dimer subunit interface strengths (stabilities) by three orders of magnitude in the liganded (CO or oxy) state. The presence of embryonic ζ-subunits leads to an average 20-fold weakening of tetramer–dimer interfaces compared to corresponding hemoglobins containing adult α-subunits. The dimer–monomer interfaces of these hemoglobins differ by at least 500-fold in their strengths; such interfaces are weak if they contain ζ-subunits and exchange with added β-subunits in the form of β4 (HbH) significantly faster than do those with α-subunits. Subunit exchange occurs at the level of the dimer, although tetramer formation reciprocally influences the amount of dimer available for exchange. Competition between subunit types occurs so that pairs of weak embryonic hemoglobins can exchange subunits to form the stronger fetal and adult hemoglobins. The dimer strengths increase in the order Hb Portland-2 (ζ2β2) < Hb Portland-1 (ζ2γ2) ≅ Hb Gower-1 (ζ2ɛ2) < Hb Gower-2 (α2ɛ2) < HbF1 < HbF (α2γ2) < HbA2 (α2δ2), i.e., from embryonic to fetal to adult types, representing maturation from weaker to stronger monomer–monomer subunit contacts. This increasing order recapitulates the developmental order in which globins are expressed (embryonic → fetal → adult), suggesting that the intrinsic binding properties of the subunits themselves regarding the strengths of interfaces they form with competing subunits play an important role in the dynamics of protein assemblies and networks.
Keywords: embryonic, fetal, adult human hemoglobins, hemoglobin, subunit interfaces, subunit exchange, subunit competition
The structural features of the two major types of subunit interfaces in normal adult hemoglobin A (α2β2), i.e., between dimers in the tetramer and between monomers in the dimer and how they change upon O2 binding, have been elucidated primarily by the studies of Perutz (Perutz 1989), but there have been relatively few reports on the interface properties of the other normal human hemoglobins, including fetal and embryonic hemoglobins. Here we present a systematic study on the subunit interface properties of the family of normal human hemoglobins and report some significant differences among them.
After the different human hemoglobin monomers are expressed, they join together in various combinations to form a heterodimer. Further assembly to tetramers produces the functional O2-binding unit of human Hb (x 2 y 2) as shown in Equation 1.
where x represents α- or ζ-subunits and y represents β-, γ-, δ-, or ɛ-subunits. Although association of x and y subunits strongly favors dimer formation (Bunn 1987), competing self-assembly reactions involving β- or γ-subunits to form β4 (HbH) and γ4 (Hb Bart's) can also occur. In human red cells there are eight possible different hemoglobin combinations, but some of these are present in greater amounts than others and not all have been isolated. In addition, there is a temporal factor, known as ontogeny, whereby certain hemoglobins are present at different times during development, i.e., at the embryonic, fetal, and adult stages (Fig. 1). The progression and control of hemoglobin ontogeny have been the subjects of intense study for many years, but questions remain as to its mechanism (Stamatoyannopoulos and Grosveld 2001).
Figure 1.

Normal developmental profile of hemoglobins. Data are from Huehns and Shooter (1965) and from Kleihauer (1970) as rendered by Bunn and Forget (1986). The names of the normal embryonic hemoglobins are Gower-1 (ζ2ɛ2), Gower-2 (α2ɛ2), and Portland-1 (ζ2γ2). Hb Portland-2 (ζ2β2) is not usually found. (Reprinted from Bunn and Forget 1986 with permission from Elsevier ©1986.)
The hemoglobins present during normal development—ζ2γ2 (Hb Portland-1), ζ2ɛ2 (Hb Gower-1), and α2ɛ2 (Hb Gower-2) during the embryonic period; α2γ2 (fetal Hb or HbF) during the fetal stage; and α2β2 (adult Hb or HbA) as well as small amounts of α2δ2 (HbA2) in adults (Fig. 1)—have some different properties that confer specific advantages during the various stages of development. For example, even though these hemoglobins have very similar overall structural architectures, they have differences in O2 affinity and in their interactions with allosteric effectors (Hoffman and Brittain 1996; He and Russell 2001) that arise from amino acid substitutions at strategic positions to control the manner in which the subunits fit together (Perutz 1989). Knowledge of how these subunit interactions differ for various hemoglobins is important in understanding their physiological properties and is reported here.
The order of expression of the globin subunits is determined by their relative gene positions, i.e., ζ → α (2 copies) on chromosome 16 and ɛ → γ (2 copies) → δ → β on chromosome 11. Hence, combinations of ζ- with ɛ- or γ- subunits to form embryonic hemoglobins would occur before the appearance of fetal and adult hemoglobins containing α-subunits (Fig. 1). However, it is not clear whether there are any dynamics among these hemoglobins and what governs their longevity at the various stages of development. These subjects are also discussed in this report.
The three common embryonic hemoglobins, Hb Portland-1 (ζ2γ2), Hb Gower-1 (ζ2ɛ2), and Hb Gower-2 (α2ɛ2), are normally present during the first few months of life (Fig. 1), and these have been studied in some detail (Huehns and Shooter 1965; Brittain 2004). However, Portland-2 (ζ2β2), another embryonic Hb, is found infrequently and mainly in an extreme type of α-thalassemia (“hydrops fetalis”) where ζ-chains substitute for α-chains when synthesis of the latter is severely impaired (Randhawa et al. 1984). Hence, Hb Portland-2 has not been extensively studied. In this work, we have evaluated many of its properties to determine whether it has any characteristics that might limit its occurrence. The availability of adequate amounts of this and the other embryonic human hemoglobins from transgenic mice (He and Russell 2001), rather than relying on obtaining human embryonic red cells, has enabled a comprehensive study of the subunit binding properties of all the embryonic hemoglobins and a comparison with the fetal and adult types.
Of the two types of subunit interfaces in human hemoglobin (between dimers in the tetramer and between monomers in the dimer, as shown in Equation 1), the properties and equilibrium constants for the tetramer–dimer interface of many hemoglobins are directly measurable in the CO- or oxy-liganded states where these contacts are not particularly strong. Therefore, the concentrations at which tetramers begin to dissociate to dimers are within the range of available detectors. Tetramer–dimer equilibrium constants have been found to vary considerably among some mutant human hemoglobins (Turner et al. 1992; Manning et al. 1996) and between adult hemoglobin A (α2β2) and fetal hemoglobin F (α2γ2), which has a greatly increased tetramer strength (stability)1 (Dumoulin et al. 1997, 1998; Yagami et al. 2002). However, the normal human hemoglobins including the embryonic hemoglobins have not been systematically studied as a group and compared; thus, it has been generally assumed that their subunit interfaces have similar properties. We report here that the strengths of these interfaces vary quite significantly in the liganded state so that dimers and tetramers are formed to different extents. In the deoxy state where subunit contacts are more extensive and stronger than in the liganded state, equilibrium constants are not easily measured and are not included here.
The contacts that hold the monomeric subunits together in the dimer are much stronger than those at the tetramer–dimer interface. Hence, values for these equilibrium constants are much lower than those for the tetramer–dimer interface so that accurate measurements for them are usually extremely difficult to obtain. Since it is this latter interface that is initially formed when α or ζ globins combine with β, γ, δ, or ɛ globins during hemoglobin biosynthesis, it is important to obtain information on their dissociation/association properties in order to fully understand this process.
Results
Interface between dimers in tetramers
Hemoglobins
The hemoglobins were purified in the CO-liganded state as described in Materials and Methods. Each had the correct mass and sequence as determined by methods described previously (Li et al. 1999), and each was homogenous, as shown in Figure 2. The homotetramer β4 (HbH) is a noncooperative Hb described by Benesch et al. (1962); its structure has been determined by Arnone and colleagues (Borgstahl et al. 1994). HbH serves as a clinical marker for some cases of α-thalassemia in which it accumulates when α-subunit synthesis is impaired. Mass-spectrometric analysis of the natural β4 (HbH) used in this study showed that it consisted exclusively of β-subunits. Unlike most Hb tetramers, which do not readily dissociate to monomers, β4 exists in a facile tetramer–dimer–monomer equilibrium (Valdes and Ackers 1977; Philo et al. 1988) thus providing a readily available source of monomeric β-subunits. We found that natural β4 and synthetic β4 (prepared as described below) behaved in the same manner upon gel filtration on Superose-12 and in their ability to form HbA from Hb Gower-2 and other hemoglobins by subunit exchange, as described below.
Figure 2.

Isoelectric focusing gel of hemoglobins. The standard hemoglobins are A, F, S, and C from top to bottom. Lane 1, Hb Portland-1; lane 2, Hb Portland-2; lane 3, HbA; lane 4, HbF; lane 5, HbS; lane 6, HbA2; lane 7, Hb Gower-1; lane 8, Hb Gower-2; lane 9, Hb-Rothschild. About 5 μg of each protein was applied to the Hb Resolve gel (PerkinElmer). The anode is at the top and the cathode at the bottom.
Tetramer–dimer dissociations of embryonic hemoglobins Gower-1 (ζ2ɛ2), Gower-2 (α2ɛ2), and Portland-1 (ζ2γ2)
These three hemoglobins occur normally during the embryonic period (Huehns and Shooter 1965) (Fig. 1). Their tetramer–dimer equilibrium constants have been thought previously to be similar to that of HbA (Hoffman and Brittain 1996); their dimer–monomer equilibrium constants have never been measured. A fourth embryonic Hb, Portland-2 (ζ2β2), occurs only rarely, so its properties are not well known.
Tetramer–dimer K d values were measured by high-resolution gel filtration as described previously (Manning et al. 1996, 1999). The tetramers containing ɛ-subunits, Hb Gower-1 (ζ2ɛ2) and Gower-2 (α2ɛ2), had tetramer–dimer K d values at pH 7.5 of 2.14 μM (Fig. 3A) and 0.17 μM (Fig. 3B), respectively. Thus, the Hb containing ζ-subunits (ζ2ɛ2) had a 13-fold higher K d value than the tetramer containing α-subunits (α2ɛ2). There was no detectable presence of monomers from either of these hemoglobins in contrast to the results with Hb Portland-2 (ζ2β2) described below.
Figure 3.

(A) Tetramer–dimer dissociation profile of Hb Gower-1 at pH 7.5. (B) Tetramer–dimer dissociation profile of Hb Gower-2 at pH 7.5. (C) Tetramer–dimer dissociation profile of Hb Portland-1 at pH 7.5. (D, E) Tetramer–dimer and dimer–monomer dissociation profiles of Hb Portland-2 at pH 7.5. The point of intersection of each horizontal line at log 1 with the diagonal experimental line represents the K d value.
Embryonic Hb Portland-1 (ζ2γ2) is the ζ-substituted counterpart of fetal HbF (α2γ2); both have γ-subunits. Its tetramer–dimer K d was found to be 0.31 μM (Fig. 3C) at pH 7.5, a value ∼30 times higher than that for fetal HbF (0.01 μM) (Dumoulin et al. 1997). Although there was no evidence for further dissociation of ζγ dimers at pH 7.5, possible further dissociation was noted at pH 6.3 by the occurrence of wider-than-normal peaks during gel filtration probably due to formation of ζ and γ4 as reported by Kidd et al. (2001) at low pH.
Embryonic Hb Portland-2 characterization
Other than the report of Randhawa et al. (1984), little is known about the rare Hb Portland-2 (ζ2β2) since it occurs only in cases of an extreme type of α-thalassemia. Therefore, we have investigated it fairly extensively to determine whether its properties might explain its infrequent occurrence. It showed a single peak on a high-resolution FPLC Mono S column and a single band upon isoelectric focusing (Fig. 2). It had the expected amino acid sequence for its ζ- and β-subunits (see mass spectra below), indicating that there was faithful expression of the human globin genes in the mouse and that the globin subunits had not incurred any proteolysis. In order to ensure that Hb Portland-2 isolated from the mouse hemolyzate was properly folded, its circular dichroism pattern was compared with that of human adult HbA (Martin de Llano and Manning 1994) measured at the same time and at the same concentration. The results (Fig. 4), which show the CD spectra of each in the far-ultraviolet region, are nearly superimposable with only minor differences. CD spectra in the visible and near-ultraviolet regions (not shown) were also identical to those for HbA. Hence, human Hb Portland-2 expressed in mice has a native hemoglobin conformation.
Figure 4.

Far-UV circular dichroism spectra of hemoglobins Portland-2 (solid line) and A (dashed line). The spectra were recorded at 42 μM heme concentration at room temperature. The ellipticity (Θ) results are expressed in deg × cm2 × dmol−1 on a heme basis.
Dissociation of Hb Portland-2 to monomers at neutral pH
Most liganded human hemoglobins in non-denaturing buffers at pH 7.5 (the type used for the K d measurements) dissociate rapidly and reversibly from the tetrameric to dimeric state to an extent that depends on the tetramer–dimer dissociation constant and the Hb concentration. Significant dimer-to-monomer dissociation is practically never observed in such non-denaturing buffers for human hemoglobins containing α-subunits, although it is theoretically always present to some degree according to the equilibrium α2β2 ⇌ 2αβ ⇌ 2α + 2β. Griffith and Kaltashov (2003) obtained direct evidence for this complete equilibrium for HbA using mass spectrometry.
Hb Portland-2 differs from most human hemoglobins, including adult HbA (α2β2), because it initially dissociates from tetramers to dimers (Fig. 3D) and then continues to dissociate to monomers readily (Fig. 3E). Hence, when ζ-subunits replace α-subunits, the equilibrium ζ2β2 ⇌ 2ζβ ⇌ 2ζ + 2β is displaced significantly to the right relative to that for α2β2. The tetramer–dimer dissociation constant at pH 7.5 for Hb Portland-2 (ζ2β2) is 11.63 μM (Fig. 3D, inset), which is one of the highest values we have observed for a naturally occurring nonmutated Hb. By comparison, the K d for HbA (α2β2) at pH 7.5 is 0.68 μM (Manning et al. 1996) or about 17 times lower than that for Hb Portland-2. Similar values for HbA have been reported earlier by Atha and Riggs (1976) and by Chu and Ackers (1981). The tetramer–dimer dissociation constants of all the normal human hemoglobins except the one that has not been isolated (ζ2δ2) are summarized in Table 1. To our knowledge, this is the first such compilation. The results show that substitution of ζ-subunits for α-subunits leads to an average 20-fold weakening of this interface, a property which has not been previously appreciated.
Table 1.
Tetramer–dimer dissociation values (K d) of natural human hemoglobins

The dimer–monomer K d for Hb Portland-2 at pH 7.5 is 1.4 nM (Fig. 3E, inset) i.e., about four orders of magnitude lower than its tetramer–dimer K d. The corresponding dimer–monomer K d for HbA has never been determined because it is so low. Since this is the first time that we have been able to calculate an accurate relationship between these two types of equilibrium constants, we cannot state whether the same difference between these constants exists for the other normal hemoglobins.
Enhanced tetramer dissociation at low pH
Previously, it has been reported by us (Dumoulin et al. 1997; Ashiuchi et al. 2005) and by others (Atha and Riggs, 1976; Chu and Ackers, 1981) that tetramer dissociation to dimers for HbA is increased as the pH is lowered. For each change of 1 pH unit (10-fold change in H+ concentration), the K d value increases ∼10-fold (Dumoulin et al. 1997). In order to determine if Hb Portland-2 (ζ2β2) behaved similarly, we carried out studies at pH 6.3 instead of at pH 7.5 used above for the K d measurements. The gel-filtration results in Figure 5 show that, at low concentration (0.2 μM), Hb Portland-2 completely dissociates to monomers (upper panel) but HbA remains primarily dimeric (second panel from top). However, at higher concentrations (60 μM), both Hb Portland-2 and HbA form a mixture of tetramers and dimers (third and fourth panels from top, respectively). Thus, Hb Portland-2 is capable of forming tetramers although not with the ease that HbA does because its overall equilibrium is displaced away from tetramers. Hence, ζβ can be considered to be a relatively weak dimer compared to the stronger αβ dimer.
Figure 5.

Comparison of dissociation of Hb Portland-2 and adult HbA at pH 6.3 on Superose-12. No peaks other than those shown here were observed.
Isolation and stability of the monomeric subunits of Hb Portland-2
The concept of a weak ζβ dimer described above was tested further. At relatively high concentration (280 μM applied concentration), Hb Portland-2 elutes from an FPLC cation-exchange Mono S column as a single symmetrical peak at pH 6.3 (Fig. 6, top panel). However, at dilute concentration (10 μM applied concentration), two separate peaks, which we demonstrate by mass spectrometry below are the individual ζ- and β-subunits, elute from this column (Fig. 6, middle panel). Formation of these monomers as a function of Hb concentration is shown in the bottom panel of Figure 6.
Figure 6.
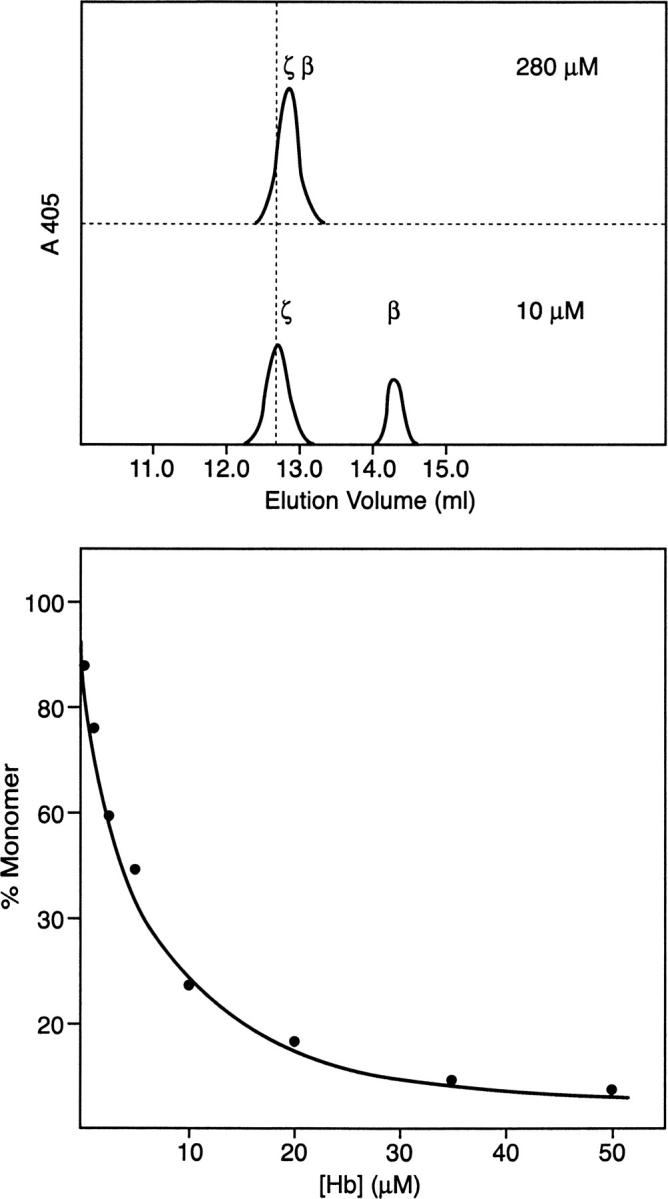
Dissociation of Hb Portland-2 dimers to monomers (top and middle panels) and profile of dissociation as a function of concentration (bottom panel). The concentrations shown on the top and middle panels are those applied to the Mono S column. There is a 10- to 15-fold dilution of the sample on the column. No peaks other than those shown here were observed.
Formation of individual ζ- and β-subunits so readily from Hb Portland-2 (Fig. 6, middle panel) raised a question regarding their stabilities. Isolated α- and β- hemoglobin subunits are somewhat unstable and subject to loss (Antonini and Brunori 1971). If this had happened during the course of our studies on the dimer–monomer equilibrium of Hb Portland-2, it would likely have shifted the equilibrium and given false results for the K d measurements. In order to control for this possible occurrence, a sample at a relatively high concentration (similar to that in Fig. 6, top panel) was diluted to a concentration where it was monomeric (Fig. 6, middle panel) and maintained under such conditions for 16 h (which is longer than the duration of the gel-filtration experiment for the K d measurements). The sample volume was then restored to its original value. The recovery was close to 100%, indicating that losses of monomer did not occur and thus validating the K d measurements. This result is also consistent with the conclusion that it is the interface between the ζ- and β-subunits that is weak; the subunits themselves are not unstable.
Identification of the monomeric subunits
A weakened interface between ζ- and β-subunits could be due to an incorrect or truncated sequence, so such possibilities were examined. The most direct approach to establish that the sequence of Hb Portland-2 was correct and intact was to perform comprehensive mass spectrometry on the subunits isolated from the FPLC column described above. The three-step mass spectrometric strategy reported previously (Li et al. 1999) was utilized. Initially, we used ESI/MS to measure the average molecular masses of both ζ and β chains separately. A typical ESI spectrum is presented in Figure 7A with its corresponding deconvoluted spectrum shown in Figure 7B. Measurements were performed on charge states ranging from +9 to +16 (m/z range 950–1750) from five spectra. The deconvoluted spectrum shows a single component for each hemoglobin chain with differences between the theoretical mass and the experimentally determined mass of <15 ppm (ΔM[ζ] = +0.1 u and ΔM[β] = 0.2 u). Minor peaks, present on the high-mass side of each major peak (Fig. 7B), corresponded to sodium, potassium, and iron adducts.
Figure 7.

Mass spectrometric analysis. The procedures described by Beavis and Chait (1996) and Kalkum et al. (2003) were employed. (A) ESI/MS analysis of embryonic hemoglobin Portland-2 (ζ2β2) showing the ion envelopes for the ζ and β chains. (B) Transformed mass spectrum after deconvolution of the ion envelopes encompassing charges between +16 and +9 (m/z range 950–1750). The experimentally determined values are in agreement with the expected average mass of 15,547.8 u for the acetylated form of the ζ chain and of 15,867.2 u for the unmodified β chain according to their respective polypeptide sequences. Asterisks denote peaks originating from adduction of metals to each chain. (C) MALDI-QqTOF/MS spectrum of a tryptic digest of embryonic hemoglobin Portland-2. Peaks are labeled as ζ and β chain peptides followed by “T” for trypsin, and the numbers of the first and last residues of the peptide in accordance with the primary structure of the globin chain. The filled portion of the horizontal bars represent the sequence coverage obtained for both ζ and β chains for the spectrum shown. Additional results (see text) yielded information covering 100% of both ζ and β chains.
The two chains from hemoglobin Portland-2 were subsequently analyzed by peptide mapping using both MALDI-TOF/MS and MALDI-QqTOF/MS. Figure 7C is a representative example of a peptide map obtained by MALDI-QqTOF/MS after digestion of the hemoglobin chains with trypsin. Each spectrum was internally calibrated, yielding mass errors of ±10 ppm. Although masses determined by MALDI-QqTOF/MS were more accurate than those measured by MALDI-TOF/MS, sequence coverage in the QqTOF instrument was not complete due to its limited m/z scanning range. Thus, MALDI-TOF/MS was utilized to extend sequence coverage to 100% for both chains (data not shown) as well as to verify the nature of the N-terminal residue of the first tryptic peptide from the ζ-chain, ζT[1–7], which was found to be acetylated on Ser-1. Acetylation of seryl residues produces a modified amino acid whose mass cannot be resolved from a glutaminyl residue using the mass-spectrometric techniques employed here. However, a glutaminyl residue has a free N-terminal and is thus amenable to chemical modification at its α-NHw group by the Edman reagent to give the PITC group, whereas N-acetyl-Ser, being already modified, is not. MALDI-TOF/MS of the PITC-derivatized peptides showed that the N-terminal peptides ζT[1–7] and βT[1–8] were modified by one and two phenylthiocarbamyl groups (PTC), respectively (data not shown). Since PITC only reacts with free amino groups, this reagent was expected to modify only the ɛ-amino group of Lys-4 in the ζ chain and both the α-amino group of Val-1 and ɛ-amino group of Lys-8 in the β chain. These results were in agreement with the mass measurement of the intact chains. Finally, some tryptic peptides and a few Arg-C peptides, chosen so as to produce 100% coverage of each chain, were sequenced by mass-spectrometric fragmentation to verify both polypeptide sequences. Fragmentation analysis showed all peptides to have the expected amino acid sequences (data not shown). We conclude from this analysis that the weak interface between ζ- and β-subunits is not due to problems with the subunits themselves but in the way that they join together. Whether or not this unusual property is related to its infrequent physiological occurrence is addressed below.
Relative amounts of tetramers for various human hemoglobins
The tetramer–dimer K d values for the human hemoglobins are summarized in Table 1. These K d values were derived by fitting to a theory developed in Manning et al. (1996). A slight reworking on this theory predicts that a wide range of tetramer amounts can result from the same [Hb] concentration for different hemoglobins. Specifically, the theory predicts that
 |
where Z is a proportionality factor that equals the total Hb concentration being considered divided by the K d, i.e., Z = [Hb]/K d. (Equation 2 can be derived by substituting [Hb] = Z·K d into Equation 6 of Manning et al. [1996] and canceling all common factors of K d.)
Using Equation 2, we constructed Figure 8, showing the theoretical Hill plots for the various forms of embryonic, fetal, and adult hemoglobins (using the K d values from Table 1), which do not appear in any particular order. The wide range of K d values translates into large differences in %T values for a given [Hb]. For example, at [Hb] of 0.1 μM, the amount of tetrameric state is 3% for Hb Portland-2 (ζ2β2), 30% for HbA (α2β2), and 85% for HbF (α2γ2). At [Hb] of 1.0 μM, the corresponding values are 21%, 68%, and 95% (the range is smaller since we are beginning to reach the saturation limit of %T = 100). This behavior can be explained by Equation 2: An increase (or decrease) in K d by some multiplicative factor shifts the Hill plot to the right (or left) by exactly this factor. Thus, the variation in K d by three orders of magnitude among different hemoglobins reported here is reflected by the horizontal shifts of three orders of magnitude between the data sets in Figure 8.
Figure 8.

Hill plot of K d values for human hemoglobins. Hemoglobin concentrations from 0.01 to 10.0 μM were used in Equation 2 to calculate the corresponding amounts of tetramer. The data are represented as a Hill plot where y is the fractional amount of tetramer for each Hb, e.g., for 25% tetramer, y = 0.25.
Even though [Hb] in red blood cells is in the millimolar concentration range while K d values are in the micromolar concentration range, a decreased ability to form tetramers indicates a weakness in the overall equilibrium for a particular Hb. Since K d values are increased by approximately an order of magnitude for each decrease of 1 pH unit (Dumoulin et al. 1997; Ashiuchi et al. 2005), a similar figure (not shown) was constructed for estimated K d values at pH 6.5, which is close to the pH 6.3 used in some of the experiments in this report. A similar series of parallel lines is found as in Figure 8, but they are shifted downward, consistent with less tetramer at low pH.
The slopes of the best-fit lines to the Hill plots in Figure 8 are ∼0.6. However, it should be noted that this value is for Hb concentrations from 0.1 to 10 μM, which is the range spanned by the K d values listed in Table 1 except for HbF. A careful analysis of Equation 2 illustrates that the Hill plot will not be a straight line over the entire range of [Hb]; rather, it will transition from having a slope of 1 for small [Hb] to slope of 1/2 for large [Hb]. Specifically, given %T from Equation 2, a straightforward calculation shows that y/(1 − y) = [(16Z + 1)1/2 − 1]/2 (note that y = %T/100). The theoretical limits of slope of 1/2 and slope of 1 can be derived from Taylor series expansions, but it is more revealing to simply plot log[(16Z + 1)1/2 − 1] 2 against log Z. From this graph, the slope is about 1/2 for Z = 1 or larger and is ∼1 when Z = 0.1 or smaller. In other words, in terms of [Hb], the slope of the Hill plot should be ∼1/2 for [Hb] = K d or larger and ∼1 for [Hb] = 0.1K d or smaller. Since most of the data in Figure 8 is for [Hb] > 0.1K d, we see mostly “slope of 1/2” behavior, but in the left portions of some of the data sets, we begin to see the downward curve toward slope 1. The implication of different slopes is that the ability of a given Hb to attain the tetrameric state as a function of [Hb] concentration can vary significantly among hemoglobins especially at low [Hb] in early red cells.
Monomer–monomer interface in dimers
Dimer dissociation and subunit exchange
In spite of the importance of the first step of the assembly pathway (Equation 1), little is known about the relative strengths of the interfaces between the different monomeric hemoglobin subunits, i.e., whether they differ in their rates of either formation or dissociation. To evaluate the properties of these interfaces, we studied the process of dissociation starting with the tetrameric state, i.e., the reverse of Equation 1. This pathway is more convenient to study than association from monomers since human hemoglobins are generally isolated as tetramers, which are more stable than their constituent monomeric subunits. The initial dissociation from tetramers to dimers occurs rapidly in a concentration-dependent manner as described above. In contrast, further dissociation of dimers to monomers is a very slow process (except for Hb Portland-2), the kinetics and final equilibrium of which are difficult to measure directly. We have used an indirect method to provide an estimate of the relative strengths of the monomer–monomer subunit contacts in the dimer. However, it was not possible to attain the degree of precision obtained for tetramer–dimer constants. An established procedure in which one subunit type in the tetramer, e.g., ɛ, γ, or δ, is replaced by another type, e.g., β, was modified as described below in order to obtain the kinetics of the exchange. Equation 3 illustrates this subunit exchange for HbF (αγ) dimers in which dissociation to monomers occurs first followed by association of the released α-subunit with added β-subunits (from β4).
 |
Exchange of subunits in hemoglobins has been used extensively as an analytical tool by several investigators (Jones and Schroeder 1963; Huehns et al. 1964a,c; Bunn 1981). Typically, these earlier experiments involved prolonged exposure (12–24 h) of two different hemoglobins together to low pH (pH 4.7) to achieve complete dissociation of each tetramer to individual subunits (see Equation 1). After adjustment to neutral pH to stabilize the rearrangement, hybrid tetramers made up of subunits from both types of original tetramers were formed. We modified this procedure by using pH 6.3 in order to achieve slow and partial dissociation rather than total disassembly to monomers at pH 4.7. With this approach, we could estimate the relative strength of the monomer–monomer interfaces of various hemoglobins. As described below, significant differences in the rates of this subunit exchange were found for the naturally occurring normal embryonic, fetal, and adult human hemoglobins.
Dimer strengths of embryonic hemoglobins
The embryonic hemoglobins by themselves at pH 6.3 dissociate fairly readily (not shown). The experiment shown in Figure 9 was performed with equivalent concentrations of β4 and each Hb, and the amount of the embryonic Hb remaining as a function of time was measured. Hb Portland-1 (ζ2γ2) and Hb Gower-1 (ζ2ɛ2), each containing ζ-subunits, dissociated considerably faster than did Hb Gower-2 containing α-subunits (α2ɛ2). The left and right panels in Figure 9 are expressed in hours and minutes, respectively. With Hb Gower-2, there was approximately an equivalent amount of HbA (α2β2) formed (see below).
Figure 9.

Disappearance of embryonic hemoglobins in the presence of β-subunits. The amounts of a given Hb remaining after incubation in 10 mM potassium phosphate, pH 6.3, containing 0.5 mM EDTA and 0.5 mM EGTA. The data were plotted on a scale of hours (left panel) or minutes (right panel).
Subunit exchange of different concentrations of fetal and adult hemoglobins
The rates of subunit exchange for several hemoglobins containing α-subunits are shown in Figure 10. In this experiment, the rates of formation of α2β2 (HbA) from Hb Gower-2, HbF, HbF1, or HbA2 were measured at two concentrations, 10.0 and 0.5 μM, in the presence of an equivalent concentration of β4. The progress of the exchange was linear for at least 96 h with little formation of met Hb due to oxidation. Control experiments in the absence of β4 showed that nothing eluted in the position of HbA. At 10 μM concentrations, HbF, HbF1, and HbA2 underwent subunit exchange at rates that were slower than that for Hb Gower-2 (Fig. 10, left panel). We interpret this result to indicate that the monomer–monomer subunit interface in the αɛ dimer is relatively weak and hence more readily replaced by a β-subunit than are the corresponding interfaces in the αγ or αδ dimers. The rates of exchange at the 10 μM concentration in decreasing order were Hb Gower-2 (α2ɛ2) > HbF1 (α2 Acγ2) > HbF (α2γ2) > HbA2 (α2δ2) (Fig. 10, left panel, solid lines). At 30 μM Hb Gower-2 and β4, the exchange rate was considerably slower (Fig. 10, left panel, dashed line). A mechanism for this effect is proposed below.
Figure 10.

Exchange of embryonic, fetal, and adult hemoglobins with β-subunits. The appearance of α2β2 (HbA) was plotted in hours. Reactants were tested at 10 μM (left) and 0.5 μM (right) concentrations.
At a lower concentration of Hb (0.5 μM) and an equivalent concentration of β4 (Fig. 10, right panel), the exchange rates were significantly faster than at the 10.0 μM concentration for all hemoglobins except for HbA2 (discussed below). This observation is in accordance with Equation 1, i.e., at the higher Hb concentration the equilibria will be shifted to the right so the relative concentration of monomeric subunits will be lower; conversely, at lower Hb concentration, the relative monomer concentration will be higher. A similar conclusion was also reported by Huehns et al. (1964c). This effect is particularly evident for HbF1 and HbF, which behave similarly at 0.5 μM but not at 10 μM Hb concentrations at which HbF forms tetramers more readily than HbF1. HbF1 (α2 Acγ2) differs from HbF since it has an acetyl group on the N-terminal Gly of its γ-subunit; its tetramer–dimer dissociation constant (0.33 μM) is much closer to that of HbA (0.68 μM) than to that of HbF (0.01 μM) (Dumoulin et al. 1997; Manning and Manning 2001). Thus, the acetyl group leads to a general overall weakening of the HbF subunit contacts. Since HbF is a considerably stronger tetramer than HbF1, it would be more effective in lowering the monomer concentration than would HbF1 (compare left and right panels of Fig. 10). In order to understand the basis for this effect of acetylation, the region surrounding the N-terminal Ac-Gly (γ) of HbF1 was modeled. This analysis showed that Ac-Gly (γ) could interact with Lys-132 on the H-helix of the γ-subunit which could, in turn, weaken the H-bonding between Glu-127 (γ)–Arg-31 (α) at the monomer–monomer interface, leading to enhanced dissociation and therefore increased subunit exchange.
Correlation of subunit exchange of hemoglobins with formation of HbA
The results with Hb Gower-2 measuring either its disappearance (Fig. 9) or the appearance of α2β2 (Fig. 10) can be correlated directly. For both measurements, a plateau is reached at ∼50 h, consistent with the two events being related. The difference between the amount of Hb Gower-2 remaining (30%) and the amount of HbA formed (50%) at 50 h is likely due to spontaneous dissociation of Hb Gower-2 in the absence of β4 noted above. Nevertheless, the rate of appearance of α2β2 correlated well with disappearance of Hb Gower-2 in the presence of β4, with rates of 0.018% and 0.022% per minute, respectively (Table 2). The rates of subunit exchange of all hemoglobins are summarized in Table 2 as the slopes calculated when the data in Figures 9 and 10 are plotted as a first-order plot. Although these values are approximations determined under a set of conditions that differ from those in the red blood cell, they provide a basis to compare the various human hemoglobins with one another with respect to the strengths of their monomer–monomer interfaces. Importantly, these values differ by >500-fold and show a clear trend from embryonic → fetal → adult hemoglobins in their relative strengths.
Table 2.
Comparison of subunit exchange ratesa

Exchange rates of dimers vs. tetramers of the αβ type
The results at the two concentrations, 0.5 and 10.0 μM, suggest that there is a reciprocal relationship between the amount of tetrameric state and the rate of monomer exchange with β4. This hypothesis was tested directly by studying the rates of exchange of β4 with the completely dimeric Hb Rothschild containing an amino acid substitution at the critical residue 37(β) in the tetramer–dimer interface which precludes tetramer formation and comparing this rate with that of the mainly tetrameric HbS having an amino acid substitution at external residue 6(β). Previous results showed that HbS has a tetramer–dimer K d (0.42 μM), which is very similar to that of HbA (0.68 μM) at pH 7.5. The fourfold faster exchange rate for Hb Rothschild compared to HbS shown in Table 2 supports the conclusion that the amount of tetrameric state influences the exchange rate between a given Hb and β4.
The assay used to measure the strength of monomer–monomer interfaces precludes direct measurement of the strength of the αβ dimer of HbA since it is based upon the combination of an α-subunit released upon dissociation of a particular dimer with a β-subunit from added β4 to form αβ. However, the results of the αβS dimer of sickle HbS provide an estimate of the strength of the αβ dimer of HbA. The results in Table 2 for sickle HbS indicate that this dimer is also strong.
Subunit competition favors strong hemoglobins
In order to determine whether subunits derived from dissociation of pairs of weak embryonic hemoglobins would recombine to form stronger hemoglobins, α2ɛ2 (Hb Gower-2, G-2) and ζ2β2 (Hb Portland-2, P-2) (10 μM each of these relatively weak tetramers) were mixed and the formation of α2β2 (HbA) was followed as a function of time. The dissociation and recombination for this Hb pair are described by the equation below, where the major product that was found is shown in bold and the one that was absent or barely detectable is in parentheses:
 |
Isoelectric focusing analysis showed a progressive increase in the amount of HbA over a period of 3 d (Fig. 11A, see arrow and lanes 3–5). No ζ2ɛ2, the other possible tetramer formed by exchange, was found. The reverse reaction, i.e., formation of Hb Portland-2 (ζ2β2) and Hb Gower-2 (α2ɛ2) from HbA and Hb Gower-1, was barely detectable (data not shown). These findings suggest that the overall equilibrium state of the subunit exchange reaction is influenced by the interface strengths of the participating hemoglobins and that α2β2 is favored in the above reaction since it has the strongest interface of the four dimers.
Figure 11.

Exchange between hemoglobins of different subunit strengths. (A) Formation of HbA (arrow) from Hb Portland-2 (P-2) and Hb Gower-2 (G-2). The hemoglobins (10 μM of each) were mixed and incubated at room temperature for various times. For the isoelectric focusing gel, ∼5 μg of protein was applied: lane 1, HbA alone; lane 2, mixture at 0 time; lane 3, mixture after 24 h; lane 4, mixture after 48 h; lane 5, mixture after 72 h; lane 6, Hb Portland-2 alone; lane 7, Hb Gower-2 alone. (B) Formation of HbF (arrow) from Hb Portland-1 (P-1) and Hb Gower-2 (G-2). The hemoglobins (10 μM of each) were mixed and incubated at room temperature for various times. For the isoelectric focusing gel, ∼5 μg of protein was applied: lane 1, mixture at 0 time; lane 2, mixture after 24 h; lane 3, mixture after 48 h; lane 4, mixture after 120 h; lane 5, Hb Portland-1 alone; lane 6, Hb Gower-2 alone; lane 7, Hb Gower-1 alone; lane 8, HbF; the minor band is acetylated HbF1. (C) Competition between β- and γ-subunits for a limiting supply of α-subunits: lane 1, standard hemoglobins A, F, S, and C, from top to bottom; lane 2, mixture of hemoglobins Portland-1 (P-1) (ζ2γ2), Portland-2 (P-2) (ζ2β2), and Gower-2 (G-2) (α2ɛ2), 10 μM of each, incubated at room temperature and at time 0; lane 3, same mixture after 1 d; lane 4, same mixture after 2 d; lane 5, same mixture after 3 d; lane 6, HbA standard; lane 7, standard HbF was added to a portion of the 3-d mixture (lane 5) to verify that HbF was absent from lane 5; lane 8, HbF; lanes 6–8 were analyzed on a different gel than that used for lanes 1–5. Hb Gower-2 migrated differently on each gel.
Another pair of relatively weak embryonic hemoglobins, ζ2γ2 (Hb Portland-1, P-1) and α2ɛ2 (Hb Gower-2, G-2), exchanged their subunits and formed HbF (α2γ2) progressively (Fig. 11B, arrow and lanes 2–4). A small amount of ζ2ɛ2 was found. This subunit exchange can be described as follows:
 |
When equivalent concentrations of ζ2β2 (P-2), ζ2γ2 (P-1), and α2ɛ2 (G-2) were mixed, α2β2 (HbA) was formed but α2γ2 (HbF) was not detectable (Fig. 11C, lanes 3–5; see equation below). In order to confirm the absence of formed HbF, authentic HbF was added to the 3-d P-1 + P-2 + G-2 mixture (Fig. 11C, lane 7); there was a clear separation between the added HbF and the formed HbA just above it.
 |
This result demonstrates that competition between β- and γ-subunits for the limited supply of α-subunits discriminates in favor of α2β2 and could be explained by the presence of more β-subunits from the extensive dissociation of ζ2β2 compared to a lesser amount of γ-subunits from the stronger ζ2γ2. Alternatively, the formation of γ2 and/or γ4 through self-assembly of γ-subunits could also explain this result (Adachi et al. 2000); Kawamura-Konishi and Suzuki 1989).
We conclude from the results of these subunit-competition experiments that when hemoglobins made up of weak (ζβ or ζγ) or moderate-strength (αɛ) heterodimers are present together, their subunits can rearrange to form a Hb (αβ or αγ) that is stronger than either of the initial hemoglobins alone. Furthermore, this exchange may be influenced by secondary competitions involving self-assembly or post-translational modifications of certain subunits. However, we have no direct evidence that such an exchange of subunits actually does or does not occur in the red cell; our results only show that it could occur. We have used subunit exchange as an analytical method to compare the relative strengths of the monomer–monomer interfaces of various hemoglobins. We do note, however, that the order of increasing subunit interface strengths reflected in these subunit competition experiments does mimic the progression of hemoglobin types over time shown in Figure 1.
HbA2
Unlike the subunit exchange described here for most hemoglobins, HbA2 does not show a concentration dependence, i.e., it has the same exchange rate at both the 0.5 μM and the 10.0 μM concentrations (Fig. 10, right and left panels, respectively). This behavior suggests that it may have different equilibrium properties than described in Equation 1, which predicts a concentration dependence. Consistent with this suggestion is the observation that HbA2 behaves anomalously during gel filtration (Manning et al. 1996, 1998). Gel filtration of most hemoglobins shows that their profiles of peak width vs. Hb concentration have maxima at or very near their tetramer–dimer K d values, where the highest relative amounts of tetramers and dimers are present (Manning et al. 1998). HbA2, on the other hand, not only has an unusually large peak width but its maximum is displaced to lower Hb concentration by an order of magnitude from its K d value. This behavior is consistent with an unusual and perhaps unfavorable monomer–monomer interaction as well as a reluctant dimer dissociation that could influence the subunit exchange described here, although its molecular basis is unclear at present.
pH Dependence of the exchange rate
The rates of exchange of Hb Gower-1 with β4 at pH 6.3, 7.3, and 8.3 were compared. The results showed that at low pH the exchange rate is more rapid than at high pH. A likely explanation for this result is that there is more of the dimeric form present at the lower pH due to increased dissociation of tetramers to dimers with decreasing pH (Ashiuchi et al. 2005 and references therein).
Discussion
Common and uncommon hemoglobins containing β-subunits
Of the two types of human hemoglobins containing β-subunits, α2β2 (HbA) is formed at all developmental stages and is most abundant in normal adult red cells (Fig. 1). It is the most widely studied hemoglobin. In contrast, ζ2β2 (Hb Portland-2) is a rare Hb that is found only when there is no production of α-subunits, i.e., in some forms of α-thalassemia. To explain these observations, Randhawa et al. (1984) postulated that α-subunits have a higher affinity for β-subunits (i.e., a stronger monomer–monomer interface) than do ζ-subunits; thus, ζ2β2 is found only when α-subunits are absent. The availability of adequate amounts of human embryonic hemoglobins from transgenic mice (He and Russell 2001) has permitted this hypothesis to be tested. The results in this report not only support the hypothesis of Randhawa et al. (1984) but also demonstrate that there is a wide range in such affinities between the subunits of all the embryonic, fetal, and adult hemoglobins.
Why does Hb Portland-2 occur so infrequently? It does not appear that its expression level is limiting since in the transgenic mouse system devised by He and Russell (2001) for embryonic hemoglobins, there was the expected level of expression of Hb Portland-2 (see Materials and Methods). Circular dichroism studies showed that it does not have an unusual conformation. The mass-spectrometric data indicated that it has the correct sequence and has not been truncated. Its UV–visible spectrum is normal. Hence, Hb Portland-2 does not appear to possess unusual properties that would limit its capability to be expressed and to form tetramers (Fig. 5). Compared to other hemoglobins, a distinguishing feature of Hb Portland-2 is the extreme weakness of both its tetramer–dimer and its dimer–monomer subunit interfaces. This unusual behavior may be related to its infrequent occurrence.
Effects of ζ-subunits on Hb cooperativity
Oxygen binding studies on the embryonic hemoglobins have already been reported by Brittain (2004) and by He and Russell (2001). The latter investigators found that ζ2β2 (Hb Portland-2) and ζ2ɛ2 (Hb Gower-1), which both have Ac-Ser at the N-terminus of their ζ-subunits, have reduced Hill coefficients (n values of 1.6 and 1.7, respectively) compared to the normal values of 2.5–3.0 for the corresponding tetramers with α-subunits in the place of ζ-subunits, α2β2 (HbA) and α2ɛ2 (Hb Gower-2) (Table 3). As we have shown (Ashiuchi et al. 2005), substitutions of Ac-Ser for the usual Val at the N-terminus of the α-subunit of HbA results in a reduced cooperativity and a weakening of subunit interactions. This reduction in cooperativity is similar in magnitude to that for the embryonic hemoglobins containing ζ-subunits described by He and Russell (2001; see Table 3 herein). In contrast, the same Ac-Ser substitution at the N-terminus of the β-subunit had no such effect (Ashiuchi et al. 2005). The N-terminal network involving the α-subunit is intimately involved in the R/T conformational switch between the oxy and the deoxy states that gives rise to cooperativity (Perutz 1989). Since this network is not extensive, even a small change there could influence cooperativity. On the other hand, the network surrounding the N-terminus of the β-subunits is extensive so that a similar change there may not be sufficient to produce such an effect. It is possible that a similar mechanism also contributes to the reduced cooperativity in some of the embryonic hemoglobins.
Table 3.
Cooperativity in α- or ζ-substituted hemoglobins

Structure of α- and ζ-subunits
Although the overall backbone architecture of the α- and ζ-subunits reported by Silva et al. (1992) for α2β2 and by Kidd et al. (2001) for ζ2γ2 (Fig. 12) indicate that they are very similar, various amino acid side chain substitutions do affect the electrostatics of each structure differently. Analysis of the electrostatic surface potentials (GRASP) shows that the region joining helices G and H is more electronegative in ζ compared to α. Another difference is the region joining helices F and G, which is more electropositive in α than in ζ. Finally, the orientations of the C-terminal residues in ζ make them more electropositive than those in α. These differences could contribute to the increased overall dissociation of subunit interfaces containing ζ rather than α subunits.
Figure 12.

Ribbon diagrams of the aligned backbones of the PDB structures of the α-subunit of HbA (blue) (Silva et al. 1992) and the ζ-subunit of Hb Portland-1 (red) (Kidd et al. 2001). Insight II 2000 was used.
Structural examination of the interface between monomers in the ζγ dimer shows two hydrogen bonds between residues Arg-30(γ)–Phe-117(ζ) and between Ile-116(γ)–Pro-114(ζ) and a destabilizing interaction (bad contact) between residues Lys-120(γ)–Arg-112(ζ); Arg-112(ζ) is replaced by a His residue in the α-subunit. In the αβ dimer structure, no destabilizing interactions between monomers were found but four hydrogen bonds were found between residues Phe-122(β)–Arg-31(α), Gln-131(β)–His-103(α), His-116(β)–Pro-114(α), and Arg-30(β)–Phe-117(β). Based on these observations one can conclude that the monomer-to-monomer stabilization would be greater in the αβ structure than in the ζγ structure.
Relationship between tetramer–dimer and dimer–monomer equilibria
The data for the tetramer–dimer equilibrium constants for all hemoglobins studied here are represented as a Hill plot (Fig. 8). K d values range ∼3 orders of magnitude (0.01–10.0 μM; Table 1). Of the eight possible combinations of α or ζ with β, γ, δ, or ɛ subunits, only seven are represented in Figure 8. The unnamed ζ2δ2 has not been studied since it is so rare, but we anticipate that its tetramer–dimer dissociation profile would be close to that of ζ2β2. Because there is a relatively wide range in the lines shown in Figure 8, the amount of tetrameric state achieved for each hemoglobin could vary considerably. However, other factors, such as the stabilities of the mRNAs for a given subunit type (Russell et al. 1998), need to be considered. There is also a significant important contribution of the dimer–monomer equilibria to the overall equilibria in Equation 1. The subunit contacts between monomers not only have variable strengths but also a kinetic component that is slow in the direction of dissociation to different extents for all the hemoglobins in contrast to the tetramer–dimer equilibria which are very rapid in both directions. The results suggest that these two equilibria are not related to the same extent since they are based upon independent structural features of each component monomer. For example, Hb Portland-1 (ζ2γ2) and Hb Gower-2 (α2ɛ2) undergo rapid and moderate rates of subunit exchange, respectively, with β-subunits (see Figs. 9 and 10), and both have relatively low tetramer–dimer K d values of 0.31 and 0.17 μM, respectively. In contrast, the exchange rates for HbA2 and HbF are both relatively slow (see Fig. 10), yet their tetramer–dimer K d values differ widely (0.77 and 0.01 μM, respectively). Further studies are needed to gain a fuller understanding of this relationship.
Hemoglobin ontogeny and subunit interface strengths
The amounts of the various hemoglobins present from the very early embryonic period through the fetal stage and into adulthood (ontogeny) have been reported by several investigators, including Huehns et al. (1964c), Huehns and Shooter (1965), and Kleihauer (1970). Embryonic, fetal, and adult hemoglobins attain their highest concentrations at different times during development (Fig. 1). While Hb Gower-1, Hb Gower-2, Hb Portland-1, HbF, and HbA are all present in very early embryonic red cells, only HbA and HbF are present at birth. HbF slowly disappears after birth (Fig. 1) and is replaced by HbA. A mechanism whereby the amount of HbF could decrease may involve its acetylation since HbF1 has loosened subunit contacts relative to HbF, leading to enhanced subunit exchange (Fig. 10, left panel). By 1 year of age, HbA predominates (92% of total Hb) with low concentrations of HbA2 (2.5% of total Hb) and trace amounts of HbF (<1% of total Hb) (Bunn and Forget 1986); hemoglobins with post-translational modifications, such as glycosylated HbA1c, make up the remainder.
The monomer–monomer subunit interface strengths of the hemoglobins, as summarized in Table 2 and Figure 13, resemble their chronological occurrences depicted in Figure 1. Those with the weakest interfaces have the shortest half-lives and appear early, while those with strong interfaces occur later and persist longer, representing a maturation of protein subunit interactions (see discussion above related to Fig. 12). Hence, the intrinsic properties of the subunits themselves regarding their ability to form weak or strong interfaces with other subunits may influence the half-lives of the hemoglobin tetramers in which they occur in the red cell. Such a role may apply to other protein assemblies if their constituent subunits have variable interface strengths that are subject to change, as discussed in the subunit competition model below.
Figure 13.

Exchange rates of hemoglobins. These rates were calculated either from the disappearance of a particular Hb in the presence of β4 or from the appearance of HbA in the presence of β4 at 0.5 μM concentrations of each. To obtain exchange rates for Hb Portland-1, Gower-1, and Gower-2 from the disappearance of these hemoglobins, data in Fig. 9 were plotted as a first-order plot, and the slope of the linear portion of the line was taken as the rate. To obtain the exchange rates for HbF, A2 and Gower-2 from the appearance of HbA, the rates were calculated directly from the right panel of Fig. 10. There was good agreement for the exchange rate of Hb Gower-2 whether the data were plotted as the Hb decrease (0.022%/min) or as the appearance of HbA (0.018%/min). Note that the y-axis has a log scale that spans three orders of magnitude.
The subunit competition model
Since the strengths of the monomer–monomer interface contacts as well as those of the dimer–dimer contacts are unequal for all the natural human hemoglobins, subunit interface strengths may play a role in establishing the type and proportion of the individual Hb heterotetramers at different developmental stages. In other words, developmental Hb switching by post-translational events may influence heterotetramer assembly. Because the subunit interface strengths differ so widely and because they have variable time dependencies for dissociation of the monomer–monomer interfaces, dimer strengths such as strong vs. weak having different dissociation rates, i.e., fast vs. slow, means that some will disassemble while others remain intact over time, thus conferring differences in protein assembly stability and kinetics and hence competition among them. As a result of this subunit competition, subunit exchange can occur with stronger subunit interfaces being formed from those that are weaker. In addition, this effect could contribute to differences in heterotetramer assembly that are observed in individuals with globin gene defects.
Protein subunit exchange is known to occur in both native and mutant proteins as diverse as human lens crystallins (van den Oetelaar et al. 1990; Sun and Liang 1998; Sobott et al. 2002), in a bacteriophage transcription repressor protein (Lambert et al. 2001), and in transthretin, a transporter protein for thyroxine. Transthretin undergoes subunit exchange with one of its mutant forms that produces a misfolded amyloid protein stabilized by an altered subunit interface strength (Hammarström et al. 2001; Sebastiao et al. 2001).
Variable subunit interaction strengths could also be relevant for other protein assemblies and networks in addition to the hemoglobin system described here. If competing protein subunits are present, differences in the strengths of their subunit contacts could even determine multiple pairings in larger protein assemblies. If subsequent changes occur in their contact strengths, due to either a weakening or a strengthening induced by post-translational modifications or to the presence of a mutant protein subunit, then the lifespan of the complete assembly may be affected. These concepts require testing.
Materials and Methods
Hemoglobins
The purification of hemoglobins Gower-1, Gower-2, Portland-1, and Portland-2 from the blood of transgenic mice (He and Russell 2001) is described below. Naturally occurring HbA, HbA2, and HbS were purified from human red cells as described previously (Manning et al. 1999). HbF and HbF1 were purified from umbilical cord blood as also described earlier (Manning and Manning 2001). Hb Rothschild, a naturally occurring dimeric Hb mutant, was provided by the late Dr. Ruth Benesch. All hemoglobins were pure as shown by isoelectric focusing (Fig. 2) and had the correct masses. All were used in the CO-liganded state. Naturally occurring HbH (β4) was provided by the late Dr. Ruth Benesch and Suzanna Kwong. It had been stored at −80°C in highly concentrated form in the oxy state. Its visible absorption spectrum taken at the time of these studies was normal, and there was no detectable met-Hb. “Synthetic” β4 was prepared from the β-subunits of HbA whose individual subunits were separated chromatographically as the p-hydroxymercuribenzoate (HMB) derivative as described by Manning (1981). The HMB-β subunits were treated with a 140-fold excess of 2-mercaptoethanol to remove the HMB group. After removal of excess thiol using a Centricon-10 apparatus, the sample was purified on a Mono S column and concentrated to 20 μM. Its behavior during gel filtration on Superose-12 was identical to that of the natural β4, each showing a mixture of tetramers, dimers, and monomers. “Synthetic” β4 also underwent subunit exchange with Hb Gower-2 (α2ɛ2) to form HbA (α2β2).
Expression and purification of embryonic hemoglobins
Blood from transgenic mice was collected into phosphate-buffered saline containing EDTA and then bubbled with CO. Red cells were obtained by centrifugation, and the cell pellet was frozen at −80°C. In the present report, we employed a cation-exchange chromatography column (CM-52, Whatman, 1 × 20 cm) to purify Hb Portland-2, Hb Gower-1, and Hb Gower-2. A frozen hemolyzate (0.25 mL) was thawed and immediately dialyzed overnight at 4°C against three changes of the CO-saturated CM-52 starting buffer. After the sample was applied to the column, a linear gradient of 150 mL each of the starting buffer (10 mM potassium phosphate, 0.5 mM EDTA, 0.5 mM EGTA, pH 6.0) and the second buffer (15 mM potassium phosphate, 0.5 mM EDTA, 0.5 mM EGTA, pH 8.0) was used. Human Hb Portland-2 and a hybrid Hb consisting of mouse α-subunits and human β-subunits were well separated and present in approximately equal amounts.
Hb Portland-1 proved difficult to purify by the procedure above, most likely because the slightly acidic pH buffer used on CM-52 led to its dissociation during chromatography (Kidd et al. 2001). Therefore, we employed the anion exchanger Mono Q (HR 5/5) on FPLC with 20 mM Tris-Ac, pH 7.5, as the buffer. A 0%–20% gradient of 0–1 M NaCl over 20 min led to the complete separation of Hb Portland-1 and the hybrid mouse Hb.
Measurement of monomer–monomer strengths by subunit exchange
Equimolar amounts of a given CO-liganded Hb and β4 were mixed at room temperature for various times up to 96 h in 10 mM potassium phosphate, 0.5 mM EDTA, and 0.5 mM EGTA, pH 6.3. A higher ratio of β4:Hb did not significantly accelerate the rate of exchange. Aliquots were removed at selected intervals and analyzed either for the amount of the initial Hb remaining or the amount of HbA (α2β2) formed in the exchange reaction with β4. These latter analyses were performed on a Mono S (HR 5/5) column attached to an FPLC unit with the detector set at 405 nm. Either one of two gradient systems was employed, depending on which gave the better separation. To measure the appearance of HbA from either HbA2 or Hb Gower-2, a 0%–20% gradient of 10 mM potassium phosphate, 0.5 mM EDTA, 0.5 mM EGTA, pH 6.3, and the same buffer containing 1 M NaCl established over a period of 40 min was used. For measurement of HbA formed from HbF or determination of Hb Gower-1 disappearance, this same gradient established over a period of 20 min was employed. Samples analyzed over the same time periods but in the absence of β4 did not show any material eluting in the position of HbA. When two or three hemoglobins with relatively weak subunit interfaces were mixed to study formation of new hemoglobins with stronger subunit interfaces, the protocol above for the exchange reaction was used but the subsequent analysis was performed by isoelectric focusing.
To quantitate the amount of HbA formed or the amount of the initial Hb that disappeared, copies of the recording traces were made and each separate peak was cut out and weighed. The amount of either HbA formed or Hb remaining was calculated as a percentage of that Hb over the total weight of remaining reactants and products formed not including minor peaks.
Isoelectric focusing
The pH 6–8 Resolve Hb gel system from PerkinElmer was operated at 600 volts for 15 min and then at 900 volts for another 30 min. The gels were then fixed in 10% trichloroacetic acid for 15 min and washed with H2O for 15 min. Visualization of the bands was done by staining with the JB-2 O-anisidine-based system from PerkinElmer followed by extensive washing with H2O and drying.
Mass spectrometry
These procedures have been described previously (Li et al. 1999; Yagami et al. 2002; Ashiuchi et al. 2005). Reagents used for mass spectrometry were all of spectral or HPLC grade: Optima-grade methanol from Fisher Scientific Co.; HPLC-grade acetonitrile and water and ACS-grade 98% formic acid from Pierce Chemical Co.; sequencing-grade trifluoroacetic acid (TFA), triethylamine (TEA), and phenylisothiocyanate (PITC) from Applied Biosystems; and glacial acetic acid from Sigma Aldrich. Clear polypropylene microcentrifuge tubes were purchased from National Scientific Supply Co. Sample concentration values given here were related to hemoglobin concentration unless stated otherwise.
Enzymatic cleavage of globin chains
Fifty picomoles of hemoglobin was digested with trypsin as described by Ashiuchi et al. (2005). A separate enzymatic reaction, using the same amounts of enzyme and embryonic hemoglobin, was carried out with endoproteinase Arg-C (Roche Diagnostics Corp.) in 25 μL of 90 mM Tris-HCl buffer, 8.5 mM calcium chloride, dithiothreitol, 0.l5 mM EDTA, pH 7.6. Tryptic peptides were derivatized with phenylisothiocyanate as described previously (Yagami et al. 2002; Ashiuchi et al. 2005).
Mass-spectrometric fragmentation
To fully characterize the sequence of both subunits in the embryonic hemoglobin, most tryptic peptides and a few Arg-C peptides were subjected to mass-spectrometric fragmentation. These peptides were selected to produce full sequence coverage for both the ζ and β chains. Peptide solutions were prepared by dilution in water/methanol/acetic acid (24:75:1, v/v/v) and infused at a constant flow rate of 0.5 μL/min through a 50-μm fused silica capillary into the electrospray ionization source of a Finnigan LCQ mass spectrometer and electrosprayed at voltages between +2.8 and +3.2 kV by means of a liquid junction. Desolvation of peptide ions was accomplished by maintaining the heated capillary at 135°C and using declustering potentials between −50 and −65 V across the tube lens. Data acquisition was performed using five microscans with the automatic gain control on, either a maximal ion injection time set to 500 ms or a maximal number of counts of 5 × 10⁷ counts, an isolation width of ±2 m/z units, a relative collision energy of 25%–35% (Finnigan's nomenclature), activation times of 100 ms, and an activation q value of 0.25. One hundred scans were averaged prior to acquisition to produce a single full-scan spectrum in profile mode.
Circular dichroism
These measurements were performed by Dr. Alvaro Martinez del Pozo on liganded Hb using a Jasco 715 apparatus as described previously (Martin de Llano and Manning 1994). The spectra were recorded four times and averaged. The spectra of Hb Portland-2 and of HbA were recorded on the same day and at the same concentration (10.4 μM as tetramer).
Tetramer–dimer dissociation constants (Kd)
These procedures, including data analysis, have been described in detail previously (Manning et al. 1996, 1999) and are summarized briefly here. The concentration of each Hb was accurately determined by amino acid analysis for calculation of the final K d value. Superose-12 was used to determine the peak position of the sample in the concentration range where it was undergoing tetramer dissociation initially to dimers and then to monomers (for Hb Portland-2). The column was calibrated with an intra-cross-linked Hb tetramer, the natural dimeric Hb Rothschild, and the monomeric p-hydroxymercuribenzoate derivative of the Hb α-subunit as described earlier (Manning et al. 1996, 1999).
Equation 2 above is a rearranged form of Equation 6 in Manning et al. (1996). In order to obtain a better fit to the data at the higher Hb concentrations, a factor of 0.875 was applied to the curve for Hb Gower-2, and a factor of 1.13 applied to the curves for Hb Portland-1 and Hb Portland-2. It is likely that this is due to the propensity of the embryonic hemoglobins to form monomers. The original equation (Manning et al. 1996) was derived for adult HbA, which has primarily a tetramer–dimer equilibrium.
Acknowledgments
We are grateful to Roger Avelino for his substantial help with the typescript, to Darshan Kothari for the Grafit figures, to Dr. Alvaro Martinez del Pozo for the circular dichroism experiments, and to Dr. Fred Davis for his important support. This work was supported in part by NIH Grants HL-18819 (J.M.M.), HL-58512 (R.W. Briehl), HL-61399 (J.E.R.), and RR-00862 (B.T.C.).
Footnotes
When referring to subunit interfaces, the term “strength” rather than the ambiguous term “stability” is used since lack of stability also refers to mutant hemoglobins where the protein is unstable and precipitates. None of the hemoglobins described here suffers from such problems.
Reprint requests to: James M. Manning, Department of Biology, Mugar 134, Northeastern University, 360 Huntington Avenue, Boston, MA 02115, USA; e-mail: jmanning@lynx.neu.edu; fax: (617) 373-4496.
Article and publication are at http://www.proteinscience.org/cgi/doi/10.1110/ps.072891007.
References
- Adachi K., Zhao, Y., Yamaguchi, T., and Surrey, S. 2000. Assembly of γ with α globin chains to form human fetal hemoglobin in vitro and in vivo. J. Biol. Chem. 275: 12424–12429. [DOI] [PubMed] [Google Scholar]
- Antonini E. and Brunori, M. 1971. Hemoglobin and myoglobin in their reactions with ligands. North-Holland Publishing Co, Amsterdam, The Netherlands.
- Ashiuchi M., Yagami, T., Willey, R.J., Padovan, J.C., Chait, B.T., Popowicz, A., Manning, L.R., and Manning, J.M. 2005. N-terminal acetylation and protonation of individual hemoglobin subunits. Protein Sci. 14: 1458–1471. [DOI] [PMC free article] [PubMed] [Google Scholar]
- Atha D.H. and Riggs, A. 1976. Tetramer–dimer dissociation in hemoglobin and the Bohr effect. J. Biol. Chem. 251: 5537–5543. [PubMed] [Google Scholar]
- Beavis R.C. and Chait, B.T. 1996. Matrix-assisted laser desorption ionization mass spectrometry of proteins. Methods Enzymol. 270: 519–551. [DOI] [PubMed] [Google Scholar]
- Benesch R., Benesch, R.E., Ranney, H.M., and Jacobs, A.S. 1962. Isomeric forms of haemoglobin H. Nature 194: 840–842. [DOI] [PubMed] [Google Scholar]
- Borgstahl G.E.O., Rogers, P.H., and Arnone, A. 1994. The 1.8 Å structure of carbonmonoxy-β4 hemoglobin. J. Mol. Biol. 236: 817–830. [DOI] [PubMed] [Google Scholar]
- Brittain T. 2004. Measuring assembly and binding in human embryonic hemoglobins. Methods Enzymol. 379: 64–80. [DOI] [PubMed] [Google Scholar]
- Bunn H.F. 1981. Use of gel electrofocusing in the analysis of hybrid hemoglobins. Methods Enzymol. 76: 126–133. [DOI] [PubMed] [Google Scholar]
- Bunn H.F. 1987. Subunit assembly: An important determinant of hematologic phenotype. Blood 69: 1–6. [PubMed] [Google Scholar]
- Bunn H.F. and Forget, B.G. 1986. Hemoglobin: Molecular, genetic and clinical aspects. W.B. Saunders, Philadelphia, PA.
- Chu A. and Ackers, G.K. 1981. Mutual effects of protons, NaCl, and oxygen on the dimer–tetramer dimer–tetramer assembly of human hemoglobin. The dimer Bohr effect. J. Biol. Chem. 256: 1199–1205. [PubMed] [Google Scholar]
- Dumoulin A., Manning, L.R., Jenkins, W.T., Winslow, R.M., and Manning, J.M. 1997. Exchange of subunit interfaces between recombinant adult and fetal hemoglobins. Evidence for a functional inter-relationship among regions of the tetramer. J. Biol. Chem. 272: 31326–31332. [DOI] [PubMed] [Google Scholar]
- Dumoulin A., Padovan, J.C., Manning, L.R., Popowicz, A., Winslow, R.M., Chait, B.T., and Manning, J.M. 1998. The N-terminal sequence affects distant helix interactions in hemoglobins. Implications for mutant proteins from studies on recombinant hemoglobin felix. J. Biol. Chem. 273: 35032–35038. [DOI] [PubMed] [Google Scholar]
- Griffith W.P. and Kaltashov, I.A. 2003. Highly asymmetric interactions between globin chains during hemoglobin assembly revealed by electrospray ionization mass spectrometry. Biochemistry 42: 10024–10033. [DOI] [PubMed] [Google Scholar]
- Hammarström P., Schneider, F., and Kelly, J.W. 2001. Trans-suppression of misfolding in an amyloid disease. Science 293: 2459–2462. [DOI] [PubMed] [Google Scholar]
- He Z. and Russell, J.E. 2001. Expression, purification, and characterization of human hemoglobins Gower-1 (ζ 2ɛ2), Gower 2 (α2ɛ2) and Portland-2 (ζ2β2) assembled in complex transgenic-knockout mice. Blood 97: 1099–1105. [DOI] [PubMed] [Google Scholar]
- Hoffman O. and Brittain, T. 1996. Ligand binding kinetics and dissociation of human embryonic hemoglobins. Biochem. J. 315: 65–70. [DOI] [PMC free article] [PubMed] [Google Scholar]
- Huehns E.R. and Shooter, E.M. 1965. Human haemoglobins. J. Med. Genet. 2: 48–90. [DOI] [PMC free article] [PubMed] [Google Scholar]
- Huehns E.R., Beaven, G.H., and Stevens, B.L. 1964a. Recombination studies on haemoglobins at neutral pH. Biochem. J. 92: 440–444. [DOI] [PMC free article] [PubMed] [Google Scholar]
- Huehns E.R., Hecht, F., Keil, J.V., and Motulsky, A. 1964b. Developmental hemoglobin anomalies in a chromosomal triplication: D1 trisomy syndrome. Proc. Natl. Acad. Sci. 51: 89–97. [DOI] [PMC free article] [PubMed] [Google Scholar]
- Huehns E.R., Shooter, E.M., and Beaven, G.H. 1964c. The time course of the recombination of human adult and canine haemoglobins. Biochem. J. 91: 331–334. [DOI] [PMC free article] [PubMed] [Google Scholar]
- Jones R.T. and Schroeder, W.A. 1963. Chemical characterization and subunit hybridization of human hemoglobin H and associated compounds. Biochemistry 2: 1357–1367. [DOI] [PubMed] [Google Scholar]
- Kalkum M., Llyon, G.J., and Chait, B.T. 2003. Detection of secreted peptides by using hypothesis-driven multistage mass spectrometry. Proc. Natl. Acad. Sci. 100: 2795–2800. [DOI] [PMC free article] [PubMed] [Google Scholar]
- Kawamura-Konishi Y. and Suzuki, H. 1989. Reconstitution of human fetal hemoglobins from isolated α and γ chains. Biochem. Int. 19: 469–476. [PubMed] [Google Scholar]
- Kidd R.D., Mathews, A., Baker, H.M., Brittain, T., and Baker, E.N. 2001. Subunit dissociation and reassociation leads to preferential crystallization of hemoglobin Bart's (γ4) from solutions of embryonic haemoglobin Portland (ζ2γ2) at low pH. Acta Crystallogr. Sect. D, Biol. Crystallogr. D57: 921–924. [DOI] [PubMed] [Google Scholar]
- Kleihauer E. 1970. The hemoglobins. In Physiology of the perinatal period (ed. U. Stave). Vol. Vol. 1, p. 255. Appleton-Century-Crofts, New York. [Google Scholar]
- Lambert L.J., Schirf, V., Demeler, B., Cadene, M., and Werner, M.H. 2001. Flipping a genetic switch by subunit exchange. EMBO J. 20: 7149–7159. [DOI] [PMC free article] [PubMed] [Google Scholar]
- Li X., Himanen, J.-P., Martin de Llano, J.J., Padovan, J.C., Chait, B.T., and Manning, J.M. 1999. Mutational analysis of sickle haemoglobin (Hb) gelation. Biotechnol. Appl. Biochem. 29: 165–184. [PubMed] [Google Scholar]
- Manning J.M. 1981. Preparation of hemoglobin carboxylated at specific NH2-terminal residues. Methods Enzymol. 76: 159–167. [DOI] [PubMed] [Google Scholar]
- Manning L.R. and Manning, J.M. 2001. The acetylation state of human fetal hemoglobin modulates the strength of its subunit interactions: Long-range effects and implications for histone interactions in the nucleosome. Biochemistry 40: 1635–1639. [DOI] [PubMed] [Google Scholar]
- Manning J.M., Dumoulin, A., Li, X., and Manning, L.R. 1998. Normal and abnormal protein subunit interactions in hemoglobins. J. Biol. Chem. 273: 19359–19362. [DOI] [PubMed] [Google Scholar]
- Manning L.R., Jenkins, W.T., Hess, J.R., Vandegriff, K., Winslow, R.M., and Manning, J.M. 1996. Subunit dissociations in natural and recombinant hemoglobins. Protein Sci. 5: 775–781. [DOI] [PMC free article] [PubMed] [Google Scholar]
- Manning L.R., Dumoulin, A., Jenkins, W.T., Winslow, R.M., and Manning, J.M. 1999. Determining subunit dissociation constants in natural and recombinant proteins. Methods Enzymol. 306: 113–129. [DOI] [PubMed] [Google Scholar]
- Martin de Llano J.J. and Manning, J.M. 1994. Properties of a recombinant human hemoglobin double mutant: Sickle hemoglobin with Leu-88(β) at the primary aggregation site substituted by Ala. Protein Sci. 3: 1206–1212. [DOI] [PMC free article] [PubMed] [Google Scholar]
- Perutz M. 1989. Mechanisms of cooperativity and allosteric regulation in proteins. Q. Rev. Biophys. 22: 139–237. [DOI] [PubMed] [Google Scholar]
- Philo J.S., Lary, J.W., and Schuster, T.M. 1988. Quaternary interactions in hemoglobin β subunit tetramers. J. Biol. Chem. 263: 682–689. [PubMed] [Google Scholar]
- Randhawa Z.I., Jones, R.T., and Lie-Injo, L.E. 1984. Human hemoglobin Portland II (ζ2β2). J. Biol. Chem. 259: 7325–7330. [PubMed] [Google Scholar]
- Russell J.E., Morales, J., Makeyev, A.V., and Liebhaber, S.A. 1998. Sequence divergence in 3′ untranslated regions of human ζ and α globin in RNAs mediates a difference in their stabilities and contributes to efficient α to ζ gene developmental switching. Mol. Cell. Biol. 18: 2173–2183. [DOI] [PMC free article] [PubMed] [Google Scholar]
- Sebastiao M.P., Lamyin, V., Saraeva, M.J., and Damas, A.M. 2001. Transthyretin stability as a key factor in amyloidogenesis: X-ray analysis at atomic resolution. J. Mol. Biol. 306: 733–744. [DOI] [PubMed] [Google Scholar]
- Silva M.M., Rogers, P.H., and Arnone, A. 1992. A third quaternary structure of human hemoglobin A at 1.7Å reduction. J. Biol. Chem. 267: 17248–17256. [PubMed] [Google Scholar]
- Sobott F., Benesch, J.L.P., Vierling, E., and Robinson, C.V. 2002. Subunit exchange of multimeric protein complexes. J. Biol. Chem. 277: 38921–38929. [DOI] [PubMed] [Google Scholar]
- Stamatoyannopoulos G. and Grosveld, F. 2001. The molecular basis of blood diseases (eds. G. Stamatoyannopoulos, P.W. Majerus, R.M. Perlmutter, and H. Varmus), pp. 135–182. W.B. Saunders Co, Philadelphia, PA.
- Sun T.-X. and Liang, J.J.-N. 1998. Intermolecular exchange and stabilization of recombinant human αA- and αB-crystallin. J. Biol. Chem. 273: 286–290. [DOI] [PubMed] [Google Scholar]
- Turner G.J., Galacteros, F., Doyle, M.L., Hedlund, B., Pettigrew, D.W., Turner, B.W., Smith, F.R., Moo-Penn, W., Rucknagel, D.L., and Ackers, G.K. 1992. Mutagenic dissection of hemoglobin cooperativity. Proteins 14: 333–350. [DOI] [PubMed] [Google Scholar]
- Valdes R. and Ackers, G.K. 1977. Thermodynamic studies on subunit assembly in human hemoglobin. J. Biol. Chem. 252: 74–81. [PubMed] [Google Scholar]
- van den Oetelaar P.J.M., van Someren, P.F.H.M., Thomson, J.A., Siezen, R.J., and Hoenders, H.J. 1990. A dynamic quaternary structure of bovine α-crystallin as indicated from intermolecular exchange of subunits. Biochemistry 29: 3488–3493. [DOI] [PubMed] [Google Scholar]
- Yagami T., Ballard, B.T., Padovan, J.C., Chait, B.T., Popowicz, A.M., and Manning, J.M. 2002. N-terminal contributions of the γ-subunit of fetal hemoglobin to its tetramer strength. Protein Sci. 11: 27–35. [DOI] [PMC free article] [PubMed] [Google Scholar]