

Abstract
The receptor-associated protein (RAP) is a molecular chaperone that binds tightly to certain newly synthesized LDL receptor family members in the endoplasmic reticulum (ER) and facilitates their delivery to the Golgi. We have adopted a divide-and-conquer strategy to solve the structures of the individual domains of RAP using NMR spectroscopy. We present here the newly determined structure of domain 2. Based on this structure and the structures of domains 1 and 3, which were solved previously, we utilized experimental small-angle neutron scattering (SANS) data and a novel simulated annealing protocol to characterize the overall structure of RAP. The results reveal that RAP adopts a unique structural architecture consisting of three independent three-helix bundles that are connected by long and flexible linkers. The flexible linkers and the quasi-repetitive structural architecture may allow RAP to adopt various possible conformations when interacting with the LDL receptors, which are also made of repetitive substructure units.
Keywords: multidomain protein, receptor-associated protein, global order
The receptor-associated protein (RAP) is an endoplasmic reticulum (ER) resident chaperone that is required for the maturation of several members of the low-density lipoprotein (LDL) receptor family, including the LDL receptor–related protein (LRP or LRP1). This receptor family includes the LDL receptor, LRP, LRP1b, gp330/megalin/LRP2, LRP5, LRP6, the very-low-density lipoprotein (VLDL) receptor, and the apoE receptor 2 (Krieger and Herz 1994; Strickland et al. 2002). LRP plays a prominent role in developmental biology, lipoprotein metabolism, and catabolism of proteases involved in matrix remodeling, blood coagulation, and fibrinolysis (Herz and Strickland 2001). It binds and mediates the endocytosis of a wide variety of ligands, which include α2-macroglobulin–protease complexes (α2M), tissue-type plasminogen activators, urokinase plasminogen activators, and toxins such as Pseudomonas exotoxin A (Sarti et al. 2000; Strickland et al. 2002). LRP also plays important roles in maintaining the integrity of vessel walls (Boucher et al. 2003), the blood–brain barrier (Yepes et al. 2003), and in the clearance of apoptotic cells by mediating their phagocytosis (Gardai et al. 2005).
The effective delivery of LRP to the cell surface requires RAP, and the amount of functional LRP is significantly reduced in the liver and brain of RAP-deficient mice (Willnow et al. 1995). As a molecular chaperone and/or escort protein for the LDL receptor family, RAP prevents the premature interaction between members of this receptor family and their ligands in the ER, thereby preventing them from being degraded in lysosomes and facilitating their delivery to the cell surface (Willnow et al. 1995, 1996; Hsieh et al. 2003).
RAP is a modular protein that contains three domains: D1, D2, and D3 (Bu et al. 1995; Lazic et al. 2003), which are thought to have distinct functions (Obermoeller et al. 1997). The carboxyl-terminal domain (D3) of RAP is required for folding and trafficking of LRP, whereas the amino-terminal tandem D1D2 domains of RAP are required for blocking the binding of certain ligands, such as activated forms of α2-macroglobulin, to LRP (Obermoeller et al. 1997). RAP associates with LRP early in the secretory pathway, reducing its ligand-binding capacity, and then dissociates from LRP in the lower pH encountered in the Golgi (Bu et al. 1995). Our recent studies demonstrate that histidine residues serve as a switch in RAP D3 that facilitates its uncoupling from the receptor in the low-pH environment of the Golgi (Lee et al. 2006a).
Insight into the function of RAP and its mode of interaction with LRP requires the elucidation of the three-dimensional structure of this protein. To date, the structures of two of the three individual domains in RAP have been reported (Nielsen et al. 1997; Wu et al. 2004; Lee et al. 2006a). Here we present the structure of D2, which, along with the structures of D1 and D3, allows us to determine the overall structure of full-length RAP based on small-angle neutron scattering (SANS) data.
Results
Structure determination of D2 and mechanism of D1D2 binding to LRP
Based on nearly complete 1H/13C/15N signal assignments of D2 (residues 100–216), we assigned more than 1400 sequential, short-, medium-, and long-range NOEs. We then used these NOEs as distance restraints, together with 154 dihedral-angle restraints from the secondary chemical-shift index (Wishart and Sykes 1994; Wishart and Nip 1998), 155 residue dipolar couplings (RDCs), 65 hydrogen-bond restraints, and 158 secondary chemical-shift restraints to calculate the structure of D2. A summary of the secondary structure diagram and restraints are summarized in Figure S1 of the Supplemental material. On average, there are ∼16 restraints per residue (Table 1). The RDCs of the protein provide important global restraints that complement the short-range NOE and torsion-angle restraints. The RMSD values of the mean structure relative to the 20 lowest-energy conformers for the regular secondary structure region are 0.22 Å for the polypeptide backbone and 0.94 Å for all heavy atoms (Fig. 1). The quality of the structure determination is also manifest from the PROCHECK program (Laskowski et al. 1993), which shows that the ϕ and ψ angles of D2 are 67% in the most favorable, 22% in the allowable, 8% in the generously allowable, and 3% in the disallowed regions of the ϕ,ψ-plane.
Table 1.
Restraints and structural statistics of domain 2 of RAP

Figure 1.

Stereoview of the backbone atoms of the 20 lowest-energy conformers representing the solution structure of D2. Residues 117–208, excluding a flexible loop (residues 162–183), are used for a superposition for minimal RMSD of the backbone atoms. The polypeptide backbones are colored in cyan. The heavy atoms of side chains from the superimposed residues are shown in yellow. The N- and C-termini are indicated.
The solution structure of D2 is composed of three α-helices consisting of the residues 117–127 (α4), 132–161 (α5), and 184–208 (α6) (the α-helices are numbered in the context of the full-length RAP). The N-terminal peptide segment of residues 101–116 is flexible and disordered. The linker between α4 and α5 is well-defined, whereas the linker between α5 and α6 is 23 amino acids long and is disordered (see the heteronuclear NOE data in a later section) and susceptible to protease digestion (Rall et al. 1998). A search using the program MOLMOL with generous criteria confirmed that there is no salt bridge in the structure. As in D1 and D3 of RAP (Wu et al. 2004; Lee et al. 2006a), hydrophobic interactions within the core of the D2 structure appear to be important in stabilizing this three-helical bundle. Consequently, the relative arrangement of the three helices is determined primarily by a number of hydrophobic contacts involving the side chains of residues L117, L120, W121, and A124 in α4; L135, L138, W139, F142, V149, Y152, L156, and L159 in α5; and L183, I197, L201, L204, and V207 in α6. In addition, the individual helices are further stabilized by regular hydrogen bonds, as indicated by the presence of the medium-range NOE connectivities.
In addition to the ability of D3 of RAP to bind to LRP with high affinity, tandem domains D1D2 contain a high-affinity binding site for LRP (Medved et al. 1999). Competitive binding experiments reveal that D1 and D2 each bind weakly to LRP, but the tandem D1D2 binds much more tightly to LRP (Fig. 2). These observations suggest that the high-affinity binding of D1D2 to LRP results from avidity effects arising from amino acid residues contributed from each domain. The determined D2 structure, along with the structure of D1, makes possible the identification of those residues critical for binding to LRP. Prior work recognized that basic residues in both D2 and D3 are important for the binding of RAP to both LRP and heparin (Melman et al. 2001). For example, Migliorini et al. (2003) showed that K256 and K270 are both essential for the binding of D3 to LRP, while Melman et al. (2001) demonstrated that mutation of the basic cluster R203LR205R206 located in D2, along with R282VSR285SR287EK289 located in D3, resulted in a loss of affinity of RAP for LRP (Melman et al. 2001), implicating some of these residues in the binding interaction. However, the mutation of either cluster alone had little effect on the binding of RAP to LRP. In agreement with the studies of Melman et al. (2001), our data show that the mutation of R203LR205R206 had little effect on the binding of D1D2 to LRP (Supplemental material Fig. S2). However, we identified basic residues within D2, represented by K191 and R195, which we suspected may contribute to the binding of this domain to LRP, as the side chains of K191 and R195 are almost totally surface exposed and prominently protrude from the surface (Supplemental material Fig. S3). Further, we found residues R76 and R79 are in D1 at a similar position (Supplemental material Fig. S3). Thus, we examined the contribution of these residues to the binding interaction using mutational analysis. The conversion of R76 and R79 to alanine resulted in a twofold decrease in affinity of D1D2 for LRP, while conversion of K191 and R195 to alanine resulted in a ninefold decrease in affinity. The combined mutations (K77A/R80A and K191A/R195A) generated a D1D2 molecule with a nearly 40-fold decrease in affinity (Fig. 3). Together, these binding studies confirm that basic residues on D1 and D2 contribute to the binding of these RAP domains to the negatively charged surface of LRP, possibly caused by the direct interaction of the basic residues in D1 and D2 with acidic pockets in LRP in a mode similar to those observed for D3 (Fisher et al. 2006).
Figure 2.

D1 and D2 compete for the binding of 125I-labeled D1D2 to LRP. LRP was immobilized in microtiter wells, and incubated with 125I-labled D1D2 in the presence of indicated concentrations of unlabeled D1D2 (closed down-facing triangles), D1 (closed circles), or D2 (open circles). Error bars were derived from duplicated sets of the experiments.
Figure 3.

Binding of 125I-labeled D1D2 WT and mutants to LRP immobilized on microtiter wells. The data were fit to a single class of sites using LIGAND (Munson and Rodbard 1980), which gave K D values of 3.4, 7.6, 30, and 125 nM for D1D2 WT, R76A/R79A, K191A/R195A, and R76A/R79A K191A/R195A, respectively. Error bars were derived from the duplicated sets of the experiments.
RAP serves as an escort chaperone and an antagonist of ligand binding when it associates with LRP. It dissociates from the receptor via a histidine switch in D3 in responding to the acidic pH environment in the Golgi (Lee et al. 2006b). Interestingly, there are eight histidines in D2 of human RAP, and the electrostatic potential surface of D2 changes dramatically when RAP travels from the ER to the Golgi (Supplemental material Fig. S4). However, mutating all conserved histidines in D2 to alanines does not alter the pH sensitivity of RAP's binding to LRP (Lee et al. 2006b). We note that in cells, RAP is retrieved from the Golgi and returned to the ER by ERD2, a receptor that recognizes a tetrapeptide sequence located at the carboxy terminus of RAP and binds to RAP in the acidic environment of the Golgi (Obermoeller et al. 1997). While RAP's release from LRP has been demonstrated to be mediated by a histidine switch in D3, whether RAP uses a histidine switch in D3 and/or in D2 to mediate the interaction with ERD2 when being returned from the Golgi to the ER is not known.
The three RAP domains are independent and do not interact
A previous study suggested that RAP folds into a globular protein (Rall et al. 1998). The newly determined solution structure of D2, together with previously determined structures of D1 and D3, makes it feasible to delineate the structure of full-length RAP. To derive the structure of full-length RAP from the individual structures of the three domains, we needed to determine first, whether the structures of the individual domains of RAP are faithful representations of those in full-length RAP, and second, whether any domain-to-domain interaction occurs in full-length RAP. Moreover, the answers to these questions will provide some structural insights into possible cooperativity among domains and unique functions of individual domains. To answer these questions, we systematically compared the chemical shifts of the backbone amide groups of the individual domain constructs with those of intact RAP using a combination of 2D-[15N,1H]-TROSY, 3D-TROSY-HNCA spectra. Figure 4, A and B, shows the 2D-[15N,1H]-TROSY spectrum of full-length RAP and the superimposed spectra of the three domains, respectively. The spectra indicate that the distribution patterns of amide cross-peaks in the resolved regions in Figure 4, A and B, are almost identical. Mapping the chemical-shift difference throughout the protein was performed using 3D-TROSY-HNCA (Supplemental material Fig. S5) spectra of the individual domains and full-length RAP to partially resolve extensive overlapping (see Fig. 4C–E). The chemical-shift differences between the individual domains and those in full-length RAP are <0.05 ppm, except in the linker regions, where domain constructs break off. This finding suggests that the structures of the individual domains are preserved and there is no detectable chemical-shift perturbation due to domain-to-domain interaction. The same comparison was also made between the tandem domains (D12, residues 1–216; and D23, residues 106–323), and the results are shown in Figure 5.
Figure 4.

The three domains of RAP fold independently. Comparison of [15N,1H]-TROSY spectra of uniformly 15N,2H,13C-labeled full-length RAP (A) or individual domains superimposed and color coded (magenta for D1, cyan for D2, and blue for D3) (B). Domain construct boundaries are D1 (residues 1–100); D2 (residues 101–216); and D3 (residues 206–323). The [15N,1H]-TROSY spectra were measured with different numbers of scans, and polarization transfer times were optimized (2.7 ms for domain constructs and 2.2 ms for the full-length RAP) for a maximum signal-to-noise ratio for amino groups. The spectrum of full-length RAP was plotted at a low contour level to show as many peaks as possible, including very weak ones, for comparing patterns in the spectra. The comparison shows that the chemical-shift changes between the individual domains and the full-length RAP are insignificant except for the residues in the ends of the domains. The constructs of D2 and D3 have a sequence overlap (residues 206–216). (C, D, E) Amide proton (ΔδH), 15N (ΔδN), and the combined (Δδav) chemical-shift difference between the full-length RAP and its individual domains, respectively. The combined chemical-shift difference was calculated using the formula Δδav = 0.5[ΔδH 2 + (0.2ΔδN)2]0.5 (Pellecchia et al. 1999). The schematic drawing on the top of panel C is the secondary structure of RAP, with boxes and lines representing α-helices and linkers between helices, respectively. For the overlapped peaks, the chemical-shift positions were taken from HNCA spectra, where ∼65% of the amide peaks of the full-length RAP are resolved. All spectra were recorded on a Bruker AVANCE spectrometer operating at a proton frequency of 600 MHz under the same conditions (ca. 1.0 mM-labeled proteins in 95% H2O/5% 2H2O, pH 7.25, 30°C).
Figure 5.
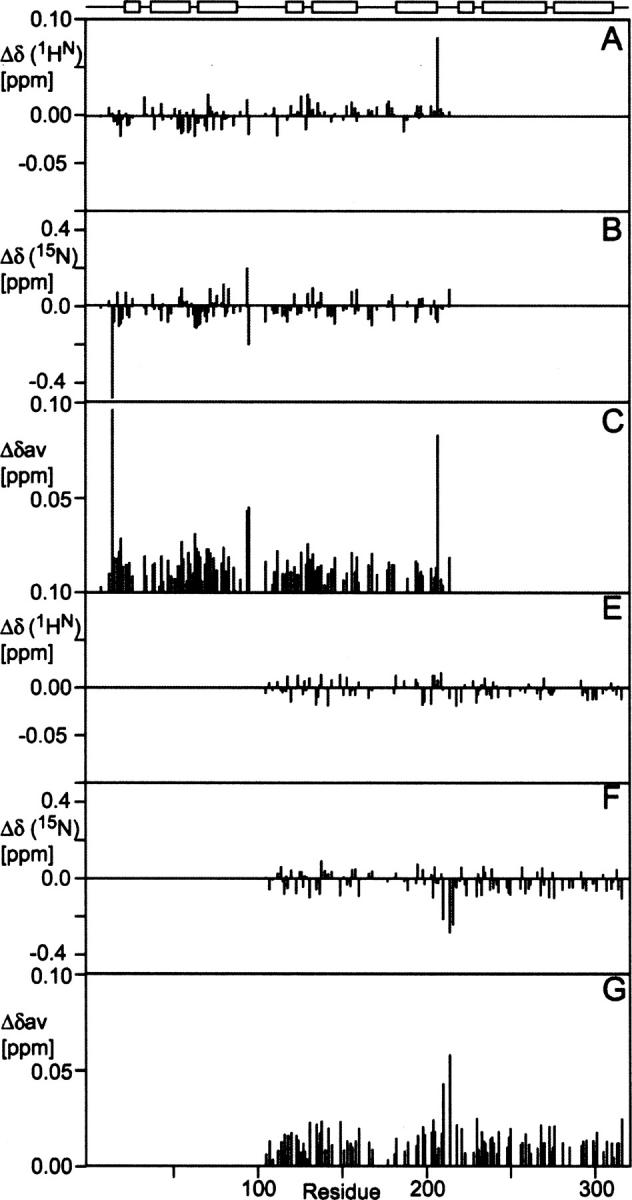
Comparison of chemical shifts of the tandem domains (D12 and D23) and the full-length RAP [1HN (A), 15N (B), and Δδav (C) for D12; 1HN (E), 15N (F), and Δδav (G) for D23]. At the top, the regular secondary structure elements of the full-length RAP are indicated schematically. The chemical-shift differences in the linker regions are <0.05 ppm, suggesting the structures of linkers together with the rest of the protein remain unchanged from the individual domains, the tandem domains to the full-length proteins.
Lazic et al. (2003) have suggested that interdomain interactions may occur between D2 and D3 based on the change in appearance of the heteronuclear single-quantum correlation (HSQC) spectrum of D23 by comparing with the spectra of their individual domains. Their spectrum of the tandem D23 construct has a hallmark of unfolding (congested cross peaks centered ∼8.2 ppm in amide proton frequency) and aggregation (line broadening and decreased sensitivity). We have tested arrays of solution conditions in the process of optimization. We have noticed that D3 was marginally stable under 50 mM NaCl without 75 mM NaPi and the construct D23 aggregated under 50 mM NaCl. D3 is the least stable among the three domains (Lazic et al. 2003). High-quality spectra of the domains and the tandem domain constructs can only be obtained with the solution condition that we have described in this paper. To further determine if interdomain interaction occurs, we titrated a nonlabeled D3 up to a fivefold excess into a 0.2 mM 15N-labeled, perdeuterated D2 sample and monitored the spectral changes in [15N,1H]-HSQC. The acquired spectra showed virtually no change. This result, together with the finding that chemical shifts are nearly identical in the domains, whether they are isolated domain constructs, tandem domain constructs, or the full-length protein, led us to conclude that no detectable interaction occurs among these individual domains. Thus, the individual domain structures are faithful representations of their structure in the full-length protein. These results are in agreement with a previous study using fluorescence emission spectra where the sum spectra of the individual domains is well matched by that of the intact RAP when the protein concentrations were kept at much lower concentrations (Lazic et al. 2003). Furthermore, there appears no functional basis for D3 to be interacting with D2 (see Discussion).
Interdomain linkers of RAP are flexible and disordered
To determine whether the linkers between the domains in full-length RAP have a fixed conformation, we employed heteronuclear 15N-{1H} NOE experiments and measured the 15N-{1H} NOE of individual domains, tandem domains, and full-length RAP. The results (Fig. 4), reveal (1) that the domains, the tandem domains, and the full-length protein share similar 15N-{1H} NOE patterns, implying that the structural integrity of the domains is maintained, in agreement with the chemical-shift mapping data; and (2) that the linkers connecting the domains are flexible and disordered (Fig. 6). Since no interdomain interaction was detected and the linkers between the domains are flexible and disordered, we conclude that there is no fixed relative orientation among the domains. The flexibility of the linkers allows the three RAP domains to adopt a broad range of possible orientations relative to each other.
Figure 6.

Comparison of 15N-{1H} NOEs of the individual domains (A) and the tandem domains D12 (B) and D23 (C), and full-length RAP (D). At the top, the regular secondary structure elements are indicated schematically. The NOE values are similar for both the structured regions as well as linker regions among different constructs. The NOE values of the linker regions are <0.5, characteristic of flexible structures.
Domain boundary
Since several domain boundaries of RAP have been proposed (Bu et al. 1995; Rall et al. 1998; Medved et al. 1999), we are interested in determining the domain boundary based on the structure of the full-length RAP. Based on the three-dimensional structure of RAP, together with previous boundary proposals and the sequence alignment among vertebrates (Supplemental material Fig. S6), we suggest that the boundaries of individual domains are as follows: D1, residues 1–106; D2, residues 107–213; and D3, residues 214–323. The linkers between the adjacent domains fall within the regions where the sequences are less conserved (Supplemental material Fig. S6): D1 ends at G106 (the beginning of the gap in the region with no conserved residues), while D2 may end anywhere between residues S213 and A221, where no residue is conserved among the species. In addition, the long, flexible loop between α5 and α6 in D2 is accessible to proteases (Supplemental material Fig. S6), a condition that is in agreement with a four-domain model of RAP that was previously proposed on the basis of proteolysis studies (Medved et al. 1999). In addition, the boundaries of D3 are perfectly aligned with the boundaries of its encoded three exons, i.e., exons 6, 7, and 8 (Supplemental material Fig. S6).
Overall structure of RAP based on SANS data
Since RAP consists of three independent domains joined by two flexible linkers, the protein is expected to have an ensemble of conformers in solution. SANS data contains information about the overall shape of proteins in solution (Glinka et al. 1998) and, therefore, can be useful in restraining the structures. A similar approach using small-angle X-ray scattering (SAXS) data to directly refine NMR structures has been reported (Grishaev et al. 2005). We have implemented a protocol to refine the three domains of RAP using both SANS and NMR data. To assess the agreement of the calculated structures with the SANS data, χ2 values were calculated for the top 20 structures using the expressions Iobsj and Icalcj:
 |
In this calculation, NI represents the total number of data points; Iobsjand Icalcj are, respectively, the observed and calculated scattering intensities at q = qj; and σI(qj) is the associated experimental error. The resulting 20 values took the value χ2 = 7.83 ± 0.82, to be compared with a value of 34.93 for the radius of gyration (R g)-refined starting structure.
The experimental and the back-calculated SANS curves based on the R g-refined and the SANS-refined structures are shown in Figure 7. Because of the restriction of R g during the SA calculation, the three domains are evenly, but artificially, distributed around the center of mass in order to satisfy the dimensionality imposed by the R g without considering the overall shape of the molecule. Consequently, the back-calculated SANS curves based on the R g-refined structure do not fit the experimental SANS data, except in the initial part of the curve (Guinier region). In comparison, the back-calculated curves based on individual SANS-refined structures are tightly bunched and match the experimental data much more closely than those calculated from the R g-refined structure, suggesting an improved agreement between the overall shape of the SANS-refined structures and that of the protein in solution. Nevertheless, the curves of the SANS-refined structures deviate from the observed curve for q values larger than ∼0.12 Å−1, suggesting that the experimental SANS curve does not agree with any single structure, and is most likely a reflection of an ensemble of conformers that may include more extended structures co-existing in solution. We are currently developing a protocol that allows simultaneous calculation of multiple conformers whose average SANS is subject to restraint of the experimental SANS and the NMR data in a simulated annealing. Figure 8 shows the backbones of the 20 lowest-energy SANS-refined structures (Fig. 8A) and the ribbon diagrams of the R g-refined (Fig. 8D) and two representative SANS-refined structures (Fig. 8B,C).
Figure 7.

Comparison of the experimental and back-calculated SANS curves: green with error bars, experimental data from RAP at 5 mg/mL concentration in D2O buffer; red, Rg-refined structure with Rg = 35 Å; black, the 20 lowest-energy SANS-refined structures.
Figure 8.
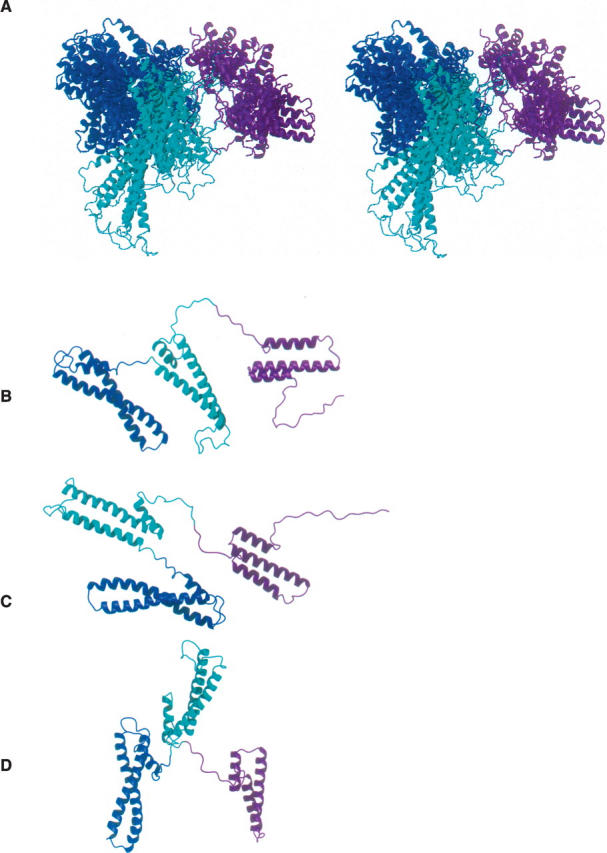
Ribbon diagrams of the 10 lowest-energy SANS-refined in stereoview (A); two examples of the SANS-refined structures (B, C); and ribbon drawing of the Rg-refined (D). Color code: magenta, cyan, and blue for D1, D2, and D3, respectively. The detailed protocol used for the calculation is provided in the Supplemental material. The average χ2 values between the experimental and calculated results based on the SANS-refined and R g-refined structures are ∼8 and 37, respectively. It is noteworthy that the length of RAP can reach >150 Å when the linkers are fully extended. Note that the main structural differences shown in C and D are the relative positions of D2 and D3. The spatial resolution of the experimental SANS curve is ∼40 Å at q ≈ 0.15 Å.
Even though the helix bundle or repetitive domain architecture is common in protein structures, the structure of RAP is unique in that it is organized with the three three-helical bundles as its repetitive domains. Our structure of the full-length protein agrees with the predicted “triplicated repeats” on the basis of a sequence analysis of the RAP amino acid sequence (Bu et al. 1995). The structural organization of independent repetitive three-helical bundles such as RAP cannot be found using the search program DALI (Holm and Sander 1993). The elongated structure and repetitive nature of RAP appear to be designed for interaction with repetitive binding substrates, such as the LRP receptors, and may allow for binding at multiple sites (Obermoeller et al. 1997; Rudenko et al. 2002). It has been suggested that RAP may exist in an extended conformation (Lazic et al. 2003). Our structure predicts that RAP would be over 150 Å long if the linkers were in a fully extended conformation.
Discussion
RAP is a versatile ER resident protein that antagonizes the bindings of all known ligands to members of the LDL receptor protein family. The structure of individual domains and the overall architecture of the full-length molecule provide insights into RAP's functions. The individual domains and domain combinations of RAP are known to have their own specificities toward LRP and other molecules, such as heparin (Munson and Rodbard 1980; Bu et al. 1995), and they exhibit differential functions. RAP contains two independent LRP-binding sites, one located within D1D2 and the other in D3 (Migliorini et al. 2003). The tandem domains D1D2 bind to the second and the fourth ligand-binding clusters present on LRP, whereas D3 binds to all three ligand-binding clusters on LRP. Furthermore, RAP has regions that interact weakly with heparin, one located in D2 and two located in D3 (Melman et al. 2001).
Fisher and colleagues (Fisher et al. 2006) have recently reported a co-crystal structure of a complex between a two-module region of the ligand-binding domain of the LDL receptor and D3 of RAP. The structure revealed the nature of the interaction between the RAP D3 domain and the ligand-binding repeats of the LDL receptor: Two protruding lysines in the second helix, K256 and K270, dock separately to two almost identical calcium-coordinated acidic pockets on the two ligand-binding repeats. This result is in agreement with previous biochemical studies, suggesting that the basic residues at the two sites in RAP are responsible for the recognition of this domain of RAP by LRP (Migliorini et al. 2003). It should be highlighted that the binding of D3 to two ligand-binding repeats from LRP occurs with a relatively weak affinity (Lazic et al. 2006). This finding suggests that D3 interacts with three tandem repeats of LRP for optimal binding, a notion that is consistent with the findings of Vash et al. (1998), who found that three ligand-binding repeats in LRP were optimal for RAP binding. This implies that a third lysine residue in D3 is also critical for the interaction of D3 with LRP.
The mechanism by which the tandem domain D12 binds to LRP is likely to be different from that involving D3, as neither D1 nor D2 have two protruding binding handles that fit into the two acidic binding pockets in the tandem ligand-binding repeats. Thus, D1 and D2 bind to LRP with a weak affinity (Fig. 2), which is distinct from D3 which binds to LRP with high affinity. Together, however, the tandem domain D12 possesses a high-affinity binding to LRP (Obermoeller et al. 1997; Migliorini et al. 2003).
These data suggest an avidity effect, in which lysine residues from each domain contribute to the binding very likely by interacting with individual ligand-binding repeats on LRP to produce high-affinity binding. Our study identified basic residues in D1 (K77/R80) and D2 (K191/R195) that appear to constitute a portion of the LRP-binding site, as mutations of these basic residues to alanines generated a D1D2 molecule with a nearly 40-fold decrease in affinity for LRP (Fig. 3). This result implies that simultaneous binding of both domains to LRP is required for the high affinity to LRP. Another study (Jensen et al. 2006) demonstrated that the mutation of Lys60 to alanine reduced the affinity of D1 for two ligand-binding repeats of LRP (CR56), revealing that this lysine also contributes to the binding interaction.
The flexibility in linkers connecting the three domains of RAP appears to be encoded for maximum functional versatility of RAP. D1 and D2 act together as an antagonist to block α2-macroglobulin interactions with LRP, and the flexible, long linker between D1 and D2 may allow maximum freedom for both domains to adopt the conformations necessary for simultaneous binding to LRP. Furthermore, the flexible linker between D2 and D3 adds a minimum conformation constraint to D3, which itself appears to embody many functions of RAP. RAP D3 acts as a chaperone and an escort, both of which are important for the maturation of LRP (Obermoeller et al. 1997). The escorting activity of D3 is attributed to the histidine switch, which responds to the pH change from the ER to the Golgi (Lee et al. 2006a); D3 is able to function independently, without the presence of the other two domains.
In summary, the solution structure of RAP has been deduced by a divide-and-conquer strategy, in which the structure of each domain was individually solved by NMR measurements. A novel protocol using SANS measurements was then employed to refine the overall structure of the molecule. This analysis revealed that RAP contains three independent domains, each constructed of a three-helical bundle, which are linked by highly flexible linkers. The ability of RAP to interact with high affinity with the repetitive structures on LDL receptor family members is very likely the result of the flexibility of the linker regions, which enables multiple conformational orientations of the individual domains of this molecular chaperone.
Materials and Methods
Sample preparation
The wild-type RAP and its domain constructs were cloned and over-expressed as described earlier (Medved et al. 1999), replacing the GST fusion protein with a histidine tag. The proteins were purified using a 20-mL Cobalt column (TALON Superflow, BD Biosciences Clontech), followed by a semipreparative C-18 reverse-phase column (Vydac). The elutions containing the proteins were lyophilized and then dialyzed with NMR sample buffer (75 mM NaPi, 50 mM NaCl, pH 7.25) using 3-k MWCO Millipore spin filters. The resulting samples were used for the structure determination. Isotope labeling of the proteins was described previously (Wang et al. 1996). The constructs of D2 and D3 have a sequence overlap (residues 206–216).
Residual dipolar coupling
Pf1 was used as an alignment medium. The protein did not interact with the alignment medium as judged by comparing [15N,1H]-HSQC spectra collected with and without the medium. In preparation of Pf1-anisotropic D2 solution, a Pf1 stock solution of 50 mg/mL was filtered extensively with the buffer (50 mM NaCl, 75 mM NaPi, pH 7.25) using a 100-k MWCO spin filter. The volume of the protein-Pf1 solution was adjusted to give a splitting ∼13 Hz of the deuterium signal and a concentration of ∼13 mg Pf1/mL measured with a UV spectrophotometer at 270 nm (Hansen et al. 1998). 1 D NH, 1 D CαC′, and 1 D CαHα were taken as the difference in J splittings measured in isotropic and anisotropic samples from 2D 15N HSQC-IPAP, 3D HNCO–JCOCA, and 3D HN(CO)CA–JCAHA, respectively (Bax et al. 2001). In processing the data, indirectly detected dimensions were predicted linearly. We used a combination of simulated annealing refinement and a grid search (Clore et al. 1998a), as well as the histogram (powder pattern) of 1 D NH and normalized 1 D CαC′ and 1 D CαHα (Clore and Kuszewski 1998b), to extract the axial and rhombic components, Da and R, respectively, of the alignment tensor.
Structure determination
3D 13C-, 3D 15N-, 3D 13C/15N-, and 4D 13C/15N-edited NOESY spectra with mixing times of 100 ms were used to obtain distance restraints. In addition, a 3D HNHA spectrum was recorded to extract J HNHA couplings. Distance calibration of the interproton distance restraints was performed using a previously reported protocol (Garrett et al. 1997; Bewley and Clore 2000). Torsion-angle restraints were derived using a combination of CSI, quantitative analysis of J HNHA couplings (Vuister and Bax 1994), and the TALOS program (Cornilescu et al. 1999). Two restraints for each hydrogen bond (NH–O = 1.5–2.8 Å and N–O = 2.4–3.5 Å) were derived from NH exchange experiments, backbone NOE patterns, and backbone 13Cα/13Cβ chemical shifts. The hydrogen-bond restraints were applied in the later stage of the structure calculation. The backbone 13Cα/13Cβ chemical shifts were also used directly in the structure calculation. Tight turns clearly identified by NOE patterns and J coupling constants were restrained to their standard values with a ±30° error range.
We calculated the structure of D2 using simulated annealing in torsion-angle space (Stein et al. 1997; Schwieters and Clore 2001; Schwieters et al. 2003), starting from an extended strand, followed by simulated annealing in Cartesian space using XPLOR-NIH (Schwieters et al. 2003), which contains pseudopotentials for residual dipolar couplings, a conformational database, and chemical-shift refinement module (Clore and Kuszewski 2002). Molecular models were generated with MOLMOL (Koradi et al. 1996). The solution structure of D2 has been deposited in the PDB bank with accession code 2GPG.
RAP–LRP binding assays
Solid-phase competition experiments were performed as described using 125I-labeled proteins (Migliorini et al. 2003). Nonspecific binding was measured by including a 50-fold excess of unlabeled D1D2 or mutants. Data were analyzed using LIGAND (Munson and Rodbard 1980), and the fitted curves are plotted along with the experimental data points in Figures 2, 3, and Supplemental material Figure S2. We have performed a binding assay measuring the binding of RAP to LRP at the NMR solution condition (75 mM phosphate, 50 mM NaCl, pH 7.25) and found no difference between these conditions and the conditions detailed elsewhere (Migliorini et al. 2003). The K D value we measured under these conditions was 1.9 nM.
Chemical-shift mapping
The amide group assignments for domain constructs have been reported elsewhere (Wu et al. 2003; Lee et al. 2006b; Walsh et al. 2006). Partial amide group assignments of the tandem domains D1D2 and D2D3 and full-length RAP were made based on the peak position matching in (1) 2D TROSY 15N-HSQC and (2) 3D TROSY HNCA spectra of the individual domain, tandem domain, and full-length RAP constructs. To illustrate this, we show two figures containing the matching planes of 3D TROSY HNCA spectra of full-length RAP and the D2D3 tandem domain at ω1 (15N) = 120.5 ppm, where there are extensive overlaps in the 2D TROSY HSQC (Figs. 4, 5).
Small-angle neutron scattering (SANS) measurements
The SANS of RAP was measured in NMR sample buffer and performed on the 30-m SANS instruments at the NIST Center for Neutron Research in Gaithersburg, MD (Glinka et al. 1998). Samples were measured in 1-mm path-length quartz cuvettes at 20°C at nominal concentrations of 5 and 3 mg/mL in H2O buffer and at 5, 3, and 1 mg/mL in D2O buffer. The neutron wavelength, λ, was 5 Å, with a wavelength spread, Δλ/λ, of 0.15. Scattered neutrons were detected with a 64 cm × 64 cm, 2D position-sensitive detector with 128 × 128 pixels at a resolution of 0.5 cm/pixel. Raw counts were normalized to a common monitor count and corrected for empty cell counts, ambient room background counts, and nonuniform detector response. Data were placed on an absolute scale by normalizing the scattered intensity to the incident beam flux. Finally, the data were radially averaged to produce scattered intensity, I(q), vs. q curves, where q is the momentum transfer, defined as q = 4π sin(θ)/λ and 2θ is the scattering angle. Sample-to-detector distances of 6.0 and 1.5 m were used in order to cover the range 0.01 Å−1 ≤ q ≤ 0.35 Å−1. The scattered intensities from the samples were then further corrected for buffer scattering and incoherent scattering from hydrogen in the samples.
The R g was obtained at both sample concentrations by using the Guinier approximation, I(q) ≈ I(0) exp(−q 2 Rg 2/3), where I(0) is the scattered intensity at q = 0 (Guinier and Fournet 1955). A plot of ln(I) vs. q 2 should contain a linear region with slope Rg 2/3 and intercept ln[I(0)]. The range of validity for the Guinier analysis depends on the shape of the particle. However, Guinier fits are generally made in a q range centered about the relation, qRg ≈ 1.0. Guinier fits to the RAP data at each concentration were made in several different q ranges between q = 0.012 Å−1 and q = 0.044 Å−1. The results were averaged in order to obtain a single value for Rg in each case. This resulted in Rg values of 34 ± 1 Å for the 5 and 3 mg/mL samples in H2O buffer and 36.0 ± 0.05, 35.5 ± 0.5, and 36 ± 1 Å for the 5, 3, and 1 mg/mL samples in D2O buffer, respectively. There is evidence of slightly larger sizes in the samples in D2O buffer, with the effect mainly on the portion of the SANS curve below q = 0.02 Å−1. Thus, the Rg values for the samples in D2O buffer are slightly larger than those for the samples in H2O buffer. It is unclear whether these differences indicate some aggregation of the samples in D2O buffer or whether they indicate a difference in the positions of the flexible linkers in these samples. The average Rg value for all of the samples is 35 ± 1 Å, which is the value that was used in the Rg-refined NMR structure.
Simulated annealing refinement using NMR and SANS data
Grishaev and colleagues were the first to utilize SAXS data to restrain structures using the simulated annealing protocol (Grishaev et al. 2005). While the SANS and SAXS methods differ in their equipment and scattering sources and each method has its own advantages, the interpretation of the scattering intensity vs. the transfer momentum is virtually the same. We implemented the simulated annealing restrained with the SANS and NMR data in the XPLOR-NIH package (Schwieters et al. 2003). Refinement against SANS data was performed using the surface grid approach, as described in (Schwieters and Clore 2007). Two stages of atom globbing were used. For final plotting and calculation, only hydrogen atoms were globbed onto their neighboring heavy atom. During refinement, more extensive globbing of heavy atoms was used (Grishaev et al. 2005). In this work, a surface grid size of 120 points was utilized. Excluded solvent effects were included in the SANS calculations, and exchangeable protons were deuterated at the 90% level by scaling their scattering lengths. Atomic neutron scattering lengths were taken from references (Jacob 1976; Cantor and Schimmel 1980).
Only the D2O SANS data at 5 mg/mL concentration were used for refinement. These data were preprocessed with the GNOM software package (Semenyuk and Svergun 1991), with the assumption of no smearing, an r max value of 120 Å, and P(r min) = P(r max) = 0. The resulting scattering curve I(q) and the associated experimental deviation σI(q) were subsampled at 20 values of q using cubic spline interpolation. The resulting curve deviated from the experimental curve at the smallest five values of the experimental I(q); the experimental curve takes larger values of I(q) than the smoothed GNOM-derived curve. The GNOM-determined R g was 38.0 Å with I 0 = 0.187, while a Guinier fit yielded R g = 39.0 Å and I 0 = 0.193. This Guinier R g value represents a single fit to the data and is thus different than the R g value quoted above, which is an average value based on several different fits to the data in the Guinier region. The GNOM-derived R g value is dependent on the value chosen for r max. For instance, if r max = 110 Å, then GNOM-determined R g is 36.5 Å, which agrees well with the Guinier value quoted above for the same sample.
A harmonic energy potential was used for refinement against solution-phase scattering intensity
 |
where ωscat is an overall scale factor on the energy term; ωj is a per-q weighting; Iobs(qj) is the observed scattering intensity; and the sum is over the 20 values of qj . The value of ωj was set to σ−2 I (qj) for all j except for those values of qj smaller than the smallest observed value, where it was set to zero. I(qj) and Iobs(qj) were normalized to their q = 0 values in this calculation.
Multiple energy terms were used in refinement, in addition to the SANS term. Distance restraints included 2971 NOE restraints and 704 hydrogen-bond restraints; 1056 dihedral restraints derived from chemical-shift values were also employed. The torsion-angle database potential of mean force (TADB) was used (Kuszewski et al. 1997), along with the usual bond, angle, improper, and quartic repulsive nonbonded terms.
Two hundred ensemble structures were calculated using a simulated annealing protocol in which dynamics and minimization were performed in torsion-angle space via the internal variable module (IVM) of XPLOR-NIH (Schwieters and Clore 2001), employing its variable step-size feature. The structure-determination protocol consisted of 20 ps of dynamics at 3000°K followed by annealing from 3000°K to 25°K at 12.5°K increments, with 0.4 ps of dynamics run at each temperature. Final gradient minimization was performed in torsion-angle space, followed by all-degrees-of-freedom minimization. The 10 lowest-energy (omitting TADB and nonbonded terms) structures were used for analysis. Atomic masses were set to 100 amu.
The structure refined with the Rg restraint was used as a starting structure, as this structure was well-defined in regions containing dense quantities of NOE and other restraints. Force constants on the various energy terms were either scaled geometrically during refinement or held constant. The values used in refinement are listed in Table 2. Of the 200 computed structures, 20 that had the best fit to the experimental SANS curve were chosen. The coordinates of ensemble of the full-length RAP calculated with the Rg or SANS restraints have been deposited in the PDB bank with accession codes 3P01 and 3P03, respectively.
Table 2.
Scaling factors and force constants used in refinement

Disclaimer
The content of this publication does not necessarily reflect the views or policies of the Department of Health and Human Services, nor does mention of trade names, commercial products, or organizations imply endorsement by the U.S. Government. Reference to commercial sources and products used in this study does not constitute endorsement by the National Institute of Standards and Technology (NIST), nor should it be inferred that the products mentioned are necessarily the best available for the purpose used. This study utilized the high-performance computational capabilities of the Biowulf PC/Linux cluster at the National Institutes of Health (http://biowulf.nih.gov).
Acknowledgments
This research was supported in part by the NIH Intramural Research Program of the National Cancer Institute (Y-X.W.) and CIT (C.D.S.), and by HL50784 (D.K.S.) and HL54710 (D.K.S.). This publication has been funded in part with Federal funds from the National Cancer Institute, National Institutes of Health, under contracts N01-CO-12400 and N01-CO56000. We also thank Drs. R. Andrew Byrd and Marius Clore for insightful discussions and Nancy Parrish for editing.
Footnotes
Supplemental material: see www.proteinscience.org
Reprint requests to: Y.-X. Wang, Protein–Nucleic Acid Interaction Section, Structural Biophysics Laboratory, National Cancer Institute at Frederick, National Institutes of Health, Frederick, MD 21702, USA; e-mail: wangyu@ncifcrf.gov; fax: (301) 846-6231; or D.K. Strickland, Center for Vascular and Inflammatory Disease and the Departments of Surgery and Physiology, University of Maryland School of Medicine, Baltimore, MD 21201, USA; e-mail: dstrickland@som.umaryland.edu; fax: (410) 706-8121.
Article and publication are at http://www.proteinscience.org/cgi/doi/10.1110/ps.072865407.
References
- Bax A., Kontaxis, G., and Tjandra, N. 2001. Dipolar couplings in macromolecular structure determination. In Nuclear magnetic resonance of biological macromolecules (eds. T.L. James, V. Dotsch, and U. Schmitz), pp. 127–174. Academic Press, San Diego, CA. Part B. [DOI] [PubMed]
- Bewley C.A. and Clore, G.M. 2000. Determination of the relative orientation of the two halves of the domain-swapped dimer of cyanovirin-N in solution using dipolar couplings and rigid body minimization. J. Am. Chem. Soc. 122: 6009–6016. [Google Scholar]
- Boucher P., Gotthardt, M., Li, W.P., Anderson, R.G.W., and Herz, J. 2003. LRP: Role in vascular wall integrity and protection from atherosclerosis. Science 300: 323–329. [DOI] [PubMed] [Google Scholar]
- Bu G., Geuze, H.J., Strous, G.J., and Schwartz, A.L. 1995. 39 kDa receptor-associated protein is an ER resident protein and molecular chaperone for LDL receptor-related protein. EMBO J. 14: 2269–2280. [DOI] [PMC free article] [PubMed] [Google Scholar]
- Cantor C.R. and Schimmel, P.R. 1980. Biophysical chemistry, Part III: The behavior of biological macromolecules. W.H. Freeman and Company, New York.
- Clore G.M. and Kuszewski, J. 2002. C(1) rotamer populations and angles of mobile surface side chains are accurately predicted by a torsion angle database potential of mean force. J. Am. Chem. Soc. 124: 2866–2867. [DOI] [PubMed] [Google Scholar]
- Clore G.M., Gronenborn, A.M., and Bar, A. 1998a. A robust method for determining the magnitude of the fully asymmetric alignment tensor of oriented macromolecules in the absence of structural information. J. Magn. Reson. 133: 216–221. [DOI] [PubMed] [Google Scholar]
- Clore G.M., Gronenborn, A.M., and Tjandra, N. 1998b. Direct structure refinement against residual dipolar couplings in the presence of rhombicity of unknown magnitude. J. Magn. Reson. 131: 159–162. [DOI] [PubMed] [Google Scholar]
- Cornilescu G., Delaglio, F., and Bax, A. 1999. Protein backbone angle restraints from searching a database for chemical shift and sequence homology. J. Biomol. NMR 13: 289–302. [DOI] [PubMed] [Google Scholar]
- Fisher C., Beglova, N., and Blacklow, S.C. 2006. Structure of an LDLR-RAP complex reveals a general mode for ligand recognition by lipoprotein receptors. Mol. Cell 22: 277–283. [DOI] [PubMed] [Google Scholar]
- Gardai S.J., McPhillips, K.A., Frasch, S.C., Janssen, W.J., Starefeldt, A., Murphy-Ullrich, J.E., Bratton, D.L., Oldenborg, P.A., Michalak, M., and Henson, P.M. 2005. Cell-surface calreticulin initiates clearance of viable or apoptotic cells through trans-activation of LRP on the phagocyte. Cell 123: 321–334. [DOI] [PubMed] [Google Scholar]
- Garrett D.S., Seok, Y.J., Liao, D.I., Peterkofsky, A., Gronenborn, A.M., and Clore, G.M. 1997. Solution structure of the 30 kDa N-terminal domain of enzyme I of the Escherichia coli phosphoenolpyruvate: Sugar phosphotransferase system by multidimensional NMR. Biochemistry 36: 2517–2530. [DOI] [PubMed] [Google Scholar]
- Glinka C.J., Barker, J.G., Hammouda, B., Krueger, S., Moyer, J.J., and Orts, W.J. 1998. The 30 m small-angle neutron scattering instruments at the National Institute of Standards and Technology. J. Appl. Crystallogr. 31: 430–445. [Google Scholar]
- Grishaev A., Wu, J., Trewhella, J., and Bax, A. 2005. Refinement of multidomain protein structures by combination of solution small-angle X-ray scattering and NMR data. J. Am. Chem. Soc. 127: 16621–16628. [DOI] [PubMed] [Google Scholar]
- Guinier A. and Fournet, G. 1955. Small angle scattering of X-rays. Wiley, New York.
- Hansen M.R., Mueller, L., and Pardi, A. 1998. Tunable alignment of macromolecules by filamentous phage yields dipolar coupling interactions. Nat. Struct. Biol. 5: 1065–1074. [DOI] [PubMed] [Google Scholar]
- Herz J. and Strickland, D.K. 2001. LRP: A multifunctional scavenger and signaling receptor. J. Clin. Invest. 108: 779–784. [DOI] [PMC free article] [PubMed] [Google Scholar]
- Holm L. and Sander, C. 1993. Protein-structure comparison by alignment of distance matrices. J. Mol. Biol. 233: 123–138. [DOI] [PubMed] [Google Scholar]
- Hsieh J.C., Lee, L., Zhang, L., Wefer, S., Brown, K., DeRossi, C., Wines, M.E., Rosenquist, T., and Holdener, B.C. 2003. Mesd encodes an LRP5/6 chaperone essential for specification of mouse embryonic polarity. Cell 112: 355–367. [DOI] [PubMed] [Google Scholar]
- Jacob B. 1976. The study of biological structures by neutron scattering from solution. Rep. Prog. Phys. 39: 911–953. [Google Scholar]
- Jensen G.A., Andersen, O.M., Bonvin, A.M., Bjerrum-Bohr, I., Etzerodt, M., Thogersen, H.C., O'Shea, C., Poulsen, F.M., and Kragelund, B.B. 2006. Binding site structure of one LRP–RAP complex: Implications for a common ligand–receptor binding motif. J. Mol. Biol. 362: 700–716. [DOI] [PubMed] [Google Scholar]
- Katoh E., Yamazaki, T., Kiso, Y., Wingfield, P.T., Stahl, S.J., Kaufman, J.D., and Torchia, D.A. 1999. Determination of the rate of monomer interchange in a ligand- bound homodimeric protein from NOESY cross peaks: Application to the HIV protease/KNI-529 complex. J. Am. Chem. Soc. 121: 2607–2608. [Google Scholar]
- Koradi R., Billeter, M., and Wuthrich, K. 1996. MOLMOL: A program for display and analysis of macromolecular structures. J. Mol. Graph. 14: 29–32. [DOI] [PubMed] [Google Scholar]
- Krieger M. and Herz, J. 1994. Structures and functions of multiligand lipoprotein receptors: Macrophage scavenger receptors and LDL receptor-related protein (LRP). Annu. Rev. Biochem. 63: 601–637. [DOI] [PubMed] [Google Scholar]
- Kuszewski J., Gronenborn, A.M., and Clore, G.M. 1997. Improvements and extensions in the conformational database potential for the refinement of NMR and X-ray structures of proteins and nucleic acids. J. Magn. Reson. 125: 171–177. [DOI] [PubMed] [Google Scholar]
- Laskowski R.A., MacArthur, M.W., Moss, D.S., and Thornton, J.M. 1993. PROCHECK: A program to check the stereochemical quality of protein structures. J. Appl. Crystallogr. 26: 283–291. [Google Scholar]
- Lazic A., Dolmer, K., Strickland, D.K., and Gettins, P.G. 2003. Structural organization of the receptor-associated protein. Biochemistry 42: 14913–14920. [DOI] [PubMed] [Google Scholar]
- Lazic A., Dolmer, K., Strickland, D.K., and Gettins, P.G. 2006. Dissection of RAP-LRP interactions: Binding of RAP and RAP fragments to complement-like repeats 7 and 8 from ligand binding cluster II of LRP. Arch. Biochem. Biophys. 450: 167–175. [DOI] [PubMed] [Google Scholar]
- Lee D., Walsh, J.D., Mikhailenko, I., Yu, P., Migliorini, M., Wu, Y., Krueger, S., Curtis, J.E., Harris, B., Lockett, S., et al. 2006a. RAP uses a histidine switch to regulate its interaction with LRP in the ER and Golgi. Mol. Cell 22: 423–430. [DOI] [PubMed] [Google Scholar]
- Lee D., Walsh, J.D., Yu, P., Migliorini, M., Wu, Y., Strickland, D.K., Wang, Y.X., Walsh, J.D., Lee, D., Yu, P., et al. 2006b. NMR assignment of domain 3 of the receptor-associated protein (RAP) NMR assignment of domain 2 of the receptor-associated protein. J. Biomol. NMR 36: (Suppl 5): 56. doi: doi: 10.1007/s10858-006-9036-7. [DOI] [PubMed] [Google Scholar]
- Medved L.V., Migliorini, M., Mikhailenko, I., Barrientos, L.G., Llinas, M., and Strickland, D.K. 1999. Domain organization of the 39-kDa receptor-associated protein. J. Biol. Chem. 274: 717–727. [DOI] [PubMed] [Google Scholar]
- Melman L., Cao, Z.F., Rennke, S., Marzolo, M.P., Wardell, M.R., and Bu, G.J. 2001. High affinity binding of receptor-associated protein to heparin and low density lipoprotein receptor-related protein requires similar basic amino acid sequence motifs. J. Biol. Chem. 276: 29338–29346. [DOI] [PubMed] [Google Scholar]
- Migliorini M.M., Behre, E.H., Brew, S., Ingham, K.C., and Strickland, D.K. 2003. Allosteric modulation of ligand binding to low density lipoprotein receptor-related protein by the receptor-associated protein requires critical lysine residues within its carboxyl-terminal domain. J. Biol. Chem. 278: 17986–17992. [DOI] [PubMed] [Google Scholar]
- Munson P.J. and Rodbard, D. 1980. LIGAND: A versatile computerized approach for characterization of ligand-binding systems. Anal. Biochem. 107: 220–239. [DOI] [PubMed] [Google Scholar]
- Nielsen P.R., Ellgaard, L., Etzerodt, M., Thogersen, H.C., and Poulsen, F.M. 1997. The solution structure of the N-terminal domain of α2-macroglobulin receptor-associated protein. Proc. Natl. Acad. Sci. 94: 7521–7525. [DOI] [PMC free article] [PubMed] [Google Scholar]
- Obermoeller L.M., Warshawsky, I., Wardell, M.R., and Bu, G. 1997. Differential functions of triplicated repeats suggest two independent roles for the receptor-associated protein as a molecular chaperone. J. Biol. Chem. 272: 10761–10768. [DOI] [PubMed] [Google Scholar]
- Pellecchia M., Sebbel, P., Hermanns, U., Wuthrich, K., and Glockshuber, R. 1999. Pilus chaperone FimC-adhesin FimH interactions mapped by TROSY-NMR. Nat. Struct. Biol. 6: 336–339. [DOI] [PubMed] [Google Scholar]
- Rall S.C., Ye, P., Bu, G.J., and Wardell, M.R. 1998. The domain structure of human receptor-associated protein—Protease sensitivity and guanidine HCl denaturation. J. Biol. Chem. 273: 24152–24157. [DOI] [PubMed] [Google Scholar]
- Rudenko G., Henry, L., Henderson, K., Ichtchenko, K., Brown, M.S., Goldstein, J.L., and Deisenhofer, J. 2002. Structure of the LDL receptor extracellular domain at endosomal pH. Science 298: 2353–2358. [DOI] [PubMed] [Google Scholar]
- Sarti M., Farquhar, M.G., and Orlando, R.A. 2000. The receptor-associated protein (RAP) interacts with several resident proteins of the endoplasmic reticulum including a glycoprotein related to actin. Exp. Cell Res. 260: 199–207. [DOI] [PubMed] [Google Scholar]
- Schwieters C.D. and Clore, G.M. 2001. Internal coordinates for molecular dynamics and minimization in structure determination and refinement. J. Magn. Reson. 152: 288–302. [DOI] [PubMed] [Google Scholar]
- Schwieters C.D. and Clore, G.M. 2007. A physical picture of atomic motions within the Dickerson DNA dodecamer in solution derived from joint ensemble refinement against NMR and large-angle X-ray scattering data. Biochemistry 46: 1152–1166. [DOI] [PubMed] [Google Scholar]
- Schwieters C.D., Kuszewski, J., Tjandra, N., and Clore, G.M. 2003. The XPLOR-NIH NMR molecular structure determination package. J. Magn. Reson. 160: 66–74. [DOI] [PubMed] [Google Scholar]
- Semenyuk A.V. and Svergun, D.I. 1991. GNOM: A program package for small-angle scattering data processing. J. Appl. Crystallogr. 24: 537–540. [DOI] [PMC free article] [PubMed] [Google Scholar]
- Stein E.G., Rice, L.M., and Brunger, A.T. 1997. Torsion-angle molecular dynamics as a new efficient tool for NMR structure calculation. J. Magn. Reson. 124: 154–164. [DOI] [PubMed] [Google Scholar]
- Strickland D.K., Gonias, S.L., and Argraves, W.S. 2002. Diverse roles for the LDL receptor family. Trends Endocrinol. Metab. 13: 66–74. [DOI] [PubMed] [Google Scholar]
- Vash B., Phung, N., Zein, S., and DeCamp, D. 1998. Three complement-type repeats of the low-density lipoprotein receptor-related protein define a common binding site for RAP, PAI-1, and lactoferrin. Blood 92: 3277–3285. [PubMed] [Google Scholar]
- Vuister G.W. and Bax, A. 1994. Measurement of four-bond H(N)-Hα J couplings in staphylococcal nuclease. J. Biomol. NMR 4: 193–200. [DOI] [PubMed] [Google Scholar]
- Walsh J.D., Lee, D., Yu, P., Migliorini, M., Strickland, D.K., and Wang, Y.X. 2006. NMR assignment of domain 2 of the receptor-associated protein. J. Biomol. NMR 36: (Suppl 5): 54. doi: doi: 10.1007/s10858-006-9034-9. [DOI] [PubMed] [Google Scholar]
- Wang Y.X., Freedberg, D.I., Yamazaki, T., Wingfield, P.T., Stahl, S.J., Kaufman, J.D., Kiso, Y., and Torchia, D.A. 1996. Solution NMR evidence that the HIV-1 protease catalytic aspartyl groups have different ionization states in the complex formed with the asymmetric drug KNI-272. Biochemistry 35: 9945–9950. [DOI] [PubMed] [Google Scholar]
- Willnow T.E., Armstrong, S.A., Hammer, R.E., and Herz, J. 1995. Functional expression of low density lipoprotein receptor-related protein is controlled by receptor-associated protein in vivo. Proc. Natl. Acad. Sci. 92: 4537–4541. [DOI] [PMC free article] [PubMed] [Google Scholar]
- Willnow T.E., Rohlmann, A., Horton, J., Otani, H., Braun, J.R., Hammer, R.E., and Herz, J. 1996. RAP, a specialized chaperone, prevents ligand-induced ER retention and degradation of LDL receptor-related endocytic receptors. EMBO J. 15: 2632–2639. [PMC free article] [PubMed] [Google Scholar]
- Wishart D.S. and Nip, A.M. 1998. Protein chemical shift analysis: A practical guide. Biochem. Cell Biol. 76: 153–163. [DOI] [PubMed] [Google Scholar]
- Wishart D.S. and Sykes, B.D. 1994. Chemical shifts as a tool for structure determination. In Nuclear magnetic resonance (eds. T.L. James and N.J. Oppenheimer), pp. 363–392. Academic Press, San Diego, CA. Part C. [DOI] [PubMed]
- Wu Y., Migliorini, M., Yu, P., Strickland, D.K., and Wang, Y.X. 2003. 1H, 13C, and 15N resonance assignments of domain 1 of receptor associated protein. J. Biomol. NMR 26: 187–188. [DOI] [PubMed] [Google Scholar]
- Wu Y., Migliorini, M., Walsh, J., Yu, P., Strickland, D.K., and Wang, Y.X. 2004. NMR structural studies of domain 1 of receptor-associated protein. J. Biomol. NMR 29: 271–279. [DOI] [PubMed] [Google Scholar]
- Yepes M., Sandkvist, M., Moore, E.G., Bugge, T.H., Strickland, D.K., and Lawrence, D.A. 2003. Tissue-type plasminogen activator induces opening of the blood-brain barrier via the LDL receptor-related protein. J. Clin. Invest. 112: 1533–1540. [DOI] [PMC free article] [PubMed] [Google Scholar]