Abstract
Analysis of RNA that can be labeled with GTP indicates the existence of group I introns in genes of at least three transcriptional classes in the genome of Staphylococcus aureus bacteriophage Twort. A single ORF of 142 amino acids (Orf142) is interrupted by three self-splicing group I introns, providing the first example of a phage gene with multiple intron insertions. Twort Orf142 is encoded in a message that is abundant 15–20 min after infection and is highly similar to a late gene product (Orf8) of the morphologically related Listeria phage A511. The introns in orf142 are spliced in vivo and contain all the conserved features of primary sequence and secondary structure of group I introns in subgroup IA2, which includes the introns in Escherichia coli phage T4 and the Bacillus phages β22 and SPO1. Introns I2 and I3 in orf142 are highly similar, and their intron insertion sites are closely spaced. The presence of transcripts with a skipped exon between these introns indicates that they may fold into a single active ribozyme resulting in alternative splicing. Alternatively, the cleaved 5′ exon preceding I2 may undergo trans splicing to the 3′ exon that follows I3. Regardless of the detailed mechanism, these results demonstrate a new means whereby a single gene can give rise to multiple messenger RNAs.
Group I introns interrupt tRNA, rRNA, and protein-coding genes. Most group I introns have been found in mitochondrial DNA, but they are also present in chloroplasts and eukaryotic viruses, in nuclear rRNA genes of various protists and other lower eukaryotes, and in eubacteria and their phages (1, 2). Most of the previously described group I introns in bacteriophages are inserted in genes coding for proteins involved in DNA synthesis. Introns in E. coli phage T4 are present in nrdB (3, 4) and nrdD/sunY (5), which code for ribonucleotide reductases and td, encoding thymidylate synthase (6). In the Bacillus phage β22, the thymidylate synthase (thy) gene is also interrupted by a group I intron that is highly similar to the T4 td intron (7), whereas the introns of the closely related Bacillus phages SPO1, SP82, and φ are inserted in the coding regions of the DNA polymerase gene (8). Recently group I introns were also found in genes that are expressed late during infection, the terminase (terL) gene of Lactobacillus phage LL-H (9) and orf40 of Lactococcus phage r1t (10).
Group I introns share a common secondary structure and conserved sequence elements that form the catalytic core (11). The splicing pathway involves two consecutive transesterifications. The first reaction is initiated by a nucleophilic attack by the 3′ OH of exogenous guanosine at the 5′ splice site, resulting in a covalent linkage of the noncoded guanosine to the 5′ end of the intron (12). The reaction pathway can be used to detect self-splicing group I introns by incubating deproteinized RNA with radio-labeled GTP in vitro (13). GTP labeling led to the discovery of a number of group I introns in phages (3, 14) and in the tRNA genes of various eubacteria (15, 16).
Although only a core structure is required for splicing, group I introns can vary extensively in length because of the insertion of nonconserved nucleotides. In the phage T4 td and nrdD/sunY introns and in the DNA polymerase introns of phages SPO1 and SP82 these extra nucleotides code for DNA endonucleases (17, 18). For the T4 td and nrdD/sunY intron, it has been demonstrated that the intron-encoded endonucleases I-TevI and I-TevII, respectively, are involved in the mobility (homing) of the intron into unoccupied sites (ref. 17; for a review on intron mobility, see ref. 19). On the other hand, endonuclease I-HmuII, of the SP82 intron, is required for preferential exclusion of genetic markers of the closely related phage SPO1 in mixed infections (18).
Bacillus phage β22, whose intron in its thy (thymidylate synthase) gene was discovered as a result of sequencing the gene, is a member of a large family of morphologically distinct phages that infect a wide range of low G-C Gram-positive bacteria (20, 21). The initial aim of this work was to use the GTP-labeling reaction to obtain information on the distribution of group I introns in this family of bacteriophages. During this screen, we encountered a surprisingly large number of GTP-labeled products derived from staphylococcal phage Twort RNA, indicative of a large number of self-splicing introns in this phage genome. In this work, we describe cloning and characterization of three self-splicing introns that are inserted in a single late-transcribed ORF.
An interesting historical note is provided by the fact that this phage was apparently the first to be isolated and described in the literature (22).
MATERIALS AND METHODS
Bacterial and Bacteriophage Strains and Growth Conditions.
Phage Twort (HER 48) and its host Staphylococcus aureus Twort (HER1048) were obtained from the Felix d’Herelle Reference Center maintained by H.-W. Ackermann. S. aureus was grown in Nutrient Broth with supplements (10 g of Nutrient Broth/5 g of peptone/2.5 g of yeast extract/9 g of NaCl/0.3 g of KCl per liter) with shaking at 37°C. E. coli XL-1 blue (Stratagene) was used as a recipient strain for high-frequency plasmid electroporations.
Plasmids and Plasmid Constructions.
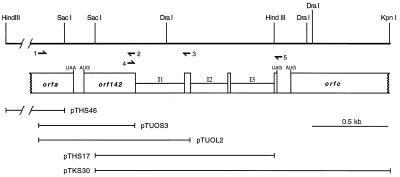
After digestion of Twort DNA with HindIII and KpnI, fragments were separated on a low melting-point agarose gel and a 4.6 kilobase pair (kb) and a 5.4-kb fragment, respectively, were extracted by using Gelase (Epicentre Technologies, Madison, WI), as described in the supplier’s protocol. These DNA fragments were further digested with SacI and ligated to HindIII/SacI-digested pBSM13+ and KpnI/SacI-digested pBluescript II SK+ (Stratagene). Plasmids pTHS17 and pTHS46 contain 1.2-kb and 3.2-kb HindIII/SacI fragments, respectively, and plasmid pTKS30 contains a 2.0-kb KpnI/SacI fragment. Overlapping fragments between the two SacI sites were generated by PCR amplification, using oligonucleotide 1 as upstream primer and oligonucleotide 2 or 3 as downstream primer. Purified PCR products were ligated to HincII-digested pBSM13+. pTUOS3 and pTUOL3 contain 641-bp and 998-bp inserts, respectively.
RNA Isolation.
S. aureus cells were grown to a OD540 of 0.2 (approximately 1 × 10⁸ cells/ml) and infected with about seven phages/cell. Cells (25 ml) were harvested by centrifugation at 5,000 × g for 10 min at 4°C and washed twice with 10 mM Tris⋅HCl (pH 7.5 at 4°C) and 100 μg/ml chloramphenicol. After being pelleted, the cells were resuspended in 10 mM Tris⋅HCl (pH 8.0) and 1 mM EDTA containing 50 μg/ml lysostaphin (Sigma) and incubated for 5 min at room temperature. RNA was isolated with the RNeasy Kit (Qiagen, Chatsworth, CA), as explained in the manufacturer’s protocol, for isolation of total RNA from bacteria. In vitro labeling of RNA with [α-32P]GTP was according to ref. 3.
Phage DNA Isolation.
S. aureus cells were grown to a OD540 of about 0.2 and infected at a multiplicity of about 0.1 phage/cell, and incubation was continued until lysis was complete. Phages were precipitated in 10% polyethylene glycol 8,000 and phage particles were further purified by centrifugation through a CsCl step gradient. After removal of CsCl by dialysis, the phage DNA was extracted with phenol. DNA was stored in 50 mM Tris⋅HCl (pH 8.0) and 1 mM EDTA.
DNA Blot Hybridizations.
Restriction enzyme digests of Twort DNA were separated on a 1% agarose gel and vacuum blotted onto a positively charged nylon membrane (Hybond-N+, Amersham) by alkaline transfer. The Twort DNA blot was probed with [α-32P]GTP-labeled RNA.
Preparation of cDNA.
RNA was treated with 1 unit of RQ1 RNase-free DNase (Promega) in 50 mM Tris⋅HCl (pH 7.5)/10 mM MgCl2/50 μg/ml BSA for 20 min at room temperature, phenol-extracted and coprecipitated with 1.5 nmol cDNA synthesis primer. The reverse-transcription reaction was carried out in 50 mM Tris⋅HCl (pH 8.3)/3 mM MgCl2/75 mM KCl/10 mM DTT/1 mM of each dNTP/3 μg of template RNA/50 units of reverse transcriptase, RNaseH− (Superscript II, GIBCO/BRL). The reaction was incubated for 60 min at 47°C. Primer used for cDNA synthesis was removed by using the QIAquick spin PCR purification Kit (Qiagen). One twenty-fifth of reverse-transcription reactions was used for PCR amplification.
PCR.
Phage DNA (50 ng) was amplified by using 20 pmol of each primer, 200 μM of each deoxynucleoside triphosphate, 2.5 units of Taq DNA polymerase, and 1× Taq buffer (Boehringer Mannheim) containing 1.5 mM MgCl2. Thermal cycle conditions consisted of 92°C for 1 min, optimal annealing temperature for 1 min, and 72°C for 2 min. After 30 cycles, the reaction was completed with a final extension step at 72°C for 5 min. All PCR products were purified with the QIAquick spin PCR purification kit and were analyzed by electrophoresis in agarose gels.
DNA Sequencing and Sequence Analysis.
Plasmid DNA was prepared with QIAprep Spin Plasmid Kit (Qiagen) and sequenced by using chemically synthesized oligonucleotides with the Sequenase Sequencing Kit (United States Biochemical) or with a Taq Dyedeoxy Terminator Cycle Sequencing Kit (Applied Biosystems). Both strands were sequenced. Sequence compilation and analysis were performed by use of the genetic computer group sequence analysis software package (version 9.1).
Oligonucleotides.
1. 5′-GGTACACGAACTATCAATACAAG (60–82).
2. 5′-GTTATTAGCACTACAACCGTG (complement: 700–680).
3. 5′-GTTATTTCATTAGTGTTCCATGC (complement: 1,057–1,035).
4. 5′-GAAGTGCTTGTGTCATATCACGG (662–684).
5. 5′-GATACTATCGTGAAGCTTTATC (complement: 1,654–1,633).
RESULTS
Detection of Multiple Group I Introns by GTP Labeling of Twort RNA.
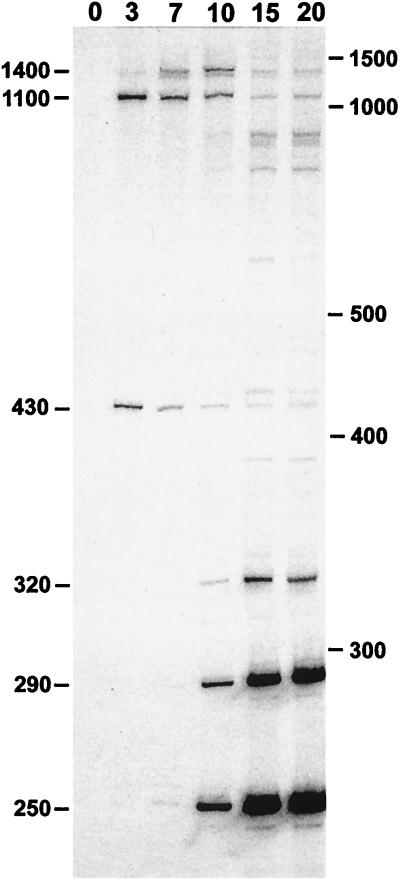
RNA, isolated from S. aureus at various times after infection with phage Twort, was incubated with [α-32P]GTP under self-splicing conditions and yielded multiple GTP-labeled RNA products (Fig. 1). Interestingly, the various GTP-labeled products show maximal concentrations at different times after infection. Products of approximately 1,100 nt and 430 nt are labeled maximally in RNA isolated 3 min after infection, and a product of about 1,400 nt, appearing by 7 min, is most strongly labeled in 10-min RNA. Labeled RNAs of about 320 nt, 290 nt, and 250 nt and minor products of larger size appear by 10 min and are most intense in 15- to 20-min RNA (Fig. 1). In contrast, no labeled product was detectable in RNA derived from uninfected S. aureus. These results indicate the presence of multiple self-splicing introns in genes of at least three transcriptional classes.
Figure 1.
In vitro [α-32P]GTP labeling of S. aureus bacteriophage Twort RNA. RNA (2.5 μg) isolated from S. aureus before (0) and at times indicated after infection with Twort was deproteinized and incubated with [α-32P]GTP under self-splicing conditions. Samples were separated by electrophoresis in a 4% acrylamide/6 M urea gel. Approximate sizes of the major GTP-labeled products are indicated on the left of the autoradiogram. Positions of the 100-bp ladder size standards are indicated to the right.
Cloning and Sequencing of Late Introns.
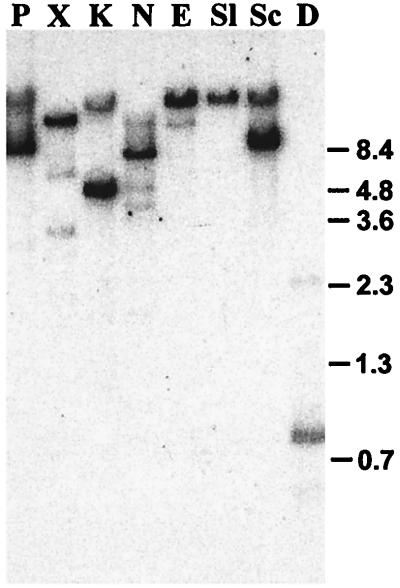
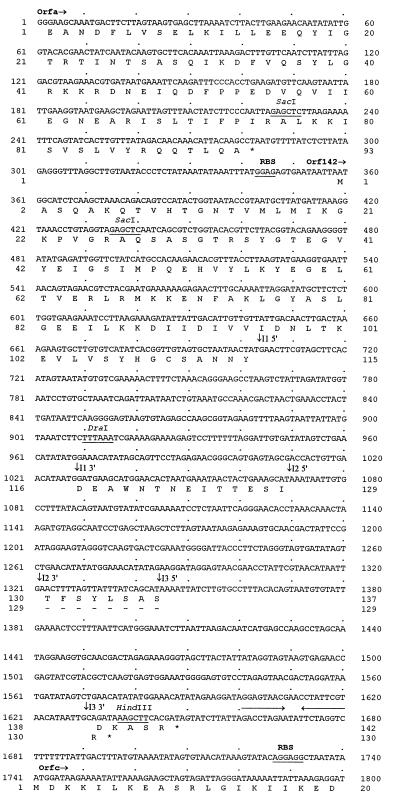
A blot of digested Twort DNA was probed with GTP-labeled 15-min RNA, resulting in hybridizing bands that differ in signal intensity (Fig. 2). For most restriction enzyme digests, a single strong and several weak signals could be detected. Some of the fragments that hybridized weakly to GTP-labeled 15-min RNA were also detectable when GTP-labeled 7-min RNA was used for probing (data not shown), suggesting that these fragments contain introns present in RNA that is transcribed early during infection. GTP-labeled 15-min RNA hybridized intensely to a 4.6-kb HindIII (data not shown) and to a 5.4-kb KpnI restriction fragment (Fig. 2). Further digestion with SacI reduced the sizes of the hybridizing species to 1.2-kb and 2.0-kb, respectively. The 1.2-kb HindIII/SacI fragment was cloned (pTHS17), and sequence analysis revealed three putative group I introns of 325 nt, 242 nt, and 286 nt. The sequence surrounding the introns was obtained by cloning a combination of restriction fragments and PCR products (Fig. 3). Alignment of the sequences yielded a contiguous stretch of 2,397 bp. An annotated presentation of the first 1,800 bp is shown in Fig. 4.
Figure 2.
Southern blot hybridization of GTP-labeled Twort RNA to genomic DNA. Twort DNA was digested with PstI (P), XbaI (X), KpnI (K), NsiI (N), EcoRI (E), SalI (Sl), SacI (Sc), and DraI (D) and transferred. The blot was probed with 50 μg 15-min Twort RNA that was end-labeled with [α-32P] GTP under self-splicing conditions. Sizes of BstEII digested λ DNA fragments are indicated to the right.
Figure 3.
Genomic organization and restriction map. Relevant restriction sites are given. Predicted ORFs are shown as boxes. orfa and orfc are incomplete. Introns in gene orf142 are shown as half-sized boxes. Positions of the oligonucleotides used for PCR and RT-PCR are represented with arrows, with the arrowhead indicating the 3′ end of the primer. Location of the cloned DNA fragments is shown and plasmid names are given.
Figure 4.
Nucleotide sequence of the cloned region of the Twort genome. Predicted amino acid sequences are given below. Stop codons are indicated with asterisks. Presumed ribosomal binding sites (RBS) and restriction sites are underlined. Inverted repeat downstream of orf142 is indicated by arrows. Intron splice sites are shown as downward-pointing arrows.
Splicing in Vivo.
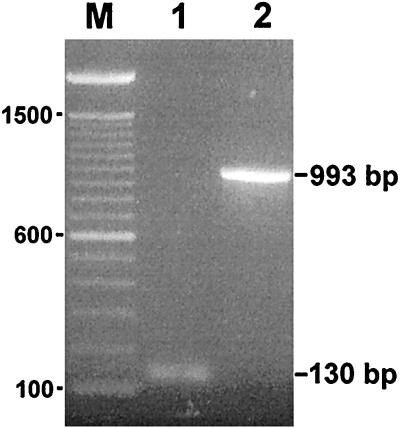
We used reverse transcription and PCR to determine whether the three introns are spliced in vivo and to confirm the positions of the splice sites. RNA isolated from S. aureus 15 min after infection was reverse transcribed by using oligonucleotide 5, and the cDNA was amplified by using oligonucleotides 4 and 5 (Fig. 3). The reaction resulted in a PCR product of 130 bp, the size expected for complete excision of the introns (Fig. 5). The nucleotide sequence of the reverse–transcription PCR (RT-PCR) product confirms that the three introns were removed in vivo, precisely as predicted from the secondary structures (Figs. 6 and 7).
Figure 5.
In vivo splicing. Electrophoretic analysis of (1) RT-PCR product obtained by using primers 4 and 5 on 15-min Twort RNA and (2) PCR product obtained by using the same primers on Twort phage DNA. Sizes of the PCR products are indicated to the right. A 100-bp ladder was used as a marker (M), with sizes given on the left.
Figure 6.
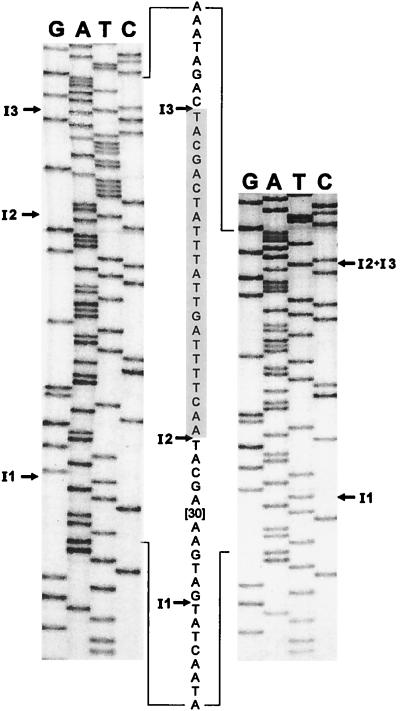
orf142 splice junctions. The sequencing ladders of the major 130-bp RT-PCR product (Left) and the minor 107-bp RT-PCR product (Right) around the intron insertion sites are shown. Lanes are labeled with the dideoxynucleotides. The sequence of the ligated exons is given between the ladders (with 30 nt of exon 2 omitted). The shaded sequence (exon 3) is deleted in the 107-bp RT-PCR product. Arrows indicate the intron insertion sites.
Figure 7.
Sequence alignment of Twort orf142 introns and T4 nrdB intron. Conserved base-paired regions (P1-P9) are underlined. Numbers in brackets stand for nucleotides not included in the alignment. Vertical arrows point out the 5′ and 3′ splice sites. Lowercase letters indicate exon sequence and uppercase letters indicate intron sequence.
The high similarity of the second and the third introns (Fig. 7) and the close proximity (23 bp) of their insertion sites (Fig. 4) further suggested that these two introns might fold to form a single functional ribozyme, resulting in skipping of an exon. The possibility of alternative splicing was examined by amplifying the cDNA with oligos 4 and 5, primer 5 having been end-labeled with T4 polynucleotide kinase. The PCR products were separated on a native 8% polyacrylamide gel and visualized by autoradiography. An extremely weak band at about 110 bp was detectable, indicating a PCR product that migrated faster than the major product of 130 bp (data not shown). The smaller PCR product was eluted from the gel, reamplified, cloned, and sequenced. The nucleotide sequence of this product revealed an exact deletion of exon 3, as expected for an amplified cDNA generated from an alternatively spliced transcript (Fig. 6).
Intron Structures and Sequences.
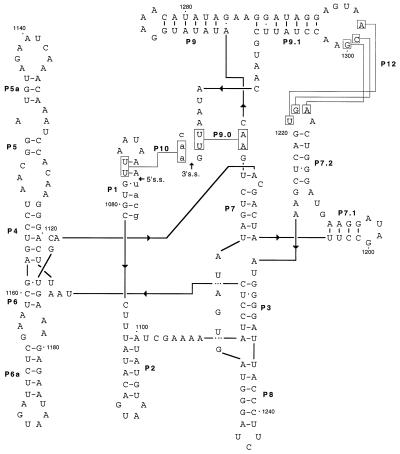
Fig. 8 shows the proposed secondary structure of orf142 intron 2 (I2) as a representative structure. The three orf142 introns (designated orf142-I1, -I2, and -I3) follow the consensus for group I introns closely, containing all the conserved sequence elements and base-paired regions (Fig. 7) that are typical for introns of subgroup IA2, comprising the bacteriophage introns (11, 23). Unlike most other bacteriophage introns, the Twort orf142 introns show no large insertions of nonconserved nucleotides in terminal loop regions indicative of intron-encoded ORFs.
Figure 8.
Secondary structure of group I intron orf142-I2. Exon sequence in lowercase and intron sequence in uppercase letters. Arrows indicate 5′ and 3′ splice sites (s.s.). Conserved structural elements P1 through P10 are indicated, and putative tertiary interaction P12 is shown (23).
The orf142 introns I2 and I3 are more closely related to each other in sequence and structure than each of them is to intron I1. The overall identity of introns I2 and I3 is 85% over 212 aligned nucleotides, whereas I2 and I3 show 69% and 68% identity to intron I1 (Table 1). The 71 nucleotides at the 3′ end, including structural element P9.1 (whose sequence is not phylogenetically conserved), are identical between introns I2 and I3 (Fig. 7).
Table 1.
Sequence identity between Twort orf142 introns and the T4 nrdB intron
| orf142-I2 | orf142-I3 | T4 nrdB | |
|---|---|---|---|
| orf142-I1 | 147/212 (69%) | 144/212 (68%) | 131/212 (62%) |
| orf142-I2 | — | 181/212 (85%) | 148/212 (70%) |
| orf142-I3 | — | — | 152/212 (72%) |
Number of identical nucleotides of 212 compared positions are given.
When the nucleotide database was searched by using blastn (24) with the sequence of intron I2, the highest scoring match (identity of 26/27 bases, E value = 0.002) was to the phage T4 nrdB intron in a sequence that includes the structural element P7.2 (whose sequence is not conserved among the group IA introns). Further pairwise comparison of orf142 introns I2 and I3 to the T4 nrdB intron indicates 78% and 80% identity, respectively, from the beginning of the intron to the 5′ portion of P4 (Fig. 7), and 70% and 72% identity overall (Table 1).
Coding Regions.
An analysis of the nucleotide sequence after intron removal revealed two partial ORFs, designated orfa (position 1–281) and orfc (position 1741–2397), and a complete ORF of 142 amino acids, designated orf142, which is interrupted by three self-splicing group I introns. Translation of the putative alternatively spliced transcript results in an ORF of 130 amino acids, in which the last 13 amino acids of Orf142 are replaced by an arginine (Fig. 4). We used the deduced amino acid sequences for database searches with gapped blastp (using standard parameters) provided by the National Center for Biotechnology Information network service (24). Statistically significant alignments were obtained for Orfa and Orf142 to late cotranscribed genes of Listeria phage A511 (25) belonging to the same taxonomic group (A1) as Twort (26). Orfa shows 86% similarity (70% identity) to the 93 carboxyl-terminal amino acids of the major tail sheath protein (Tsh) of phage A511, and Orf142 shows 82% similarity (71% identity) to Orf8, located immediately downstream of tsh, over 138 amino acids that were aligned. Although database searches provide no indication for a function of Orf142, it is likely to be a late gene product that is not involved in DNA synthesis.
DISCUSSION
End labeling of RNA in vitro with GTP provides an unbiased assay for the presence of group I introns. Although there are many reasons why an intron might not be detected by this method (it may be present in a poorly transcribed gene; protein or other factors may be required for splicing, etc.) GTP-labeled RNA can be used to characterize self-catalytic introns without preconceived ideas of their likely genomic locations. This assay has revealed an unexpected richness of group I introns in phage Twort. Introns are present in RNA molecules representing at least three temporal periods of infection (Fig. 1).
Are Phage Introns Useful?
The four introns initially described in E. coli phage T4 (3–5, 27) and B. subtilis phage SPO1 (14) are all in genes concerned with DNA synthesis, stimulating the suggestion that splicing might be involved in a global regulatory mechanism involving DNA replication (3, 14). The recent finding of a group I intron and an intein in the nrdE gene of the B. subtilis prophage SPβ (28) provoked a reexamination of this idea (29). However, our description of three introns in orf142 and recent reports of introns in late genes of other phages (9, 10) weaken the hypothesis that introns are retained in the genome to act in the regulation of DNA synthesis.
The question that remains is, why are introns maintained in bacteriophage genomes, in particular in Twort, with multiple introns in different transcriptional classes? Introns could be beneficial to the phage in several ways. For example, they could provide noncoding targets for recombination leading to shuffling of exons (30). Also, the presence of multiple introns in a single gene may allow synthesis of several products of the same gene by incomplete or alternative splicing of the mRNA. We have demonstrated here that some transcripts of Twort orf142 mRNA precisely lack the exon between the highly similar introns I2 and I3. Although we cannot be certain of the biological significance of these shorter transcripts [they could have been generated by aberrant splicing events in vitro, by intramolecular trans splicing in vivo (31), or by folding of the highly similar introns I2 and I3 into a single hybrid ribozyme], their existence demonstrates the feasibility of programmed exon skipping by using self-splicing introns. Previous studies have suggested a different kind of alternative splicing of some group I introns, whereby fungal mitochondrial introns bring their upstream exons into phase with their internal ORFs by occasional use of an alternative 3′ splice site located between the ORF and the conserved intron core (11, 32–34).
On the other hand, the phage introns may be solely selfish DNA elements with invasive potential because of the intron-encoded DNA endonucleases that promote the mobility of the intron (35). The GTP-labeled products of about 1,100 nt and 1,400 nt in early Twort RNAs (Fig. 1) suggest the presence of group I introns with sizes that are sufficient to contain intron ORFs with potential to encode endonucleases. However, unlike most other bacteriophage introns, the three orf142 introns do not contain ORFs, which argues against a “parasitic” nature of these introns.
Goodrich-Blair and Shub (18) have described an intermediate situation, where an intron is responsible for the selective propagation of neighboring genes during mixed infection with a related phage carrying its own version of the intron. Although providing an interesting case of competition among introns, this example does not resolve the issue of whether introns can have a selective value at the organism level (36).
The Origin of Phage Introns.
All of the phage introns are very closely related, belonging to a single subgroup (IA2) of the group I introns (11), suggesting that they are all derived from a relatively recent common ancestor. The high similarity between the thy intron of phage β22 and the td intron of phage T4 (7) and between orf142 introns I2 and I3 of phage Twort and the nrdB intron of T4 is particularly noteworthy. It is intriguing to note that (with the exception of integrated prophage genes) this subgroup has not been found in eubacterial chromosomal genes. Group I introns in bacteria have been found only in tRNA genes, and all of them belong to subgroup IC3 (15, 16, 37, 38).
Although the origin of the phage introns remains in doubt, their distribution is decidedly skewed. Although introns were found in three genes of E. coli phage T4, a survey of a large number of close relatives (T-even phages), either obtained from various culture collections or newly isolated from different natural sources, yielded only a few that had even one of the introns found in T4 (39). Moreover, introns have never been observed in other phages of E. coli or Gram-negative bacteria.
On the other hand, group I introns appear to have been very successful among the phages of low G-C Gram-positive bacteria. Introns have been found in a wide selection of genes, in both temperate and virulent phages of a number of different genera (Bacillus, Lactobacillus, Lactococcus, Staphylococcus). Moreover, when independent isolates of relatives of intron-containing phages SPO1 (8) or β22 (this work and our unpublished results) were examined, a majority were found to contain introns. To explain this disparity, either introns were relatively recently introduced into T4 from a Gram-positive phage, or conditions in Gram-positive bacteria are particularly favorable for the propagation and maintenance of introns in their viruses.
The presence of highly similar group I introns in the thymidylate synthase genes of Bacillus phage β22 and E. coli phage T4 suggested a lateral transfer of introns between phages of Gram-positive and Gram-negative bacteria (7). However, different locations of the introns in these homologous genes, and the different locations of the ORFs within the introns, made it difficult to explain the mobility of the intron by a simple homing event. Similarly, insertion of the T4 nrdB intron and the closely related Twort orf142 introns I2 and I3 in nonallelic sites is also consistent with intron transposition. Transposition of an intron to a nonallelic site probably occurs by a mechanism related to homing of the intron into unoccupied sites of homologous genes. This could be accomplished by means of homing endonucleases (40), whose genes reside in introns, or by reverse splicing followed by reverse transcription (41).
Although we cannot be certain which mechanism is responsible for intron spread among the bacteriophages, the properties of orf142 introns I2 and I3 are consistent with an RNA-mediated transposition event. These introns, which lack ORFs for homing endonucleases, are 85% identical in nucleotide sequence and have identical P1 pairings with the last four nucleotides of their 5′ exons. Roman and Woodson (42) have shown that the Tetrahymena LSU rRNA intron reverse splices successfully in vivo into the 23S rRNA of E. coli, requiring only a tetranucleotide recognition sequence that interacts with the internal guide sequence of the intron to form P1. Bacteriophage Twort may be a useful biologically relevant system to study intron transposition by reverse splicing.
Concluding Remarks.
Low G-C Gram-positive bacteria (Bacilli) were the subjects of pioneering studies of bacteria by Koch and Tyndall, as is known by every student of microbiology. Twort, the first bacteriophage to be recognized and described in the literature (22), is easily propagated to high titer by using standard methods. It is amusing to contemplate that if, instead of E. coli, the low G-C Gram-positive bacteria and their phages had become the paradigms for bacterial genetic research, split genes and self-splicing RNA might have been discovered initially as properties of bacteria.
Acknowledgments
We thank David Edgell and Bruno Paquin for discussions and critical reading of the manuscript and Thomas Cech for helpful comments. This work was supported by grant GM 37746 from the National Institutes of Health.
ABBREVIATIONS
- RT-PCR
reverse–transcription PCR
Footnotes
Data deposition: The sequence reported in paper has been deposited in the GenBank database (accession no. AF132670).
References
- 1.Saldanha R, Mohr G, Belfort M, Lambowitz A M. FASEB J. 1993;7:15–24. doi: 10.1096/fasebj.7.1.8422962. [DOI] [PubMed] [Google Scholar]
- 2.Yamada T, Tamura K, Aimi T, Songsri P. Nucleic Acids Res. 1994;22:2532–2537. doi: 10.1093/nar/22.13.2532. [DOI] [PMC free article] [PubMed] [Google Scholar]
- 3.Gott J M, Shub D A, Belfort M. Cell. 1986;47:81–87. doi: 10.1016/0092-8674(86)90368-5. [DOI] [PubMed] [Google Scholar]
- 4.Sjöberg B M, Hahne S, Mathews C Z, Mathews C K, Rand K N, Gait M J. EMBO J. 1986;5:2031–2036. doi: 10.1002/j.1460-2075.1986.tb04460.x. [DOI] [PMC free article] [PubMed] [Google Scholar]
- 5.Young P, Ohman M, Xu M-Q, Shub D A, Sjöberg B M. J Biol Chem. 1994;269:20229–20232. [PubMed] [Google Scholar]
- 6.Chu F K, Maley G F, Maley F, Belfort M. Proc Natl Acad Sci USA. 1984;81:3049–3053. doi: 10.1073/pnas.81.10.3049. [DOI] [PMC free article] [PubMed] [Google Scholar]
- 7.Bechhofer D H, Hue K K, Shub D A. Proc Natl Acad Sci USA. 1994;91:11669–11673. doi: 10.1073/pnas.91.24.11669. [DOI] [PMC free article] [PubMed] [Google Scholar]
- 8.Goodrich-Blair H, Shub D A. Nucleic Acids Res. 1994;22:3715–3721. doi: 10.1093/nar/22.18.3715. [DOI] [PMC free article] [PubMed] [Google Scholar]
- 9.Mikkonen M, Alatossava T. Microbiology. 1995;141:2183–2190. doi: 10.1099/13500872-141-9-2183. [DOI] [PubMed] [Google Scholar]
- 10.van Sinderen D, Karsens H, Kok J, Terpstra P, Ruiters M H, Venema G, Nauta A. Mol Microbiol. 1996;19:1343–1355. doi: 10.1111/j.1365-2958.1996.tb02478.x. [DOI] [PubMed] [Google Scholar]
- 11.Michel F, Westhof E. J Mol Biol. 1990;216:585–610. doi: 10.1016/0022-2836(90)90386-Z. [DOI] [PubMed] [Google Scholar]
- 12.Cech T R. Annu Rev Biochem. 1990;59:543–568. doi: 10.1146/annurev.bi.59.070190.002551. [DOI] [PubMed] [Google Scholar]
- 13.Garriga G, Lambowitz A M. Cell. 1984;38:631–641. doi: 10.1016/0092-8674(84)90470-7. [DOI] [PubMed] [Google Scholar]
- 14.Goodrich-Blair H, Scarlato V, Gott J M, Xu M Q, Shub D A. Cell. 1990;63:417–424. doi: 10.1016/0092-8674(90)90174-d. [DOI] [PubMed] [Google Scholar]
- 15.Xu M-Q, Kathe S D, Goodrich-Blair H, Nierzwicki-Bauer S A, Shub D A. Science. 1990;250:1566–1570. doi: 10.1126/science.2125747. [DOI] [PubMed] [Google Scholar]
- 16.Reinhold-Hurek B, Shub D A. Nature (London) 1992;357:173–176. doi: 10.1038/357173a0. [DOI] [PubMed] [Google Scholar]
- 17.Quirk S M, Bell-Pedersen D, Belfort M. Cell. 1989;56:455–465. doi: 10.1016/0092-8674(89)90248-1. [DOI] [PubMed] [Google Scholar]
- 18.Goodrich-Blair H, Shub D A. Cell. 1996;84:211–221. doi: 10.1016/s0092-8674(00)80976-9. [DOI] [PubMed] [Google Scholar]
- 19.Lambowitz A M, Belfort M. Annu Rev Biochem. 1993;62:587–622. doi: 10.1146/annurev.bi.62.070193.003103. [DOI] [PubMed] [Google Scholar]
- 20.Ackermann H-W, DuBow M S. Viruses of Prokaryotes. Volume II: Natural Groups of Bacteriophages. Boca Raton, FL: CRC; 1987. [Google Scholar]
- 21.Jarvis A W, Collins L J, Ackermann H W. Arch Virol. 1993;133:75–84. doi: 10.1007/BF01309745. [DOI] [PubMed] [Google Scholar]
- 22.Twort F W. Lancet. 1915;189:1241–1243. [Google Scholar]
- 23.Michel F, Jaeger L, Westhof E, Kuras R, Tihy F, Xu M Q, Shub D A. Genes Dev. 1992;6:1373–1385. doi: 10.1101/gad.6.8.1373. [DOI] [PubMed] [Google Scholar]
- 24.Altschul S F, Madden T L, Schaffer A A, Zhang J, Zhang Z, Miller W, Lipman D J. Nucleic Acids Res. 1997;25:3389–3402. doi: 10.1093/nar/25.17.3389. [DOI] [PMC free article] [PubMed] [Google Scholar]
- 25.Loessner M J, Scherer S. J Bacteriol. 1995;22:6601–6609. doi: 10.1128/jb.177.22.6601-6609.1995. [DOI] [PMC free article] [PubMed] [Google Scholar]
- 26.Zink R, Loessner M J. Appl Environ Microbiol. 1992;58:296–302. doi: 10.1128/aem.58.1.296-302.1992. [DOI] [PMC free article] [PubMed] [Google Scholar]
- 27.Belfort M, Pedersen-Lane J, West D, Ehrenman K, Maley G F, Chu F, Maley F. Cell. 1985;41:375–382. doi: 10.1016/s0092-8674(85)80010-6. [DOI] [PubMed] [Google Scholar]
- 28.Lazarevic V, Soldo B, Düsterhöft A, Hilbert H, Mauël C, Karamata D. Proc Natl Acad Sci USA. 1998;95:1692–1697. doi: 10.1073/pnas.95.4.1692. [DOI] [PMC free article] [PubMed] [Google Scholar]
- 29.Derbyshire V, Belfort M. Proc Natl Acad Sci USA. 1998;95:1356–1357. doi: 10.1073/pnas.95.4.1356. [DOI] [PMC free article] [PubMed] [Google Scholar]
- 30.Hall D H, Liu Y, Shub D A. Nature (London) 1989;340:575–576. doi: 10.1038/340574a0. [DOI] [PubMed] [Google Scholar]
- 31.Inoue T, Sullivan F X, Cech T R. Cell. 1985;43:431–437. doi: 10.1016/0092-8674(85)90173-4. [DOI] [PubMed] [Google Scholar]
- 32.Hensgens L A M, Bonen L, de Haan M, van der Horst G, Grivell L A. Cell. 1983;32:379–389. doi: 10.1016/0092-8674(83)90457-9. [DOI] [PubMed] [Google Scholar]
- 33.Cummings D J, Domenico J M, Michel F. Curr Genet. 1988;14:253–264. doi: 10.1007/BF00376746. [DOI] [PubMed] [Google Scholar]
- 34.Sellem C H, Belcour L. Nucleic Acids Res. 1994;22:1135–1137. doi: 10.1093/nar/22.7.1135. [DOI] [PMC free article] [PubMed] [Google Scholar]
- 35.Belfort M. Trends Genet. 1989;5:209–213. doi: 10.1016/0168-9525(89)90083-8. [DOI] [PubMed] [Google Scholar]
- 36.Edgell D R, Fast N M, Doolittle W F. Curr Biol. 1996;6:385–388. doi: 10.1016/s0960-9822(02)00502-x. [DOI] [PubMed] [Google Scholar]
- 37.Kuhsel M G, Strickland R, Palmer J D. Science. 1990;250:1570–1573. doi: 10.1126/science.2125748. [DOI] [PubMed] [Google Scholar]
- 38.Biniszkiewicz D, Cesnaviciene E, Shub D A. EMBO J. 1994;13:4629–4635. doi: 10.1002/j.1460-2075.1994.tb06785.x. [DOI] [PMC free article] [PubMed] [Google Scholar]
- 39.Eddy S. Ph.D. thesis. Boulder: Univ. of Colorado; 1992. [Google Scholar]
- 40.Parker M M, Court D A, Preiter K, Belfort M. Genetics. 1996;143:1057–1068. doi: 10.1093/genetics/143.3.1057. [DOI] [PMC free article] [PubMed] [Google Scholar]
- 41.Woodson S A, Cech T R. Cell. 1989;57:335–345. doi: 10.1016/0092-8674(89)90971-9. [DOI] [PubMed] [Google Scholar]
- 42.Roman J, Woodson S A. Proc Natl Acad Sci USA. 1998;95:2134–2139. doi: 10.1073/pnas.95.5.2134. [DOI] [PMC free article] [PubMed] [Google Scholar]


