

Abstract
Background and aims
IL-6 mediated STAT-3 phosphorylation (activation) is aberrantly sustained in cholangiocarcinoma cells resulting in enhanced Mcl-1 expression and resistance to apoptosis. Because SOCS-3 controls the IL-6/STAT-3 signaling pathway by a classic feedback loop, the aims of this study were to examine SOCS-3 regulation in human cholangiocarcinoma.
Methods
SOCS-3 expression was assessed in human cholangiocarcinoma tissue and the Mz-ChA-1 and CCLP1 human cholangiocarcinoma cell lines.
Results
An inverse correlation was observed between phospho-STAT-3 and SOCS-3 protein expression in cholangiocarcinoma. In those cancers failing to express SOCS-3, extensive methylation of the SOCS-3 promoter was demonstrated in tumor but not in paired non-tumor tissue. Likewise, methylation of the socs-3 promoter was also identified in two cholangiocarcinoma cell lines. Treatment with a demethylating agent, 5-aza-2′-deoxycytidine (DAC), restored IL-6 induction of SOCS-3, terminated the phospho-STAT-3 response, and reduced cellular levels of Mcl-1. Enforced expression of SOCS-3 also reduced IL-6 induction of phospho-STAT-3 and Mcl-1. Either DAC treatment or enforced SOCS-3 expression sensitized the cells to TRAIL-mediated apoptosis.
Conclusion
SOCS-3 epigenetic silencing is responsible for sustained IL-6/STAT-3 signaling and enhanced Mcl-1 expression in cholangiocarcinoma.
Keywords: apoptosis, 5-aza-2′-deoxycytidine, CpG islands, methylation-specific PCR, STAT-3, TRAIL
Cholangiocarcinoma is an aggressive neoplasm with differentiated features of bile duct epithelia, and current concepts suggest that this cancer arises from bile duct epithelial cells.1 Chronic bile duct inflammation is an established risk factor for the development of cholangiocarcinoma.2–4 As chronic inflammation is being increasingly recognized as an integral component of many cancers including several gastrointestinal malignancies,1, 4–8 cholangiocarcinoma is a model disease to investigate the relationship between chronic inflammation and the initiation and progression of cancers. Insight into how inflammation promotes this malignancy may also provide therapeutic strategies for the treatment of this otherwise devastating disease.9
Cytokines produced in the inflammatory environment have an important role in cancer pathogenesis.5–7, 10–12 The cytokine interleukin 6 (IL-6) has been demonstrated to have an integral role in cholangiocarcinoma biology and other cancers as a growth and survival factor.11, 13–19 For example, we have recently demonstrated that IL-6 induces expression of the potent anti-apoptotic protein myeloid cell leukemia 1 (Mcl-1) in cholangiocarcinoma cells via phosphorylation of a pivotal transcription factor, signal transducers and activators of transcription 3 (STAT-3) phosphorylation.18 Mcl-1 expression provides this cancer resistance to tumor necrosis factor-related apoptosis-inducing ligand (TRAIL).20 Inhibition of IL-6 induced expression of Mcl-1 restores sensitivity to TRAIL19; an observation of therapeutic relevance.21, 22 Our prior studies suggested IL-6 signaling was aberrant in cholangiocarcinoma cells with prolonged and sustained STAT-3 phosphorylation; a mechanism likely accounting for upregulation of Mcl-1 expression by these cancers.18 The mechanisms responsible for this atypical IL-6 signaling response are unclear but of pathophysiological importance.
Under physiologic conditions, IL-6 via a Janus kinase (JAK)/STAT-3 pathway induces expression of suppressor of cytokine signaling 3 (SOCS-3).23–27 This protein has a high affinity for tyrosine 759 of the plasma membrane protein, gp130, an integral member of the IL-6 signaling complex.23, 25, 27, 28 By binding to this residue, SOCS-3 is able to inhibit IL-6 signaling thereby turning it off in a classic feed back loop.23–27 Silencing of SOCS-3 is a potential mechanism explaining the sustained IL-6 induced STAT-3 phosphorylation observed in cholangiocarcinoma cell lines.18 Recent reports suggest SOCS-3 may be silenced by epigenetic phenomenon in human cancers, namely methylation of CpG islands [(DNA regions greater than 500 bp with a G+C content equal to or greater than 55% of total nucleotides and a ratio of observed to expected CpG nucleotides >0.6)29] within the SOCS-3 promoter.30–32 Methylation of cytosine residues within promoter CpG islands is a well-established epigenetic process causing gene silencing.33, 34 Thus, CpG island methylation is an attractive mechanism explaining sustained IL-6 signaling in human cholangiocarcinoma.
The overall objective of this study was to examine SOCS-3 expression in human cholangiocarcinoma tissue and cell lines. To address this objective we formulated several questions as follows: i) Is there an inverse relationship between phosphorylated STAT-3 and SOCS-3 expression in human cholangiocarcinoma tissue?; ii) Is SOCS-3 silencing in human cholangiocarcinoma tissue and cell lines associated with CpG island methylation of its promoter?; iii) Does a demethylating agent restore SOCS-3 expression in human cholangiocarcinoma cells?; and iv) Does SOCS-3 expression inhibit IL-6 mediated STAT-3 phosphorylation, reduce cellular Mcl-1 protein levels, and restore sensitivity of human cholangiocarcinoma cells to TRAIL-mediated cytotoxicity? The results indicate that SOCS-3 is commonly silenced in human cholangiocarcinoma by epigenetic methylation of its promoter. The demethylating agent restores SOCS-3 expression, reduces Mcl-1 protein expression and augments cellular sensitivity to TRAIL. The data suggest epigenetic therapy of this cancer may be a useful therapeutic strategy.
Materials and Methods
Human Liver Tissue
After approval by the Mayo Clinic Institutional Review Board, immunohistochemical analysis was performed on 26 archived surgically resected liver specimens of patients with intrahepatic cholangiocarcinoma.
Immunohistochemistry
The 5-μm thick tissue sections of surgically resected cholangiocarcinoma, were deparaffinized in xylene, hydrated with graded ethanol and distilled water. Immunohistochemical staining was performed employing the DakoCytomation Envision+ System-HRP (DAB) (DakoCytomation, Carpinteria, CA) as described previously.19 The following steps were performed at room temperature unless otherwise specified. Briefly, after inhibition of endogenous peroxidase activity with blocking solution containing 0.03% H2O2 supplied by the kit for 5 min, the sections were incubated in blocking buffer (5% normal goat serum in phosphate buffer saline containing 0.05% Tween-20 [PBST]) for 30 min, and incubated overnight with rabbit phospho-STAT-3 (Tyr 705) polyclonal antibody diluted 1:200 with blocking buffer, or rabbit anti-SOCS-3 polyclonal antibody diluted 1:200 with blocking buffer at 4°C overnight. For negative control, the primary antibody was replaced with a normal rabbit immunoglobulin.
After incubation with the primary antisera, the sections were washed in PBS-T and incubated with peroxidase-labeled polymer conjugated to goat anti-rabbit immunoglobulins supplied by the kit for 30 min. The sections were then washed again with PBS-T and stained with 3,3′-diaminobenzidine chromogen solution containing hydrogen peroxidase supplied by the kit for 5 min, washed in distilled water for 1 min, counterstained with hematoxylin for 20 seconds, and washed again in distilled water for 3 min. Following dehydration, the tissue slides were soaked in xylene, mounted and examined by light microscopy. To evaluate positive reactivity of the antibodies, the percentage of the cells which contained nuclear (phospho-STAT-3) immunoreactivity or cytoplasmic (SOCS-3) immunoreactivity were quantitated. Only cells with immunoreactivity above background were considered positive. A minimum of 500 cells per specimen were examined and quantitated.
Laser capture microdissection and DNA isolation
The 5-mm paraffin-embedded sections were deparaffinized by incubation in a xylene (3×5 min), followed by rehydration through a series of 100, 95 and 75% ethanol (1 min each). After rinsing in sterile distilled water, the sections were stained using Histogene refill kit (Arcturus Engineering, Mountain View, CA), dehydrated in 75, 95 and 100% ethanol (1 min each), followed by xylene (2×5 min). Once air-dried, the slides were used for laser capture microdissection (LCM) employing the AutoPixcel LCM system (Arcturus Engineering). Target cell populations from the neoplastic and normal surrounding tissues (bile duct epithelial cells and hepatocytes) distant (at least 1cm) from neoplastic lesions were procured. The captured cells were incubated in proteinase K buffer (Arctrus Engineering) at 65°C overnight and genomic DNA was isolated from the captured cells using the DNA PicoPure isolation kit (Arcturus Engineering).
Methylation-specific PCR
Genomic DNA was subjected to bisulfite modification as described by Herman et al.35 Briefly, 2 μg of genomic DNA was denatured with 0.2 M NaOH at 37°C for 10 min and treated with 10 mM hydroquinone and 3M sodium bisulfite (pH 5.0) at 50°C for 16h. The modified DNA was purified using the Wizard DNA purification resin (Promega, Madison, WI), treated with 0.3 M NaOH, precipitated with ethanol and resuspended in 20 μL water. Two-μL aliquots were used as templates for methylation-specific PCR (MSP). MSP was performed under conditions described previously32 using either a methylation- or unmethylation-specific primer set. Sequences of the methylation-specific SOCS-3 primer pairs designed to amplify nucleotides -525 to -384 of the SOCS-3 promoter region (the start codon ATG is defined as +1) and the unmethylation-specific primer ones designed to amplify nucleotides -528 to -382 were shown in Table 1. The PCR products were electrophoresed on a 2% agarose gel, stained with ethidium bromide and visualized under ultraviolet illumination. Human male genomic DNA treated with methyltransferase (Chemicon International, Temecula, CA) was used as a methylation-positive control.
Table 1.
Sequences for primers employed in this study
| Primer pair | Annealing temperature (cycle) | Product size | |
|---|---|---|---|
| socs-3 gene sequence | |||
| 5′-UTR to exon 1 | F: 5′-TGCAGAGTAGTGACTAAACATTACAAGAA-3′ | 58°C (35) | 235 |
| R: 5′-GGAGGGGACCAGGAGAGG-3′ | |||
| exon 1 to intron | F: 5′-CGACTTGGACTCCCTGCT-3′ | 56°C (35) | 392 |
| R: 5′-GAGGGGAAACCGGGAAAAG-3′ | |||
| intron to exon 2 | F: 5′-CTCAGTCCCGGGAGCTTTTC-3′ | 58°C (35) | 715 |
| R: 5′-GCTGGTACTCGCTGTTGGAG-3′ | |||
| exon 2 | F: 5′-GGTCACCCACAGCAAGTTT-3′ | 55°C (35) | 676 |
| R: 5′-TTAAAGCGGGGCATCGTACT-3′ | |||
| exon 2 to 3′-UTR | F: 5′-AGTACGATGCCCCGCTTT-3′ | 55°C (35) | 670 |
| R: 5′-GCACCAGGTAGACTTTGGAAC-3′ | |||
| 3′-UTR | F: 5′-CCTGGTGACATGCTCCTCT-3′ | 55°C (35) | 629 |
| R: 5′-CAGGTAATTCCATCGCTGCT-3′ | |||
| 3′-UTR | F: 5′-TCATTGGAGAGGCTGGACTG-3′ | 55°C (35) | 400 |
| R: 5′-GCAAAGTTTGACTTGGATTGG-3′ | |||
| Methylation specific PCR | |||
| Methylated | F: 5′-GGAGATTTTAGGTTTTCGGAATATTTC-3′ | 58°C (35) | 142 |
| R: 5′-CCCCCGAAACTACCTAAACGCCG-3′ | |||
| Unmethylated | F: 5′-GTTGGAGTTTTAGGTTTTTGGTATTTT-3′ | 60°C (32) | 147 |
| R: 5′-AAACCCCAAAACTACCTAAACACCA-3′ | |||
| Bisulfite sequencing | F: 5′-GATTTGAGGGGGTTTAGTTTTAAGGA-3′ | 58°C (35) | 519 |
| R: 5′-CCACTACCCCAAAAACCCTCTCCTAA-3′ | |||
| Real-time PCR for socs-3 | F: 5′-TTCTACTGGAGCGCAGTGAC-3′ | 60°C (40) | 127 |
| R: 5′-ACTGGGTCTTGACGCTGAG-3′ | |||
UTR, untranslated region; F, forward; R, reverse; socs-3, suppressor of cytokine signaling 3
Bisulfite sequencing
Bisulfite-treated genomic DNA was amplified using primers to amplify -704 to -186 of the SOCS-3 promoter region (Table 1), adopting the protocols described previously.31 The PCR products were cloned into the pCR II vector in accordance with manufacturer’s instruction employing the TOPO-TA cloning kit (Invitrogen, Carsbad, CA). Plasmid DNA purified from 5 randomly picked clones using the plasmid miniprep kit (Bio-Rad Laboratories, Hercules, CA) were obtained and prepared for automated DNA sequencing analysis. The reaction conditions were as follows: 96°C for 10 sec, 50°C for 5 sec, 60 for 4 min for 25 cycles. DNA was sequenced using dye terminator technology and a ABI 3730xl sequencer (Applied Biosystems, Foster City, CA).
Cell lines and culture
The human cholangiocarcinoma cell line, Mz-ChA-136 was cultured in Delbecco’s modified Eagles’s medium (DMEM) supplemented with 10% fetal bovine serum, penicillin G (100,000 U/L), streptomycin (100 mg/L), and gentamycin (100 mg/L). The CCLP137 cell line, a malignant human cholangiocarcinoma cell line (kindly provided by A.J. Demetris, University of Pittsburgh, PA) was cultured in DMEM supplemented with 10% fetal bovine serum, 2 mM L-glutamine, 50 μg/ml gentamycin, and 10 mM HEPES. H69 cells, immortalized human non-malignant cholangiocytes, were kindly provided by Dr. Doug Jefferson (Tufts University, Boston, MA) and cultured as described previously.38
Immunoblot analysis
The cells were directly lysed for 30 min on ice with lysis buffer [50 mM Tris-HCl (pH 7.4), 1% Nonidet P-40, 0.25% sodium deoxycholate, 150 mM NaCl, 1 mM EDTA, 1 mM PMSF, 1μg/mL aprotinin, 1μg/mL leupeptin, 1μg/mL pepstatin, 1 mM Na3VO4 and 1 mM NaF]. After centrifugation at 13,000 g for 15 min, protein concentrations were measured using Bradford’s reagent (Bio-Rad), and protein was denatured by boiling for 10 min, Protein (25 μg) was loaded onto sodium dodecyl sulfate-polyacrylamide gels for electrophoresis, and then transferred onto nitrocellulose membranes. After blocking with 5% milk in TBST (137 mM NaCl, 25 mM Tris and 1 mM disodium ethylenediaminotetraacetate containing 0.1% Tween-20), the membranes were incubated with primary antibodies at 4°C overnight. After washing with TBST three times (each for 10 min), the membranes were incubated with their corresponding horseradish peroxidase (HRP)-conjugated secondary antibodies at room temperature for 1 hr. After washing with TBST three times (each for 10 min), bound antibodies were visualized using enhanced chemiluminescent substrates (ECL; Amersham, Arlington Heights, IL).
DNA sequencing
Genomic DNA was extracted from the cell line using the Wizard SV genomic DNA purification system (Promega), and amplified by PCR using the primers designed to cover the entire socs-3 gene on chromosome 17q25.3 (GI: 37542591) consisting of 2 exons, 1 intron and 5′- and 3′-franking regions (Table 1). PCR products were electrophoresed on a 1% agarose gel, stained with ethidium bromide, visualized under ultraviolet illumination and purified using a gel extraction kit (Qiagen, Valencia, CA). The purified DNA was sequenced as described above.
Electrophoretic Mobility Shift Assay
Nuclear extract were prepared from confluent cells as follows. Hypotonic swelling and lysis were carried out in the culture dish in lysis buffer (10 mM HEPES, pH 7.9, 10 mM KCl, 0.1 mM EDTA, 0.4% Nonidet P-40, complete protease inhibitors (Roche Diagnostics, Indianna IN), and 0.1 mM DTT), followed immediately by scraping and collection on ice. Nuclei were then pelleted by centrifugation, and resuspended in extraction buffer (20 mM HEPES, 400 mM sodium chloride, 1 mM EDTA, 10% glycerol, complete protease inhibitors, and 0.1 mM DTT). Protein concentration was determined by the Bradford method, and extracts frozen at −80°C until use.
Binding reactions containing 2.5 micrograms of nuclear extract protein were incubated at room temperature for 30 minutes with 0.5 μL of double-stranded STAT-3 oligo (5′ GAT CCT TCT GGG AAT TCC TAG ATC; consensus sequence underlined) which was labeled with the infrared fluorophore, IRDye700 (Li-cor Biosciences, Lincoln NE). The binding reaction was performed in 10 μL final volume, containing 10 mM Tris (pH 7.5), 50 mM KCl, 5 mM magnesium chloride, 1 μg poly(dI-dC), 0.25% Tween-20, 0.05% Nonidet P-40, and 3.5 mM DTT. Cold competitor was the same double-stranded sequence without label (Mayo DNA Synthesis Core Facility, Rochester MN). Samples were separated on 5% polyacrylamide gels in 0.25X Tris-Borate EDTA buffer (32.5 mM Tris, pH 8.3, 11.25 mM Boric Acid, 0.625 mM EDTA). Imaging was done in the gel cassette on the Odyssey Infrared Imaging System (Li-cor Biosciences, Lincoln NE). Control experiments (not shown) confirmed that the binding of the probe was sequence specific as 200-fold molar excess of unlabeled oligo sucessfully competed the band away.
Real-time polymerase chain reaction
Total RNA was extracted from the cells using the Trizol Reagent (Invitrogen, Carlsbad, CA), and was reverse transcribed into cDNA with Moloney leukemia virus reverse transcriptase and random primers (both from Invitrogen). Quantification of the cDNA template was performed with real-time PCR (LightCycler; Roche Molecular Biochemicals, Mannheim, Germany) using SYBR green (Invitrogen) as a fluorophore. PCR primers for human SOCS-3 were listed in Table 1. For an internal control, primers for 18S ribosomal RNA (rRNA) were purchased from Ambion (Austin, TX). After electrophoresis in 2% agarose gel, each expected base pair PCR product was cut out and eluted into Tris-HCl using the gel extraction kit (Qiagen). The concentrations of extracted PCR products (copies/μL) were measured using a spectrophotometer at 260 nm and used to generate standard curves. The inverse linear relationship between copy and cycle numbers was then determined. Each resulting standard curve was then used to calculate the copy number/μL in experimental samples. The relative mRNA expression levels were expressed as a ratio of SOCS-3/18S rRNA (copies/μL) per each sample. All PCR conditions and primers were optimized to produce a single product of the correct bp size expected.
Plasmid transfection
Mz-ChA-1 cells were transfected with 1 mL of OptiMEM-1 medium (GIBCO-BRL, Gaithersburg, MD) containing 6 μL of Plus reagent supplied with Lipofectamine Plus (Invitrogen), 5 μg of human SOCS-3 cDNA subcloned into pcDNA3 vector (Invitrogen) by the use of the BamHI and EcoRI restriction sites (pcDNA3-hSOCS-3)39 and 6 μL of the Lipofectamine reagent (Invitrogen), following the manufacturer’s instructions.
SOCS-3 small interfering RNA treatment
Small interfering RNA (siRNA) complementary to the SOCS-3 gene was designed using custom SMARTPools from Dharmacon (Lafayette, CO).40 H69 cells in 6-well culture plates were transfected with in 1.0 mL OptiMEM-1 medium containing 100 nM SOCS-3 siRNA and 6 μL siPORT Lipid (Ambion, Austin, TX).
Quantitation of apoptosis
After incubation in the presence or absence of 5-aza-2′-deoxycytidine (DAC) for 96 hr, the cells were treated with 2 ng/mL of tumor necrosis factor-related apoptosis-inducing ligand (TRAIL) for 12 hr. Apoptosis was quantitated by assessing the characteristic nuclear changes of apoptosis (i.e., chromatin condensation and nuclear fragmentation) using fluorescence microscopy (Eclipse TE200, Nikon Instruments, Melvile, NY) after DAPI staining at a concentration of 10 μg/mL for 15 min, as previously described.20 Caspase 3/7 activity in cell cultures was measured using the Apo-ONE homogeneous caspase-3/7 assay (Promega) following the manufacturer’s instructions.
Measurement of TRAIL secretion
Mz-ChA-1 cells were additionally incubated for 24 hr in DMEM medium alone following treatment with DAC or vehicle for 96 hr. Supernatants were collected and centrifuged to remove particulate debris. Levels of TRAIL in the supernatants were determined by an enzyme-linked immunosorbent assay (ELISA) using a commercially available kit (R&D Systems, Minneapolis, MN). Cells lysates were prepared from the cells and their protein contents were measured by the Bradford’s method as described above.
Materials
Recombinant human IL-6 and TRAIL were obtained from R&D Systems. The following primary or secondary antibodies were used: polyclonal rabbit anti-c-inhibitor of apoptosis protein 1 (c-IAP-1), anti-c-IAP-2, anti-Mcl-1, anti-survivin, and anti-STAT-3, and polyclonal goat anti-α-actin and anti-SOCS-3 antisera were from Santa Cruz Biotechnology (Santa Cruz, CA); monoclonal mouse anti-TRAIL and anti-TRAIL receptor 1 (TRAIL-R1), polyclonal goat anti-TRAIL-R2 and anti-Fas-associated death domain (FADD) antisera were from Alexis (San Diego, CA); polyclonal rabbit anti-Bcl-2 antibody was from BD Biosciences (San Jose, CA); monoclonal mouse anti-Bcl-XL was from Exalpha Biologicals (Maynard, MA); polyclonal rabbit anti-phosphospecific STAT-3 at Tyr705 antibody was from Cell Signaling Technology (Danvers, MA); HRP-conjugated anti-goat, -rabbit and –mouse immunoglobulins were from Biosource International (Camarillo, CA). DAPI, the demethylation agent, DAC and a histone deacetylase inhibitor, trichostatin A (TSA) were purchased from Sigma Chemical (St Louis, MO).
Statistical analysis
All data represent at least three independent experiments and are expressed as the mean±standard error (SE). Statistical analysis was performed using a two-tailed Student’s t test or chi-square test. A p value of less than 0.05 was accepted as statistically significant.
RESULTS
Is there an inverse relationship between phospho-STAT-3 and SOCS-3 protein expression in human cholangiocarcinoma specimens?
Tyr705 phospho-STAT-3 was identified in 16 of 26 human cholangiocarcinoma specimens by immunohistochemistry (Figure 1 A); the immunoreactivity was identified in the nucleus of the malignant cells consistent with the transcription factor function of this phosphorylated protein. In these specimens with phospho-STAT-3 nuclear immunoreactivity, SOCS-3 immunoreactivity was seen in less than a third of the cells. In contrast, phospho-STAT-3 immunoreactivity was intermediate (n=7) or rare (n=3) in the other 10 specimens and in these cancers, SOCS-3 immunoreactivity was readily observed in 46–62% of cells (Figure 1A and 1B). Thus, in this limited number of human cholangiocarcinoma specimens, there was an inverse relationship between Tyr 705 phospho-STAT-3 and SOCS-3 immunoreactivity.
Figure 1. (A) Inverse correlation between tyrosine705 phosphorylated STAT-3 (P-STAT-3) and SOCS-3 expression in human cholangiocarcinoma (CCA) tissue.


Immnohistochemistry for P-STAT-3 and SOCS-3 was performed using 26 surgically resected human CCA specimens (400X magnification). The percent of cells with cytoplasmic SOCS-3 was assessed, as was the percent of cells with nuclear P-STAT-3 staining. Samples are shown with positive P-STAT-3 (70–100% of cells) with low SOCS-3 staining (<30%), and separately with negative P-STAT-3 (<30%) and high SOCS-3 staining (>70%). (B) Quantitative analysis of SOCS-3 staining versus P-STAT-3 staining. Cells were examined and quantitated for P-STAT-3 nuclear staining and SOCS-3 cytoplasmic staining. At least 500 cells per specimen were counted. Each point represents the average value for one sample. Bars represent the mean SOCS-3 staining for all specimens within each subset of P-STAT-3 staining. (C) DNA methylation of the socs-3 promoter is associated with SOCS-3 silencing. Genomic DNA was extracted from either SOCS-3 (+) or SOCS-3 (−) CCA tissue procured by laser capture microdissection (LCM). Bisulfite-modified DNA was subjected to methylation-specific PCR as described in the Materials and Methods section using either a methylation- (M) or unmethylation- (U) specific primer set for the socs-3 promoter. (D, E) CpG island methylation of the socs-3 promoter is specific for CCA. Genomic DNA was extracted from paired tumor and non-tumor tissue (uninvolved bile duct epithelial cells and hepatocytes) procured by LCM. Cell-type specific genomic DNA was treated with bisulfite, subjected to methylation-specific PCR of the socs-3 promoter region (D) and sequenced (E). A total of 44 CpG sites located between nucleotides -678 and -216 of the socs-3 promoter were sequenced (E). The horizontal squares represent CpG islands while the vertical squares represent the individual 5 clones sequenced. Each black square represents a methylated cytosine residue within the CpG islands.
Is SOCS-3 mutationally inactivated in cholangiocarcinoma specimens?
Given the propensity for tumors to accumulate mutations, we tested whether the SOCS-3 gene was mutated in genomic DNA recovered from laser-capture microdissected (LCM) samples. There were no identified mutations within the entire coding sequence, or in the immediate 5′ and 3′ flanking regions.
Does SOCS-3 CpG island promoter methylation occur in human cholangiocarcinoma?
The SOCS-3 gene sequence appeared intact, so we considered the role of epigenetic silencing of SOCS-3. Genomic DNA was extracted from paired tumor and non-tumor tissue procured by LCM. The cell-type specific genomic DNA was subjected to methylation specific PCR of the socs-3 promoter region, nucletotides -525 to -384. In 7 of the 8 (88%) SOCS-3 negative cancers analyzed, a methylated PCR product was identified (Figure 1C). In contrast, no methylated PCR product was observed in the SOCS-3-expressing cancers (Figure 1C). The methylated PCR product from the SOCS-3-negative tumors was cancer specific as only unmethylated PCR products were observed from paired normal bile duct tissue and hepatocytes (Figure 1D).
Furthermore, a total of 44 CpG sites located between nucleotides -678 and -216 of the socs-3 promoter were examined by bisulfite sequencing. Dense cytosine methylation was observed in the CpG islands of the socs-3 promoter procured from the 7 SOCS-3-negative cancers with the methylated product by MSP. A methylation map of CpG islands from a representative tumor is depicted in Figure 1E. Only sporadic cytosine methylation was identified in genomic DNA obtained form SOCS-3-positive cancers (Figure 1E). Cytosine methylation was rarely observed in non-tumorous bile duct epithelial cells or hepatocytes demonstrating the cytosine methylation of CpG islands was tumor specific when identified (Figure 1E). These data demonstrate the presence of socs-3 promoter CpG island hypermethylation in human cholangiocarcinoma specimens.
Do Mz-ChA-1 cells retain the SOCS-3 promoter methylation pattern observed in a subset of human cholangiocarcinomas?
A cell line was needed to ascertain the functional significance of CpG islands methylation within the socs-3 promoter. Mz-ChA-1 cells were selected as they are a representative well-characterized human cholangiocarcinoma cell line.36 IL-6 failed to induce SOCS-3 expression either at the mRNA or protein level (Figure 2A and B), and, furthermore, IL-6 stimulation resulted in sustained STAT-3 Tyr 705 phosphorylation in these cells (Figure 2A). Consistent with their SOCS-3 negative but sustained phospho-STAT-3 response to IL-6, Mz-ChA-1 cells displayed socs-3 promoter methylation of CpG islands (Figure 3A and B). Finally, the SOCS-3 gene was sequenced in these cells and no mutations were identified.
Figure 2. (A) IL-6-mediated P-STAT-3 is sustained in the Mz-ChA-1 cholangiocarcinoma cells but not in non-malignant H69 cells.

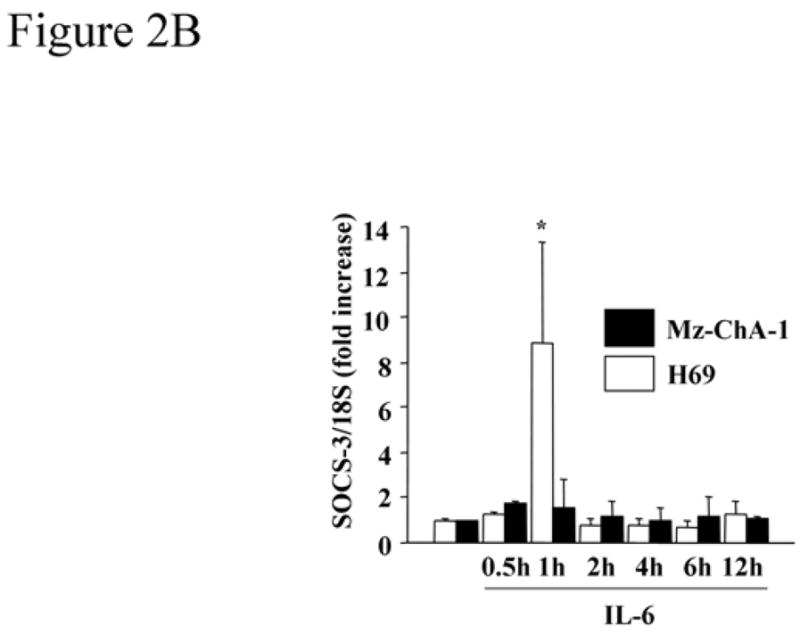
Immunoblot analysis using anti-P-STAT-3 and anti-SOCS-3 antisera was performed using whole cell lysates (25 μg protein per lane) from the human cholangiocarcinoma cell line, Mz-ChA-1, and an immortalized non-malignant human cholangiocyte cell line, H69 cells, following treatment with IL-6 (10 ng/mL). Total cellular levels of STAT-3 and β-actin were also confirmed by immunoblot analysis. (B) IL-6 induces SOCS-3 mRNA expression in H69 cells but not in Mz-ChA-1 cells. At various time points after expose to IL-6 (10 ng/mL), total cellular RNA was isolated from the H69 and Mz-ChA-1 cells. SOCS-3 mRNA expression was quantitated by real-time PCR as described in the Materials and Methods section. The relative expression of SOCS-3 mRNA was expressed as a ratio of SOCS-3/18S rRNA (internal control) copies/μL (n=4). *, p<0.05, versus H69 cells prior to IL-6 exposure.
Figure 3. CpG island methylation within the socs-3 promoter is observed in Mz-ChA-1 but not H69 cells.
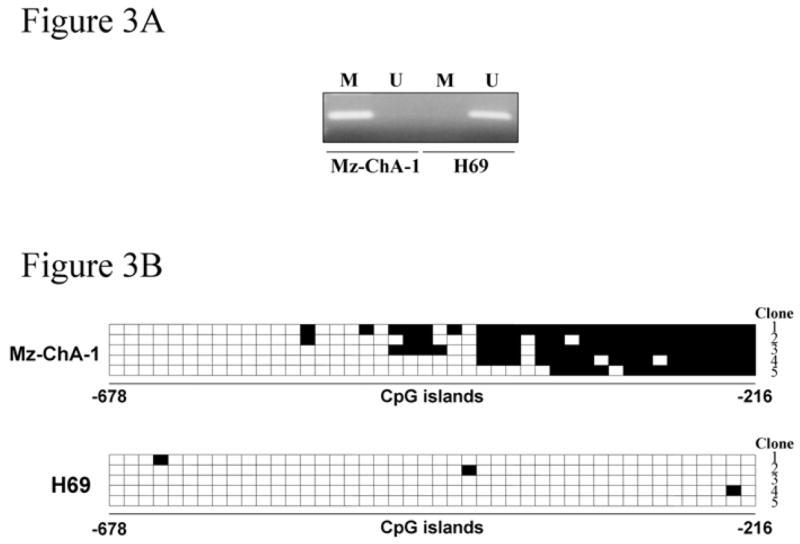
Genomic DNA extracted from the cell lines was treated with bisulfite and then subjected to methylation-specific PCR (A) using the methylated DNA- (M) and unmethylated DNA- (U) specific primer sets. PCR products were sequenced for the 44 CpG sites located between nucleotides -678 and -216 of the socs-3 promoter as described in the Materials and Methods section (B). The horizontal squares represent CpG islands while the vertical squares represent the individual 5 clones sequenced. Each black square represents a methylated cytosine residue within the CpG islands.
In contrast, H69 cells, a transformed nonmalignant human cholangiocyte cell line, responded to IL-6 with transient STAT-3 Tyr 705 phosphorylation and robust SOCS-3 induction (Figure 2A and B); the normal predicted response to IL-6 signaling.18, 23, 41 Only sporadic and minimal socs-3 promoter methylation was observed in the H69 cells (Figure 3A and B). Collectively, these data demonstrate that Mz-ChA-1 cells retain the socs-3 promoter methylation pattern observed in many human cholangiocarcinomas.
Is socs-3 promoter methylation responsible for SOCS-3 silencing
To determine whether socs-3 promoter hypermethylation is responsible for socs-3 gene silencing following IL-6 stimulation, the effects of DAC, a demethylating agent, were examined. Treatment with DAC restored the expression of SOCS-3 protein (Figure 4A) and significantly increased the relative mRNA levels in Mz-ChA-1 cells in a dose-dependent manner following IL-6 treatment (Figure 4B). On the other hand, addition of a histone deacetylases inhibitor, TSA, did not substantially augment the effect of DAC (Figure 4A). To confirm that the observations with DAC were due to demethylation of the socs-3 promoter, methylation specific PCR was performed. Indeed, DAC treatment converted the methylated PCR product to one which was unmethylated (Figure 4C). These observations indicate that the observed socs-3 promoter methylation in Mz-ChA-1 cells was sufficient to silence expression of this gene.
Figure 4. (A) 5-aza-2′-deoxycytidine (DAC) treatment restores IL-6-mediated SOCS-3 protein expression in Mz-ChA-1 cells.

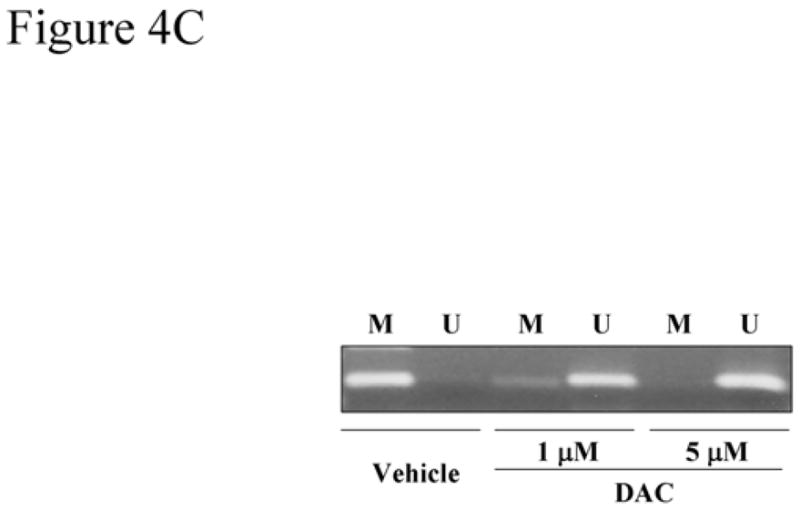
Mz-ChA-1 cells were incubated in the absence or presence of DAC (1 or 5 μM) for 96 hr, followed by treatment with 0.5 μM trichostatin A (TSA) or vehicle for additional 24 hr. Thereafter, the cells were stimulated with IL-6 (10 ng/mL) for 1hr. Immunoblot analysis using anti-P-STAT-3 and anti-SOCS-3 antisera was performed using whole cell lysates (25 μg protein per lane). Total cellular levels of STAT-3 and β-actin were also confirmed by immunoblot analysis. (B) DAC treatment restores IL-6-mediated SOCS-3 mRNA expression in Mz-ChA-1 cells. Mz-ChA-1 cells were incubated in the absence or presence of DAC (1 or 5 μM) for 96 hr, followed by treatment with trichostatin A (TSA) as indicated or vehicle for additional 24 hr. Then, the cells were incubated in the presence of 10 ng/mL of IL-6 for 1hr. Total cellular RNA was isolated. The relative SOCS-3 mRNA expression was quantitated by real-time PCR (n=4). *, p<0.01, **, p<0.05, versus cells treated with vehicle; #, p<0.01 for cells treated with 1 μM DAC with and without TSA; ##, p<0.01 for cells treated with 1 μM DAC alone. (C) DNA methylation of the socs-3 promoter in Mz-ChA-1 cells is reversible by DAC treatment. After treatment with DAC (1 or 5 μM) or vehicle, genomic DNA was extracted from the Mz-ChA-1 cells, treated with bisulfite and subjected to methylation specific PCR using the methylated DNA- (M) and unmethylated DNA- (U) specific primer sets.
Is epigenetic silencing of socs-3 responsible for sustained Tyr 705 phosphorylation of STAT-3?
To examine the relationship between SOCS-3 epigenetic silencing and the sustained phopho-STAT-3, Mz-ChA-1 cells were treated with DAC in the presence and absence of IL-6 (Figure 5A). DAC associated re-expression of SOCS-3 decreased cellular levels of phosphorylated STAT-3 in response to IL-6 and resulted in rapid termination of the sustained IL-6/STAT-3 response observed in the absence of DAC (Figure 5A). Forced expression of SOCS-3 by plasmid transfection also resulted in a rapid termination of the IL-6-initiated STAT-3 Tyr 705 phosphorylation (Figure 5B). Conversely, siRNA targeted silencing of SOCS-3 in the H69 cells enhanced STAT-3 Tyr 705 phosphorylation following exposure to IL-6 (Figure 5C). These observations implicate epigenetic silencing of SOCS-3 as a mechanism responsible for the sustained IL-6-mediated STAT-3 response in cholangiocarcinoma cells.
Figure 5. (A) DAC treatment attenuates the prolonged tyrosine705 STAT-3 phosphorylation in response to IL-6.

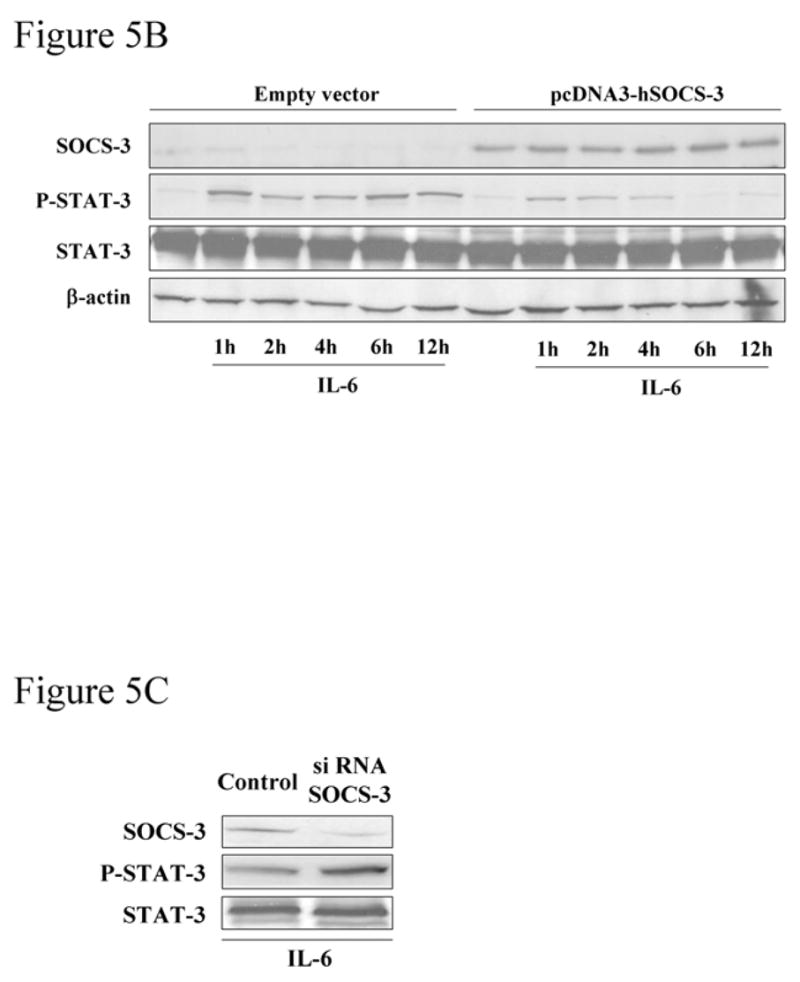
Mz-ChA-1 cells were treated with DAC (5 μM) for 96 hr, followed by stimulation with IL-6 (10 ng/mL). Whole cell lysates (25 μg per lane) were prepared at various time points after exposure to the cytokine and were subjected to immunoblot analysis using anti-P-STAT-3, -SOCS-3, -STAT-3 and -β-actin antisera. (B) Enforced expression of SOCS-3 by socs-3 gene transfection results in rapid termination of the phospho-STAT-3 response upon IL-6 stimulation of Mz-ChA-1 cells. Cells were transfected with pcDNA3-hSOCS-3 or empty vector as described in the Materials and Methods section. The cells were incubated in the presence of IL-6 (10 ng/mL) for 1 to 12 hr. Immunoblot analysis using anti-P-STAT-3 and anti-SOCS-3 antisera was performed using whole cell lysates (25 μg per lane). Total cellular levels of STAT-3 and β-actin were also confirmed by immunoblot analysis. (C) siRNA targeted silencing of SOCS-3 in H69 cells enhances tyrosine705 STAT-3 phosphorylation. H69 cells were transfected with siRNA complementary to the SOCS-3 gene or control small RNA. 48 hr after transfection, cells were incubated with IL-6 (10 ng/mL) for 2hr, whole cell lysates (25 μg per lane) were subjected to immunoblot analysis
Is the SOCS-3 promotor epigenetically silenced in CCLP1 cells?
To confirm that the results above were not cell-line specific, we examined the malignant cholangiocarcinoma cell line CCLP1 for SOCS-3 promoter methylation. CCLP1 cells indeed exhibit SOCS-3 silencing, similar to Mz-ChA-1 cells, as well as human tumor tissue. Specifically, the SOCS-3 promoter was methylated in CCLP1 cells, determined by methylation-specific PCR, and methylation was reversible with DAC treatment (Figure 6A). Further, SOCS-3 expression was not induced by IL-6 treatment unless the cells were pre-treated with DAC (Figure 6B). Consistently, STAT-3 DNA-binding activity as assessed by the electrophoretic mobility shift assay was abnormally sustained in these cells compared to H69 cells unless the CCLP1 cells were DAC-treated (Figure 6C). Thus, we could reproduce our findings in MzChA-1 cells of SOCS-3 silencing by methylation in an additional human cholangiocarcinoma cell line.
Figure 6. (A) The SOCS-3 promoter is methylated in CCLP cells.

Similar to Mz-ChA-1 cells, the SOCS-3 promoter is methylated in CCLP cells, reversible by DAC-treatment (5 μM). (B) DAC restores IL-6-induced SOCS-3 expression in CCLP cells. CCLP cells were untreated or pretreated with 5 μM DAC for 96 hours followed by IL-6 treatment for 0, 1, or 6 hours. IL-6 did not induce SOCS-3 unless the demethylating agent was used. (C) IL-6 triggers sustained STAT-3 activation in CCLP cells while H69 cells or DAC-treated CCLP cells manifest transient STAT-3 activation. Electorphoretic mobility shift assay demonstrates the expected transient STAT-3 activation in H69 cells upon IL-6 treatment (peak at 1 hour). CCLP cells, on the other hand, show sustained STAT-3 activation. Pretreatment for 96 hours with DAC (5 μM) restored the transient activation (peak at 2 hours). Note the kinetics are slightly different between H69 cells and DAC-treated CCLP cells
Does restoration of SOCS-3 expression sensitize Mz-ChA-1 cells to TRAIL-mediated apoptosis?
Cholangiocacinoma cells are resistant to TRAIL cytotoxicity, in part, due to enhanced STAT-3 dependent Mcl-1 expression.18 Therefore, we determined whether SOCS-3 restoration, which should inhibit STAT-3 transduced expression of Mcl-1, sensitizes cholangiocarcinoma cells to TRAIL cytotoxicity. Initially, we assessed the effect of SOCS-3 expression on expression of proteins modulating TRAIL-mediated apoptosis. DAC-mediated restoration of SOCS-3 strongly reduced expression of Mcl-1 and, more modestly Bcl-XL, while expression of the anti-apoptotic proteins survivin, cIAP-1 and -2 were unaffected (Figure 7A). Bcl-2 was undetectable in this cell line using immunoblot analysis, consistent with our previous study (data was not shown).20 Similarly, suppression of SOCS-3 expression in H69 cells by siRNA increased Mcl-1 expression, modestly increased Bcl-XL, and had no effect on survivin, cIAP-1 or -2.
Figure 7. (A) SOCS-3 expression affects Mcl-1 expression.
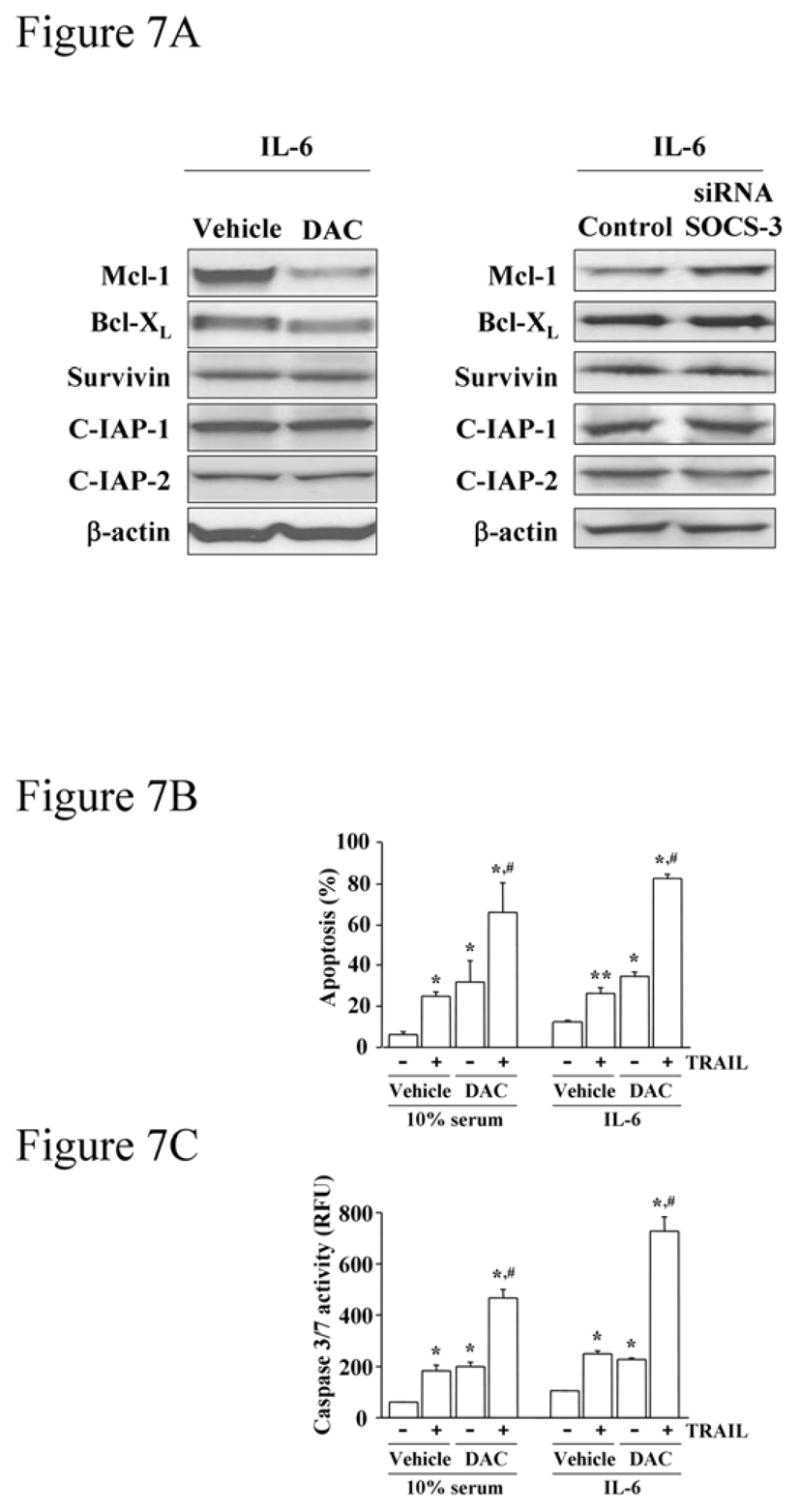
Ninety-six hours after treatment with 5 μM DAC or vehicle, Mz-ChA-1 cells were stimulated with IL-6 (10 ng/mL) for 2 hours. Separately, Mz-ChA-1 cells were transfected with anti-SOCS-3 siRNA for 48 hours, followed by 2 hours of IL-6 treatment. Immunoblot analysis using anti-Mcl-1, -Bcl-XL, -survivin, -C-IAP-1 and -2 and –β-actin antisera was performed using whole cell lysates (25 μg per lane). (B, C) SOCS-3 expression by DAC treatment sensitizes Mz-ChA-1 cells to TRAIL-mediated apoptosis. After 96-hr-treatment with DAC (5 μM) or vehicle, Mz-ChA-1 cells were treated with TRAIL (2 ng/mL) (+) or vehicle (−) in the presence of 10% serum or IL-6 (10 ng/mL) for 12 hr. Apoptosis was quantitated morphologically with DAPI staining under fluorescence microscopy (B) or biochemically by measuring caspase 3/7 activity (C). Data were expressed as percentages of apoptotic cells (B) or relative fluorescence unit (RFU) of caspase 3/7 activity (C) from 3 separate experiments. *, p<0.05, **, p<0.01 versus control group (cells without any treatment incubated either with 10% serum condition or IL-6); #, p<0.01 for cells treated with either DAC or TRAIL alone.
DAC treatment alone induced modest apoptosis in Mz-ChA-1 cells (Figure 7B and 7C). However, incubation with DAC markedly enhanced TRAIL-mediated apoptosis despite simultaneous IL-6 administration (Figure 7B and 7C). The enhanced cell death of DAC-treated cells was not due to alterations in protein levels of the death-inducing signaling complex (DISC) including TRAIL-R1, –R2, caspase 8 and FADD42 (not shown). TRAIL expression in the cholangiocarcinoma cells was not detected by immunoblotting of cell lysates nor by examining the culture media for TRAIL secretion by an ELISA assay. Finally, the enhanced death could be directly attributed to SOCS-3 expression as forced expression of SOCS-3 reduced Mcl-1 protein expression but not that of the other anti-apoptotic proteins (Figure 8A), and enhanced TRAIL cytotoxicity (Figure 8B and 8C). These results indicate that increased SOCS-3 expression, either by demethylation or transfection, reduces cellular Mcl-1 levels and sensitizes the cells to TRAIL-mediated cytotoxicity.
Figure 8. (A) Enforced SOCS-3 expression reduces tyrosine705 phosphorylated STAT-3 and Mcl-1 in Mz-ChA-1 cells.

Following transfection with pcDNA3-hSOCS-3 or empty vector, Mz-ChA-1 cells were incubated with IL-6 (10 ng/mL) for 2 hr. Whole cell lysates (25 μg per lane) were prepared and subjected to immunoblot analysis using anti-P-STAT-3, -SOCS-3, -Mcl-1, -Bcl-XL, -survivin and -C-IAP-1 and -2 antisera. (B, C) Enforced SOCS-3 expression sensitizes Mz-ChA-1 cells to TRAIL-mediated apoptosis. Mz-ChA-1 cells transfected with pcDNA3-hSOCS-3 or empty vector were incubated in the absence (−) or presence (+) of TRAIL for 12 hr. Apoptosis was quantitated morphologically with DAPI staining under fluorescence microscopy (B) or biochemically by measuring caspase 3/7 activity (C). Data were expressed as percentages of apoptotic cells (B) or RFU of caspase 3/7 activity (C) from 3 separate experiments. *, p<0.05, **, p<0.01 for cells transfected with empty vector without TRAIL treatment, #, p<0.01 for TRAIL-treated cells transfected with empty vector or cells transfected with pcDNA3-hSOCS-3 without TRAIL treatment.
DISCUSSION
The principal findings of this study relate to the mechanisms and biological consequences of IL-6-mediated sustained STAT-3 activation in cholangiocarcinoma tissue and cells. The results of the present study demonstrate that: a) there is an inverse relationship between STAT-3 phosphorylation and SOCS-3 expression; b) SOCS-3 silencing is attributable to transcriptional inactivation via CpG island methylation of the socs-3 promoter; and c) reconstitution of SOCS-3 expression reduces the duration and magnitude of IL-6-mediated STAT-3 phosphorylation, decreases cellular Mcl-1 levels, and sensitizes cholangiocarcinoma cells to TRAIL-induced killing. Epigenetic therapy to re-express SOCS-3 may be useful in the therapy of human cholangiocarcinoma.
IL-6 is a pivotal growth and survival factor in human cholangiocarcinoma14–16 and signals, in part, through the JAK1/STAT-3 pathway.18 Normally, this pathway induces expression of SOCS-3 which turns off IL-6 signaling through its recruitment to Tyr759 of gp130, where it blocks JAK1 activation.23–25 Our study suggests this feed back loop is inactivated in a subset of human cholangiocarcinomas. For example, immunohistochemical analysis demonstrated constitutive nuclear Tyr705 phosphorylated STAT-3 in about 62% of human cholangiocarcinoma specimens examined whereas SOCS-3 expression was very low (present in less than a third of cells) in these cancers. We found no mutations when the socs-3 gene from these cancers was sequenced, but rather extensive promoter CpG island methylation, suggesting epigenetic silencing of this gene. Mechanistic evidence for epigenetic silencing was obtained in both the Mz-ChA-1 and CCLP1 cell lines where the demethylating agent DAC restored SOCS-3 expression and terminated the otherwise sustained Tyr705 phospho-STAT-3 response to IL-6 stimulation. Epigenetic silencing of SOCS-3, therefore, permits constitutive IL-6/STAT-3 signaling in human cholangiocarcinoma allowing this cytokine to participate in the genesis and progression of human cholangiocarcinoma. Along these lines, epigenetic silencing of SOCS-3 has also been described in human lung cancer,30 head and neck cancers,31 and hepatocellular cancer.32 Thus, epigenetic silencing of SOCS-3 is likely a critical mechanism in cancer biology allowing the cancer to utilize the inflammatory cytokine as survival and growth factor.
While human tumor samples manifested an inverse relationship between activated STAT-3 and SOCS-3 expression, the two cancer cell lines used did not demonstrate high levels of either STAT-3 activation or SOCS-3 expression. This may reflect the environment of the tumor (ongoing inflammation) versus the relatively quiescent conditions of cell culture. The inflammatory environment of the tumor demands ongoing signaling (phospho-STAT-3) or suppression of that signaling (SOCS-3 expression) due to the constant stimulation by cytokines. The cell line is obviously not in an inflammatory environment, but upon stimulation with IL-6 does manifest the same signaling patterns as observed in the human cholangiocarcinoma specimens. Therefore, the cell line appears to recapitulate the signaling events observed in the human cancers as related to IL-6 signaling.
The mechanism for SOCS-3 CpG island promoter methylation was not examined in these studies. Inflammation and, in particular IL-6 itself, has been associated with epigenetic silencing of genes through CpG island hypermethylation.43–45 For example, the promoter region of p53 has been shown to be epigenetically modified by methyltransferases, resulting in decreased levels of expression.46, 47 Multiple myeloma cells treated with IL-6 exhibit an increase in the expression of the DNA maintenance methylation enzyme, DNMT-1 with silencing of p53 expression.44 Therefore, it appears that IL-6 is capable of maintaining promoter methylation thus representing one of the possible mechanisms used by inflammatory mediators in the growth and survival of tumors. The mechanisms responsible for socs-3 promoter methylation will require further study, especially the potential role of inflammatory cytokines such as IL-6.
Consistent with the molecular heterogeneity of human cancers, 16 of 26 examined human cholangiocarcinoma specimens displayed constitutive STAT-3 activation and silencing of SOCS-3 (present in less than 1 in 3 cells); three tumors manifested SOCS-3 expression and as expected no Tyr705 phosphorylation of STAT-3. The remaining samples were intermediate for both P-STAT-3 and SOCS-3. This does not exclude a role for IL-6 in the SOCS-3 positive cancers, as this cytokine also signals by activation of the mitogen activated protein kinase family including p38 and p42/44, and also by the phosphatidylinositol-3 kinase/Akt pathway.25, 48, 49 These pathways have also been demonstrated to be important in human cholangiocarcinoma, especially expression of the anti-apoptotic protein Mcl-1.19, 50, 51 Therefore, cholangiocarcinomas may use different IL-6 signaling pathways to achieve the same phenotype, namely apoptosis resistance.
We have recently demonstrated that human cholangiocarcinomas paradoxically express the death ligand TRAIL.52 Indeed, TRAIL promotes an invasive phenotype in these cancers. Cholangiocarcinomas are resistant to TRAIL-mediated apoptosis due to enhanced expression Mcl-1,20 and, therefore, Mcl-1 appears to be a master switch determining whether these cancers live or die. IL-6/JAK1 mediated STAT-3 activation is one mechanism by which Mcl-1 is upregulated in these cancers.18 Indeed, we have recently demonstrated a STAT-3 response element in the Mcl-1 human promoter.18 Consistent with these data, the demethylating agent DAC, which restores SOCS-3 expression and inhibits IL-6 prolonged STAT-3 activation, reduced Mcl-1 protein expression. The DAC reduction of Mcl-1 expression was associated with sensitization to TRAIL-cytotoxicity. Although DAC has been shown to sensitize cells to apoptosis by multiple mechanisms,34, 53–55 we did not observe a significant change in other apoptosis modulators in our current study. While Bcl-XL, cIAP, and survivin can be regulated by STAT-3 activation in some conditions, we do not find their expression dominantly tied to STAT-3 signaling in cholangiocarcinoma cells. Presumably, the dominant regulation of their expression in cholangiocarcinoma cells is via other transcription factors, but this was not examined in the present study. Collectively, our current observations suggest SOCS-3 re-expression can sensitize cholangiocarcinoma cells to TRAIL cytotoxicity by turning off IL-6/STAT-3 signaling cascades resulting in Mcl-1 downregulation.
In conclusion, the present study demonstrates that IL-6-mediated sustained STAT-3 activation in human cholangiocarcinoma is likely due to SOCS-3 epigenetic silencing via hypermethylation of CpG islands within its promoter region. SOCS-3 re-expression by demethylating agent or socs-3 gene transfer reduces STAT-3 activation and expression of its target gene Mcl-1. This reduction in Mcl-1 sensitizes cholangiocarcinoma cells to TRAIL-induced cytotoxicity. These findings highlight SOCS-3 as a pivotal negative regulator of the IL-6/STAT-3 pathway and provide new perspectives for epigenetic therapy to restore SOCS-3 in this cancer. Indeed, as a variety of nucleoside and non-nucleoside DNA-methylation inhibitors have been developed for cancer therapy,56, 57 the use of these agents in the treatment of cholangiocarcinoma merits further study.
Acknowledgments
This work was supported by National Institutes of Health grant DK 59427 (GJG) and the Mayo and Palumbo Foundations (GJG).
The secretarial assistance of Erin Bungum is gratefully acknowledged. We thank Mr. Anthony J. Blahnik for excellent technical support on LCM.
Abbreviations
- c-IAP
c-inhibitor of apoptosis protein
- DAC
5-aza-2′-deoxycytidine
- DAPI
4′, 6′-diamidino-2-phenylindole
- DISC
death-inducing signaling complex
- FADD
Fas-associated death domain
- HEPES
N-(2-hydroxyethyl)-piperazine-N’-2-ethanesulfonic acid
- HRP
horseradish peroxidase
- IL-6
interleukin 6
- JAK
Janus kinase
- LCM
laser capture microdissection
- Mcl-1
myeloid cell leukemia 1
- MSP
methylation-specific PCR
- siRNA
small interfering RNA
- STAT
signal transducers and activators of transcription
- SOCS
suppressor of cytokine signaling
- TRAIL
tumor necrosis factor-related apoptosis-inducing ligand
- TSA
trichostatin A
Footnotes
Publisher's Disclaimer: This is a PDF file of an unedited manuscript that has been accepted for publication. As a service to our customers we are providing this early version of the manuscript. The manuscript will undergo copyediting, typesetting, and review of the resulting proof before it is published in its final citable form. Please note that during the production process errors may be discovered which could affect the content, and all legal disclaimers that apply to the journal pertain.
References
- 1.Gores GJ. Cholangiocarcinoma: current concepts and insights. Hepatology. 2003;37:961–9. doi: 10.1053/jhep.2003.50200. [DOI] [PubMed] [Google Scholar]
- 2.Bergquist A, Ekbom A, Olsson R, Kornfeldt D, Loof L, Danielsson A, Hultcrantz R, Lindgren S, Prytz H, Sandberg-Gertzen H, Almer S, Granath F, Broome U. Hepatic and extrahepatic malignancies in primary sclerosing cholangitis. J Hepatol. 2002;36:321–7. doi: 10.1016/s0168-8278(01)00288-4. [DOI] [PubMed] [Google Scholar]
- 3.Tocchi A, Mazzoni G, Liotta G, Lepre L, Cassini D, Miccini M. Late development of bile duct cancer in patients who had biliary-enteric drainage for benign disease: a follow-up study of more than 1,000 patients. Ann Surg. 2001;234:210–4. doi: 10.1097/00000658-200108000-00011. [DOI] [PMC free article] [PubMed] [Google Scholar]
- 4.Lazaridis KN, Gores GJ. Cholangiocarcinoma. Gastroenterology. 2005;128:1655–67. doi: 10.1053/j.gastro.2005.03.040. [DOI] [PubMed] [Google Scholar]
- 5.Garcea G, Dennison AR, Steward WP, Berry DP. Role of inflammation in pancreatic carcinogenesis and the implications for future therapy. Pancreatology. 2005;5:514–29. doi: 10.1159/000087493. [DOI] [PubMed] [Google Scholar]
- 6.Peek RM, Jr, Crabtree JE. Helicobacter infection and gastric neoplasia. J Pathol. 2006;208:233–48. doi: 10.1002/path.1868. [DOI] [PubMed] [Google Scholar]
- 7.Itzkowitz SH, Yio X. Inflammation and cancer IV. Colorectal cancer in inflammatory bowel disease: the role of inflammation. Am J Physiol Gastrointest Liver Physiol. 2004;287:G7–17. doi: 10.1152/ajpgi.00079.2004. [DOI] [PubMed] [Google Scholar]
- 8.Coussens LM, Werb Z. Inflammation and cancer. Nature. 2002;420:860–7. doi: 10.1038/nature01322. [DOI] [PMC free article] [PubMed] [Google Scholar]
- 9.Sirica AE. Cholangiocarcinoma: molecular targeting strategies for chemoprevention and therapy. Hepatology. 2005;41:5–15. doi: 10.1002/hep.20537. [DOI] [PubMed] [Google Scholar]
- 10.Nakanuma Y, Harada K, Ishikawa A, Zen Y, Sasaki M. Anatomic and molecular pathology of intrahepatic cholangiocarcinoma. J Hepatobiliary Pancreat Surg. 2003;10:265–81. doi: 10.1007/s00534-002-0729-3. [DOI] [PubMed] [Google Scholar]
- 11.Hideshima T, Podar K, Chauhan D, Anderson KC. Cytokines and signal transduction. Best Pract Res Clin Haematol. 2005;18:509–24. doi: 10.1016/j.beha.2005.01.003. [DOI] [PubMed] [Google Scholar]
- 12.Dranoff G. Cytokines in cancer pathogenesis and cancer therapy. Nat Rev Cancer. 2004;4:11–22. doi: 10.1038/nrc1252. [DOI] [PubMed] [Google Scholar]
- 13.Goydos JS, Brumfield AM, Frezza E, Booth A, Lotze MT, Carty SE. Marked elevation of serum interleukin-6 in patients with cholangiocarcinoma: validation of utility as a clinical marker. Ann Surg. 1998;227:398–404. doi: 10.1097/00000658-199803000-00012. [DOI] [PMC free article] [PubMed] [Google Scholar]
- 14.Park J, Tadlock L, Gores GJ, Patel T. Inhibition of interleukin 6-mediated mitogen-activated protein kinase activation attenuates growth of a cholangiocarcinoma cell line. Hepatology. 1999;30:1128–33. doi: 10.1002/hep.510300522. [DOI] [PubMed] [Google Scholar]
- 15.Okada K, Shimizu Y, Nambu S, Higuchi K, Watanabe A. Interleukin-6 functions as an autocrine growth factor in a cholangiocarcinoma cell line. J Gastroenterol Hepatol. 1994;9:462–7. doi: 10.1111/j.1440-1746.1994.tb01275.x. [DOI] [PubMed] [Google Scholar]
- 16.Sugawara H, Yasoshima M, Katayanagi K, Kono N, Watanabe Y, Harada K, Nakanuma Y. Relationship between interleukin-6 and proliferation and differentiation in cholangiocarcinoma. Histopathology. 1998;33:145–53. doi: 10.1046/j.1365-2559.1998.00445.x. [DOI] [PubMed] [Google Scholar]
- 17.Hodge DR, Hurt EM, Farrar WL. The role of IL-6 and STAT3 in inflammation and cancer. Eur J Cancer. 2005;41:2502–12. doi: 10.1016/j.ejca.2005.08.016. [DOI] [PubMed] [Google Scholar]
- 18.Isomoto H, Kobayashi S, Werneburg NW, Bronk SF, Guicciardi ME, Frank DA, Gores GJ. Interleukin 6 upregulates myeloid cell leukemia-1 expression through a STAT3 pathway in cholangiocarcinoma cells. Hepatology. 2005;42:1329–38. doi: 10.1002/hep.20966. [DOI] [PubMed] [Google Scholar]
- 19.Kobayashi S, Werneburg NW, Bronk SF, Kaufmann SH, Gores GJ. Interleukin-6 contributes to Mcl-1 up-regulation and TRAIL resistance via an Akt-signaling pathway in cholangiocarcinoma cells. Gastroenterology. 2005;128:2054–65. doi: 10.1053/j.gastro.2005.03.010. [DOI] [PubMed] [Google Scholar]
- 20.Taniai M, Grambihler A, Higuchi H, Werneburg N, Bronk SF, Farrugia DJ, Kaufmann SH, Gores GJ. Mcl-1 mediates tumor necrosis factor-related apoptosis-inducing ligand resistance in human cholangiocarcinoma cells. Cancer Res. 2004;64:3517–24. doi: 10.1158/0008-5472.CAN-03-2770. [DOI] [PubMed] [Google Scholar]
- 21.Trikha M, Corringham R, Klein B, Rossi JF. Targeted anti-interleukin-6 monoclonal antibody therapy for cancer: a review of the rationale and clinical evidence. Clin Cancer Res. 2003;9:4653–65. [PMC free article] [PubMed] [Google Scholar]
- 22.Almasan A, Ashkenazi A. Apo2L/TRAIL: apoptosis signaling, biology, and potential for cancer therapy. Cytokine Growth Factor Rev. 2003;14:337–48. doi: 10.1016/s1359-6101(03)00029-7. [DOI] [PubMed] [Google Scholar]
- 23.Greenhalgh CJ, Miller ME, Hilton DJ, Lund PK. Suppressors of cytokine signaling: Relevance to gastrointestinal function and disease. Gastroenterology. 2002;123:2064–81. doi: 10.1053/gast.2002.37068. [DOI] [PubMed] [Google Scholar]
- 24.Kubo M, Hanada T, Yoshimura A. Suppressors of cytokine signaling and immunity. Nat Immunol. 2003;4:1169–76. doi: 10.1038/ni1012. [DOI] [PubMed] [Google Scholar]
- 25.Heinrich PC, Behrmann I, Haan S, Hermanns HM, Muller-Newen G, Schaper F. Principles of interleukin (IL)-6-type cytokine signalling and its regulation. Biochem J. 2003;374:1–20. doi: 10.1042/BJ20030407. [DOI] [PMC free article] [PubMed] [Google Scholar]
- 26.Croker BA, Krebs DL, Zhang JG, Wormald S, Willson TA, Stanley EG, Robb L, Greenhalgh CJ, Forster I, Clausen BE, Nicola NA, Metcalf D, Hilton DJ, Roberts AW, Alexander WS. SOCS3 negatively regulates IL-6 signaling in vivo. Nat Immunol. 2003;4:540–5. doi: 10.1038/ni931. [DOI] [PubMed] [Google Scholar]
- 27.Lang R, Pauleau AL, Parganas E, Takahashi Y, Mages J, Ihle JN, Rutschman R, Murray PJ. SOCS3 regulates the plasticity of gp130 signaling. Nat Immunol. 2003;4:546–50. doi: 10.1038/ni932. [DOI] [PubMed] [Google Scholar]
- 28.Schmitz J, Weissenbach M, Haan S, Heinrich PC, Schaper F. SOCS3 Exerts Its Inhibitory Function on Interleukin-6 Signal Transduction through the SHP2 Recruitment Site of gp130. J Biol Chem. 2000;275:12848–12856. doi: 10.1074/jbc.275.17.12848. [DOI] [PubMed] [Google Scholar]
- 29.Takai D, Jones PA. The CpG island searcher: a new WWW resource. In Silico Biol. 2003;3:235–40. [PubMed] [Google Scholar]
- 30.He B, You L, Uematsu K, Zang K, Xu Z, Lee AY, Costello JF, McCormick F, Jablons DM. SOCS-3 is frequently silenced by hypermethylation and suppresses cell growth in human lung cancer. Proc Natl Acad Sci U S A. 2003;100:14133–8. doi: 10.1073/pnas.2232790100. [DOI] [PMC free article] [PubMed] [Google Scholar]
- 31.Weber A, Hengge UR, Bardenheuer W, Tischoff I, Sommerer F, Markwarth A, Dietz A, Wittekind C, Tannapfel A. SOCS-3 is frequently methylated in head and neck squamous cell carcinoma and its precursor lesions and causes growth inhibition. Oncogene. 2005;24:6699–708. doi: 10.1038/sj.onc.1208818. [DOI] [PubMed] [Google Scholar]
- 32.Niwa Y, Kanda H, Shikauchi Y, Saiura A, Matsubara K, Kitagawa T, Yamamoto J, Kubo T, Yoshikawa H. Methylation silencing of SOCS-3 promotes cell growth and migration by enhancing JAK/STAT and FAK signalings in human hepatocellular carcinoma. Oncogene. 2005;24:6406–17. doi: 10.1038/sj.onc.1208788. [DOI] [PubMed] [Google Scholar]
- 33.Rashid A, Issa JP. CpG island methylation in gastroenterologic neoplasia: a maturing field. Gastroenterology. 2004;127:1578–88. doi: 10.1053/j.gastro.2004.09.007. [DOI] [PubMed] [Google Scholar]
- 34.Herman JG, Baylin SB. Gene silencing in cancer in association with promoter hypermethylation. N Engl J Med. 2003;349:2042–54. doi: 10.1056/NEJMra023075. [DOI] [PubMed] [Google Scholar]
- 35.Herman JG, Graff JR, Myohanen S, Nelkin BD, Baylin SB. Methylation-specific PCR: a novel PCR assay for methylation status of CpG islands. Proc Natl Acad Sci U S A. 1996;93:9821–6. doi: 10.1073/pnas.93.18.9821. [DOI] [PMC free article] [PubMed] [Google Scholar]
- 36.Knuth A, Gabbert H, Dippold W, Klein O, Sachsse W, Bitter-Suermann D, Prellwitz W, Meyer zum Buschenfelde KH. Biliary adenocarcinoma. Characterisation of three new human tumor cell lines. J Hepatol. 1985;1:579–96. doi: 10.1016/s0168-8278(85)80002-7. [DOI] [PubMed] [Google Scholar]
- 37.Shimizu Y, Demetris AJ, Gollin SM, Storto PD, Bedford HM, Altarac S, Iwatsuki S, Herberman RB, Whiteside TL. Two new human cholangiocarcinoma cell lines and their cytogenetics and responses to growth factors, hormones, cytokines or immunologic effector cells. Int J Cancer. 1992;52:252–60. doi: 10.1002/ijc.2910520217. [DOI] [PubMed] [Google Scholar]
- 38.Park J, Gores GJ, Patel T. Lipopolysaccharide induces cholangiocyte proliferation via an interleukin-6-mediated activation of p44/p42 mitogen-activated protein kinase. Hepatology. 1999;29:1037–43. doi: 10.1002/hep.510290423. [DOI] [PubMed] [Google Scholar]
- 39.Hortner M, Nielsch U, Mayr LM, Heinrich PC, Haan S. A new high affinity binding site for suppressor of cytokine signaling-3 on the erythropoietin receptor. Eur J Biochem. 2002;269:2516–26. doi: 10.1046/j.1432-1033.2002.02916.x. [DOI] [PubMed] [Google Scholar]
- 40.Dunn SL, Bjornholm M, Bates SH, Chen Z, Seifert M, Myers MG., Jr Feedback inhibition of leptin receptor/Jak2 signaling via Tyr1138 of the leptin receptor and suppressor of cytokine signaling 3. Mol Endocrinol. 2005;19:925–38. doi: 10.1210/me.2004-0353. [DOI] [PubMed] [Google Scholar]
- 41.Hamanaka I, Saito Y, Yasukawa H, Kishimoto I, Kuwahara K, Miyamoto Y, Harada M, Ogawa E, Kajiyama N, Takahashi N, Izumi T, Kawakami R, Masuda I, Yoshimura A, Nakao K. Induction of JAB/SOCS-1/SSI-1 and CIS3/SOCS-3/SSI-3 is involved in gp130 resistance in cardiovascular system in rat treated with cardiotrophin-1 in vivo. Circ Res. 2001;88:727–32. doi: 10.1161/hh0701.088512. [DOI] [PubMed] [Google Scholar]
- 42.Park SM, Schickel R, Peter ME. Nonapoptotic functions of FADD-binding death receptors and their signaling molecules. Curr Opin Cell Biol. 2005;17:610–6. doi: 10.1016/j.ceb.2005.09.010. [DOI] [PubMed] [Google Scholar]
- 43.Toyota M, Issa JP. Epigenetic changes in solid and hematopoietic tumors. Semin Oncol. 2005;32:521–30. doi: 10.1053/j.seminoncol.2005.07.003. [DOI] [PubMed] [Google Scholar]
- 44.Kang GH, Lee HJ, Hwang KS, Lee S, Kim JH, Kim JS. Aberrant CpG island hypermethylation of chronic gastritis, in relation to aging, gender, intestinal metaplasia, and chronic inflammation. Am J Pathol. 2003;163:1551–6. doi: 10.1016/S0002-9440(10)63511-0. [DOI] [PMC free article] [PubMed] [Google Scholar]
- 45.Hodge DR, Xiao W, Clausen PA, Heidecker G, Szyf M, Farrar WL. Interleukin-6 regulation of the human DNA methyltransferase (HDNMT) gene in human erythroleukemia cells. J Biol Chem. 2001;276:39508–11. doi: 10.1074/jbc.C100343200. [DOI] [PubMed] [Google Scholar]
- 46.Hodge DR, Peng B, Cherry JC, Hurt EM, Fox SD, Kelley JA, Munroe DJ, Farrar WL. Interleukin 6 supports the maintenance of p53 tumor suppressor gene promoter methylation. Cancer Res. 2005;65:4673–82. doi: 10.1158/0008-5472.CAN-04-3589. [DOI] [PubMed] [Google Scholar]
- 47.Agirre X, Novo FJ, Calasanz MJ, Larrayoz MJ, Lahortiga I, Valganon M, Garcia-Delgado M, Vizmanos JL. TP53 is frequently altered by methylation, mutation, and/or deletion in acute lymphoblastic leukaemia. Mol Carcinog. 2003;38:201–8. doi: 10.1002/mc.10159. [DOI] [PubMed] [Google Scholar]
- 48.Culig Z, Steiner H, Bartsch G, Hobisch A. Interleukin-6 regulation of prostate cancer cell growth. J Cell Biochem. 2005;95:497–505. doi: 10.1002/jcb.20477. [DOI] [PubMed] [Google Scholar]
- 49.Zhan M, Han ZC. Phosphatidylinositide 3-kinase/AKT in radiation responses. Histol Histopathol. 2004;19:915–23. doi: 10.14670/HH-19.915. [DOI] [PubMed] [Google Scholar]
- 50.Yoon JH, Werneburg NW, Higuchi H, Canbay AE, Kaufmann SH, Akgul C, Edwards SW, Gores GJ. Bile acids inhibit Mcl-1 protein turnover via an epidermal growth factor receptor/Raf-1-dependent mechanism. Cancer Res. 2002;62:6500–5. [PubMed] [Google Scholar]
- 51.Meng F, Yamagiwa Y, Ueno Y, Patel T. Over-expression of interleukin-6 enhances cell survival and transformed cell growth in human malignant cholangiocytes. J Hepatol. 2006;44:1055–65. doi: 10.1016/j.jhep.2005.10.030. [DOI] [PMC free article] [PubMed] [Google Scholar]
- 52.Ishimura N, Isomoto H, Bronk SF, Gores GJ. Trail induces cell migration and invasion in apoptosis-resistant cholangiocarcinoma cells. Am J Physiol Gastrointest Liver Physiol. 2006;290:G129–36. doi: 10.1152/ajpgi.00242.2005. [DOI] [PubMed] [Google Scholar]
- 53.Eramo A, Pallini R, Lotti F, Sette G, Patti M, Bartucci M, Ricci-Vitiani L, Signore M, Stassi G, Larocca LM, Crino L, Peschle C, De Maria R. Inhibition of DNA methylation sensitizes glioblastoma for tumor necrosis factor-related apoptosis-inducing ligand-mediated destruction. Cancer Res. 2005;65:11469–77. doi: 10.1158/0008-5472.CAN-05-1724. [DOI] [PubMed] [Google Scholar]
- 54.Horak P, Pils D, Haller G, Pribill I, Roessler M, Tomek S, Horvat R, Zeillinger R, Zielinski C, Krainer M. Contribution of epigenetic silencing of tumor necrosis factor-related apoptosis inducing ligand receptor 1 (DR4) to TRAIL resistance and ovarian cancer. Mol Cancer Res. 2005;3:335–43. doi: 10.1158/1541-7786.MCR-04-0136. [DOI] [PubMed] [Google Scholar]
- 55.Fulda S, Kufer MU, Meyer E, van Valen F, Dockhorn-Dworniczak B, Debatin KM. Sensitization for death receptor- or drug-induced apoptosis by re-expression of caspase-8 through demethylation or gene transfer. Oncogene. 2001;20:5865–77. doi: 10.1038/sj.onc.1204750. [DOI] [PubMed] [Google Scholar]
- 56.Lyko F, Brown R. DNA methyltransferase inhibitors and the development of epigenetic cancer therapies. J Natl Cancer Inst. 2005;97:1498–506. doi: 10.1093/jnci/dji311. [DOI] [PubMed] [Google Scholar]
- 57.Yoo CB, Jones PA. Epigenetic therapy of cancer: past, present and future. Nat Rev Drug Discov. 2006;5:37–50. doi: 10.1038/nrd1930. [DOI] [PubMed] [Google Scholar]