

Abstract
Terminal erythroid differentiation in mammals is the process whereby nucleated precursor cells accumulate erythroid-specific proteins, such as hemoglobin, undergo extensive cellular and nuclear remodeling, and ultimately shed their nuclei to form reticulocytes, which then become mature erythrocytes in the circulation. Little is known about the mechanisms that enable erythroblasts to undergo such a transformation. We hypothesized that genes involved in these mechanisms were likely expressed at restricted times during the differentiation process and used differential display reverse transcriptase polymerase chain reaction (DDRT-PCR) as a first step in identifying such genes. We identified 3 differentially expressed genes that we termed late erythroblast (LEB) 1-3. None of these genes were previously identified as being expressed in erythroblasts and their pattern of expression indicated they are likely to be involved in the differentiation process. LEB-1, which shares homology with members of the apolipoprotein L family in humans, and LEB-3 represented novel genes with no known function, whereas LEB-2 corresponded to ranBP16, a nuclear exportin. LEB-3 mRNA was also strongly expressed in the testis and was localized to a region of the seminiferous tubule where secondary spermatocytes and early spermatids are found, suggesting a role for LEB-3 in spermatogenesis as well as terminal erythroid differentiation. We have thus identified three genes not previously described as being expressed in erythroblasts that could be relevant in elucidating mechanisms involved in terminal erythroid differentiation.
Introduction
The process by which immature precursor cells become erythrocytes in mammals is known as terminal erythroid differentiation. Mammalian erythrocytes are unique among vertebrates in that they typically shed their nuclei and undergo a dramatic shape change to become fully functional erythrocytes. Early studies in the field largely involved descriptions of the differentiation process at the light and electron microscopic levels [reviewed in 1], whereas later studies included biochemical analyses of the structure of the erythrocyte membrane and membrane cytoskeleton [2-9]. The growth factors involved in regulation of the process, such as erythropoietin (EPO), have been studied in great detail [reviewed in 10]. Studies of transcription factors, such as GATA-1, have yielded in many insights into the global control of erythroid-specific genes and the regulation of erythroid terminal differentiation [reviewed in 11]. Such studies have resulted in a better understanding of the functions of the components of the mature erythrocyte, the mechanisms of action of the growth factors, and of a number human diseases involving abnormalities of one or more of the components of the mature erythrocyte. In spite of the many advances in understanding the function of the mature erythrocyte and EPO control of the process of erythropoiesis, little has been learned about a number of the fundamental processes involved in terminal erythroid differentiation.
The terminal differentiation of mammalian definitive erythroblasts is characterized by a number of distinct processes. These processes include the condensation and transcriptional inactivation of chromatin, accumulation of erythroid-specific proteins in the cytoplasm and membrane skeleton, degradation of proteins and organelles not found in the mature erythrocyte, nuclear extrusion and membrane skeletal remodeling. Little is known about how many of these processes occur, but a number of them are likely to involve gene products expressed at restricted times in the differentiation process. Elucidation of mechanisms involved in the processes would be greatly enhanced by the identification of such genes.
The cell model used in this study involves erythroblasts isolated from the spleens of mice infected by the anemia-inducing strain of the Friend leukemia virus (FVA cells) [12]. FVA cells can be isolated at a stage of differentiation that approximates proerythroblasts. The very large majority of FVA cells mature into reticulocytes within a 48 - 72 hour period when they are cultured the presence of physiological concentrations of the hormone EPO. FVA cells exhibit all of the in vivo characteristics of maturing erythroblasts and have been used successfully in many studies of erythroid terminal differentiation and apoptosis [3,13-26], where findings in FVA cells have translated well to uninfected murine and human erythroblasts. FVA cells have also recently been used to identify a number of reported cytoplasmic factors, called erythroid differentiation denucleation factors, that mediate events late in terminal differentiation [27].
This manuscript describes our initial characterization of 3 genes not previously known to be preferentially expressed at the most terminal stages of erythroid differentiation. Two of the three represent hypothetical genes identified through sequencing of the mouse genome that have no known function, while the third encodes a protein (ranBP16 or Expo7) [28,29] that is involved in trafficking molecules out of the nucleus.
Results and Discussion
DDRT-PCR
Complementary DNA fragments representing mRNAs that were expressed at higher levels in the late stages of terminal erythroid differentiation were identified by DDRT-PCR using an anchor primer with the sequence 5′-dT11CA in combination with 12 different arbitrary primers (data not shown). Differentially expressed cDNA fragments were successfully isolated from 6% acrylamide/urea sequencing gels and reamplified with appropriate combinations of anchor and arbitrary primers. Three of the cDNAs, initially referred to as Late Erythroblast (LEB) 1 –3, that appeared to be the most highly induced were cloned and sequenced to determine their identity. The sizes of the LEB cDNA fragments were as follows: LEB-1, 160 bp; LEB-2, 225 bp; and LEB-3, 208 bp. Northern blot analyses using these radio-labeled clones as probes confirmed that the mRNAs of all 3 were more highly expressed in FVA cells at the most terminal stages of their differentiation. The LEB-1 probe hybridized to an mRNA of approximately 2.3 kb in size, while probes specific for LEB-2 and LEB-3 hybridized to large mRNAs in excess of 4 kb in size (not shown). Larger clones were then obtained for LEB-1, LEB-2 and LEB-3 using 5′-RACE.
LEB-1
An apparent full-length 2.3 kb LEB-1 cDNA was isolated by 5′-RACE (GenBank accession no. AY662646). Initial sequence analyses of the LEB-1 clone, prior to the complete sequencing of the mouse genome, indicated that it was a novel cDNA. We could not, however, identify a long open reading frame in the sequence, suggesting it might contain intronic sequences or that the LEB-1 clone was not a full-length cDNA. When this clone was labeled and used as a probe on northern blots of FVA cells and a variety of other mouse tissues, a transcript was identified of the same size as that detected with the DDRT-PCR probe. The transcript was strongly expressed in FVA cells and also detected in normal mouse spleen after a prolonged exposure (Figure 1 A). An apparently related transcript of significantly greater size was found in small and large intestine (Lanes LI and SI in Figure 1A). A region on mouse chromosome 15 D3 was found to contain several predicted genes with significant homology to LEB-1 when the LEB-1 cDNA sequence was subjected to BLAST analysis with the completed mouse genome database. A 2262 bp region of the LEB-1 cDNA exhibited greater than 98% homology with the 4 exons of a gene predicted in this region (GenBank accession no. A330102K04Rik) A330102K04Rik shares similarity with the apolipoprotein L family of proteins [30]. However bases 517 through 2258 of the LEB-1 cDNA also exhibited approximately 85% homology with the last exon of another related gene predicted to exist at this locus (GenBank accession no. 9030421J09Rik). In addition, bases 1115 – 2260 exhibited 74% homology with a fragment of the 3′-untranslated region of Dppa2 (GenBank accession no. NM 138815), a gene found to be associated with pluropotentiality during embryonic development [31].
Figure 1.
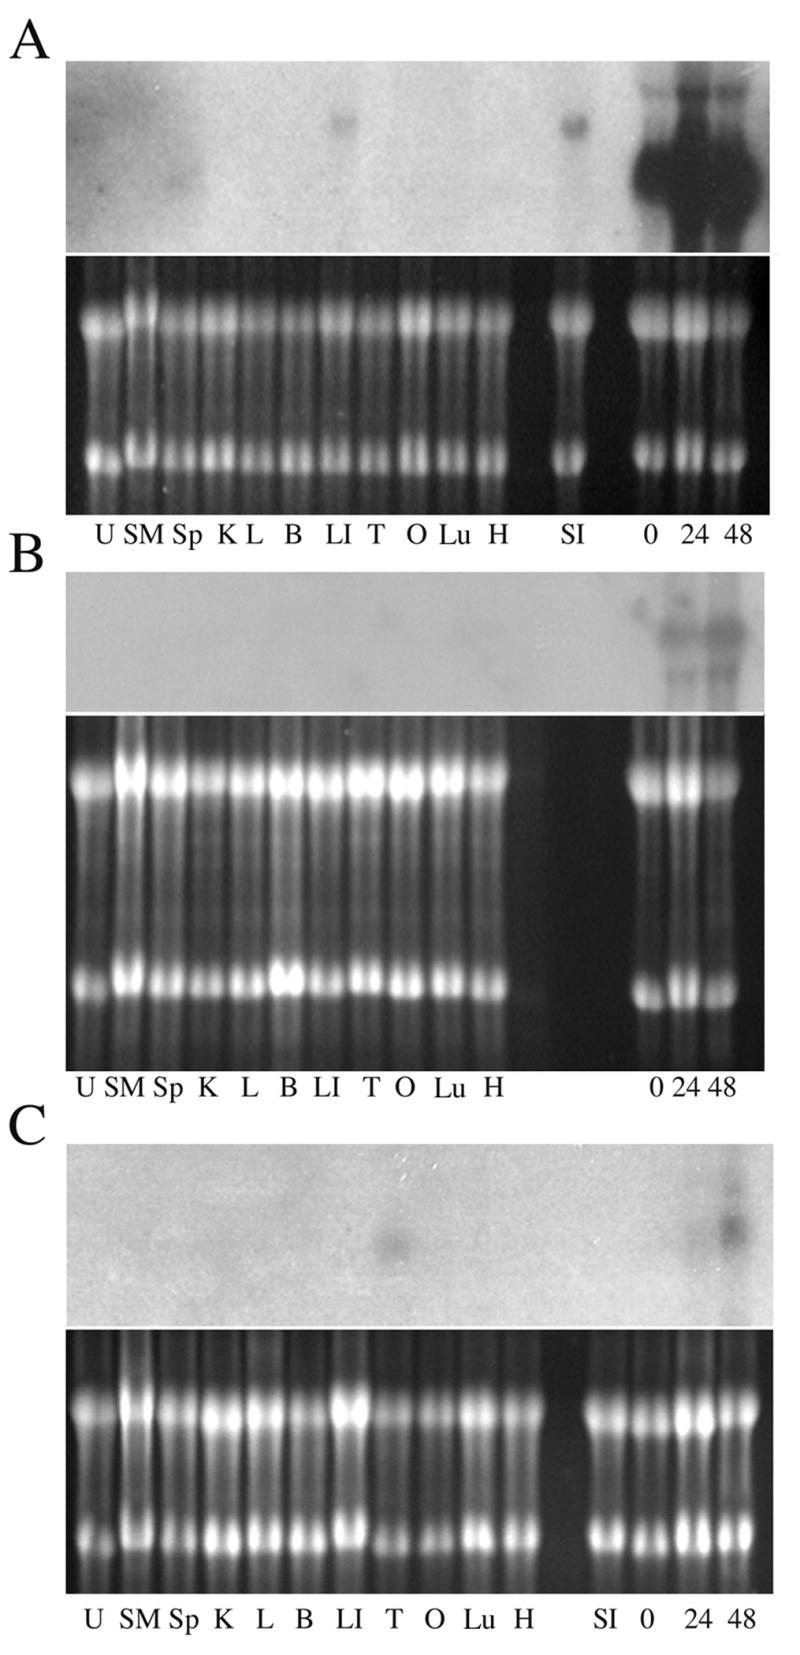
Detection of LEB gene expression in mouse tissues using 5′-RACE generated probes. A. Top, northern blot probed with the LEB-1 5′RACE probe. Bottom, RNA samples on blot prior to transfer. U, uterus; SM, skeletal muscle; Sp, spleen; K, kidney; L, liver; B, cerebrum; LI, large intestine; T, testis; O, ovary; Lu, lung; H, heart; SI, small intestine; 0, FVA cells at the intiation of culture; 24, FVA cells after 24 hours of culture with EPO; 48, FVA cells after 48 hours of culture with EPO. B, Top, northern blot probed with the LEB-2 5′RACE probe. Bottom, RNA samples on blot prior to transfer. Labels for gel lanes are as above. C. Top, northern blot probed with the LEB-3 5′RACE probe. Bottom, RNA samples on blot prior to transfer. Labels for gel lanes are as above.
An independent LEB-1 clone was obtained after RT-PCR using primers based on the coding sequence of A330102K04Rik. The RT-PCR product was cloned, sequenced, and used in northern analyses. The sequence of the RT-PCR clone matched that of A330102K04Rik (data not shown). The clone detected a mRNA on northern blots of FVA cells that was of the same size and expressed in the same way as the one identified with both the DDRT-PCR and 5′-RACE generated LEB-1 clones, demonstrating that LEB-1 was identical to A330102K04. Figure 2A illustrates the results of the northern analysis using the LEB-1 RT-PCR clone. There was a 1.9-fold increase in the amount of LEB-1 mRNA during the first 24 hours of culture with EPO and a 5.6-fold increase in LEB-1 mRNA after 48 hours of culture in the presence of EPO as compared to the initiation of culture. No hybridization was detected in either small or large intestine with the RT-PCR clone (data not shown), suggesting that the RNAs detected in these tissues with the 5′-RACE clone had homology to sequences primarily in the 3′-untranslated region of LEB-1 mRNA.
Figure 2.
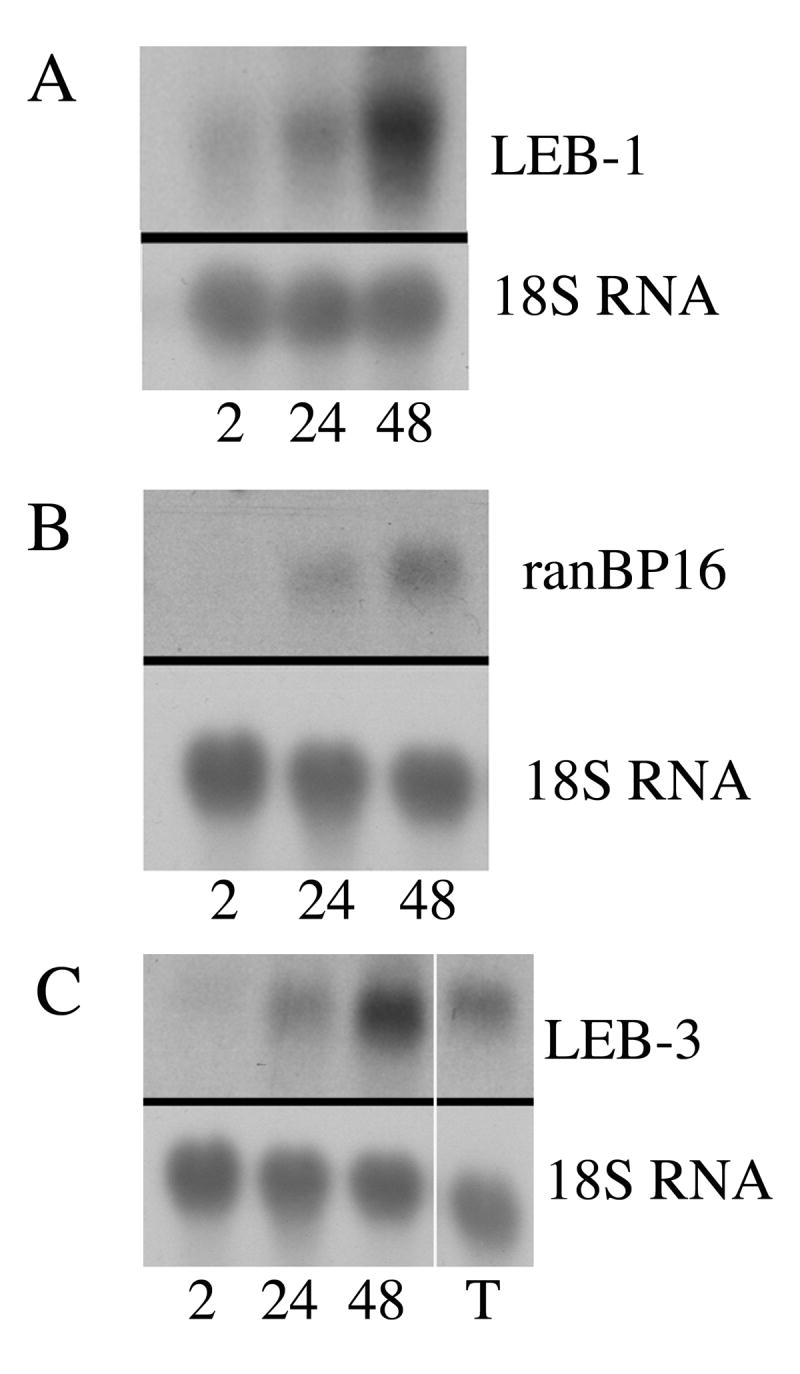
Detection of LEB gene expression in mouse tissues using RT-PCR generated probes. A. Expression of LEB-1/A330102K04 during the terminal differentiation of FVA cells. A. Top, northern blot probed with the LEB-1/A330102K04 RT-PCR probe. Bottom, same blot probed with the mouse 18S ribosomal RNA probe. B. Expression of LEB-2/Xpo7 during the terminal differentiation of FVA cells. Top, northern blot probed with the LEB-2 /Xpo7 RT-PCR probe. Bottom, same blot probed with the mouse 18S ribosomal RNA probe. C. Expression of LEB-3/D930015E06Rik during the terminal differentiation of FVA cells. Top, northern blot probed with the LEB-3/D930015E06Rik RT-PCR probe. Bottom, same blot probed with the mouse 18S ribosomal RNA probe. Labels for lanes: 2, FVA cells after 2 hours of culture with EPO; 24, FVA cells after 24 hours of culture with EPO; 48, FVA cells after 48 hours of culture with EPO; T, testis.
A330102K04Rik shares homology with the apolipoprotein L family of proteins in humans, having 36% amino acid homology with human apolipoprotein L3. The reason for a protein having hypothetical lipid binding properties being differentially expressed during terminal erythroid differentiation is not known, but alterations in the lipid composition of erythrocyte membranes during differentiation have been described. Mature erythrocytes exhibit asymmetric distribution of lipids between the inner and outer leaflets of their plasma membranes [32]. The asymmetry becomes pronounced around the time that nuclear extrusion and reticulocyte formation take place [33,34]. Interestingly, up-regulation of several genes in the apolipoprotein L gene locus in humans are associated with the development of schizophrenia [35] and erythrocytes from schizophrenic patients have been shown to be deficient in a number of fatty acids compared to controls [36,37]. We therefore hypothesize that LEB-1/A333102K04 may play some role in establishing the lipid composition of erythroid membranes. The subcellular localization and possible function of LEB-1/A333102K04 are currently being investigated.
LEB-2
A 1,209 bp clone of LEB-2 (GenBank accession no. AY550930) was isolated by 5′-RACE and subjected to a BLAST search against the mouse genome database. The LEB-2 RACE product exhibited approximately 95% homology with a gene in the chromosome 14 D1 region known as Ran Binding Protein 16 (ranBP16) or Exportin 7 (Xpo7) (GenBank accession no. NM 015024) [28,29]. The homology was to portions of 3 exons and some intronic sequence of Xpo7. The size of the mRNA encoded by Xpo7 is 4.4 kb, consistent with the size of LEB-2 mRNA detected in northern blots of containing total RNA isolated from differentiating FVA cells. The LEB-2 RACE product was used in Northern analyses and was found to identify the same sized mRNA as that identified with the LEB-2 DDRT-PCR product (Figure 1B). LEB-2/Xpo7 was strongly expressed during the late differentiation of FVA cells. No comparable expression was found in other tissue on the blot, but under long exposure conditions a weak signal was detected all lanes (data not shown).
An independent LEB-2 clone was obtained by RT-PCR using primers based on the sequence of Xpo7. The primers were picked to be outside of the region contained in the 5′-RACE generated clone of LEB-2 in order to determine if LEB-2 was identical to Xpo7. The RT-PCR product was cloned, sequenced, and used in northern analyses. The sequence of the RT-PCR clone exactly matched that of Xpo7 (data not shown). The clone identified an mRNA on northern blots that was of the same size and expressed in the same way as the one identified with both the DDRT-PCR and 5′-RACE generated LEB-2 clones, demonstrating that LEB-2 is identical to Xpo7. Figure 2 B illustrates the results obtained with the Xpo7 RT-PCR clone. Xpo7 mRNA was only weakly detected in FVA cells after 2 hours of culture with EPO, but became more prominent over the 48 hour differentiation period, increasing 7-fold. A previous study in which northern blots were performed using poly-A RNA isolated from mouse tissues, rather than total RNA, as used in this study, found that Xpo7 was detected in brain, spleen, liver, kidney and testes [28]. Interestingly, although no quantitative analysis of autoradiograms was presented in that study, the level of Xpo7 expression appeared significantly greater in the spleen as compared to the other tissues when normalized to GAPDH mRNA levels. Such increased expression is consistent with the murine spleen being a hematopoietic organ. Our inability to detect significant Xpo7 gene expression in similar tissues (Figure 1B) was likely due to use of total RNA, rather than poly-A RNA, in our analyses. Nevertheless, the fact that FVA cells had easily detectable amounts of Xpo7 mRNA suggests a role for Xpo7 in terminal differentiation. One reason for high levels of expression of a nuclear exportin in differentiating FVA cells could be that the exportin is involved in exporting one or more molecules from the nucleus otherwise involved in keeping chromatin transcriptionally active or in the decondensed state. An alternative explanation is that the retroviral infection of FVA cells may somehow either increase expression of Xpo7 or delay shutdown of Xpo7 expression to shuttle viral RNA sequences out of the nucleus. The latter explanation seems unlikely in that viral particles can be seen shedding from FVA cells at the earliest stages of differentiation in vitro by electron microscopy, but are not observed to be shed at as high a frequency in more differentiated cells [21]. This time sequence is exactly the opposite to the pattern of Xpo7 expression observed during the terminal differentiation of FVA cells. Nevertheless, distinguishing between the two explanations will require further study.
LEB-3
A 1,100 bp clone of LEB-3 was isolated by 5′RACE (GenBank accession no. AY662647). The LEB-3 5′RACE clone had approximately 99% homology with a predicted gene of unknown function known as D930015E06Rik (GenBank accession number NM 172681) on mouse chromosome 3. The homology was primarily in exons of the predicted gene. D930015E06Rik shares approximately 79% nucleotide identity to a related human gene (also of unknown function) (GenBank accession no. BC131505), 77% nucleotide identity to a related gene in the dog (GenBank accession no. XM 862729), 66% nucleotide identity to a related gene in the red jungle fowl (GenBank accession no. XM 420366), and 47% nucleotide identity to a related gene in the chimpanzee (GenBank accession no. XM 517586). The mRNA for D930015E06Rik is predicted to be 4794 bases in size, consistent with our size estimate of LEB-3 mRNA on northern blots using the LEB-3 DDRT-PCR product as a probe. The LEB-3 5′RACE clone was clearly most strongly expressed in differentiating FVA cells (Figure 1C), but an mRNA of the same size was also detected in normal mouse testis (Lane T, Figure 1C).
A new LEB-3 clone was obtained by RT-PCR using primers based on the sequence of D930015E06Rik. The primers were picked to be outside of the region contained in the clone of LEB-3 obtained by 5′-RACE, in order to determine if LEB-3 was identical to D930015E06Rik. The RT-PCR product was cloned, sequenced and used in Northern analyses. The sequence of the RT-PCR clone exactly matched that predicted from D930015E06Rik (data not shown).
Figure 2C illustrates the results obtained with the D930015E06Rik RT-PCR clone. The clone identified an mRNA on northern blots that was of the same size and was expressed in the same way as the one identified with both the DDRT-PCR and 5′-RACE generated LEB-3 clones, demonstrating that LEB-3 is identical to D930015E06Rik. LEB-3/D930015E06Rik mRNA was detected throughout the differentiation of FVA cells, but accumulated more dramatically than either LEB-1 or LEB-2/Xpo7. LEB-3/D930015E06Rik mRNA increased 3-fold over the first 24 hours of culture with EPO and nearly 11-fold over the 48 hour culture period. The LEB-3/D930015E06Rik RT-PCR clone also recognized an mRNA in testes, just as did the LEB-3 5′-RACE clone. Expression in the testes was 4-fold higher than that in FVA cells cultured for 2 hours in the presence of EPO when normalized to 18S ribosomal RNA (Figure 2C).
Detection of LEB-1/A333102K04 and LEB-3/D930015E06Rik in normal mouse tissues
End point RT-PCR was performed using total RNA isolated from the kidneys and bone marrow from three different female mice to determine the specificity of expression of LEB-1/A333102K04 and LEB-3/D930015E06Rik in hematopoietic and a non-hematopoietic tissue. LEB-2/Xpo7 was not subjected to analysis as it had previously been identified as being expressed in a number of other hematopoietic and non-hematopoietic mouse tissues (28). Total RNA samples isolated from FVA cells cultured for 48 hours in the presence of EPO and from the testis of a male mouse were used as positive controls. GAPDH was used as a positive control for the RT-PCR reactions. An LEB-1/A333102K04 specific RT-PCR product was detected in bone marrow samples from all three mice tested along with the FVA sample (Figure 3, lanes B1, B2, B3 and FVA). An LEB-1/A333102K04 product was also detected in two of the three kidney samples evaluated, but the product was at a significantly lower intensity than that in the bone marrow samples (Figure 3, lanes K1 and K2). An LEB-3/D930015E06Rik specific RT-PCR product was also detected in the bone marrow samples of all three mice tested as well as in the testis and FVA cell sample (Figure 3, lanes B1, B2, B3, T and FVA). A product was also detected in one of the kidney samples (Figure 3, lane K2). A GAPDH specific RT-PCR product was detected in all samples tested. No specific LEB-1/A333102K04 or LEB-3/D930015E06Rik RT-PCR products were detected in kidney, bone marrow, testis or FVA cells when mock reverse transcribed total RNA samples (see Methods and Materials) were diluted and subjected to PCR under the same conditions as the reverse transcribed total RNA samples (data not shown). These results confirm expression of LEB-1/A333102K04 and LEB-3/D930015E06Rik in all normal mouse bone marrow samples tested and suggest less or variable expression in the kidney as a non-hematopoietic organ.
Figure 3.

Detection of LEB gene expression in normal mouse tissues by RT-PCR. Top. cDNA amplified using LEB-1/A330102K04 primers. Middle. cDNA amplified using LEB-3/D930015E06Rik primers. Bottom. cDNA amplified using primers specific for GAPDH. K, kidney. B, bone marrow. T, testis. FVA, FVA cells after 48 hours of culture in the presence of EPO. Numbers indicate whether kidney or bone marrow was from mouse 1, 2 or 3. RT reactions were prepared as described in Methods and Materials and diluted as follows for the PCR reactions: mouse 1, 1:100; mouse 2, 1:200; mouse 3, 1:100; testis, 1:200; FVA, 1:400.
Localization of LEB-3/D930015E06Rik mRNA in Mouse Testis
In situ hybridization of testis with a D930015E06Rik 35S-labeled antisense riboprobe demonstrated specific expression of D930015E06Rik in restricted areas of the seminiferous tubules (Figures 4A and C). Hybridization was most intense in the region in which secondary spermatocytes and early spermatids were located. Little specific hybridization was observed in the regions immediately adjacent to the basement membrane where spermatogonium and primary spermatocytes are located, nor was there significant hybridization observed over late spermatids situated near the lumen of the seminiferous tubule (Figures 4A and C). No specific hybridization was detected with the sense riboprobe (Figures 4B and D). The cytoplasm of Sertoli cells spans the entire region between the basal lamina and lumen of the seminiferous tubule [38]. It is therefore unlikely that Sertoli cells express significant amounts of D930015E06Rik mRNA, as we did not detect mRNA for D930015E06Rik in the apical and basal the regions of the seminiferous tubule. These findings suggest differential expression of LEB-3/ D930015E06Rik during spermatogenesis, particularly in secondary spermatocytes and early spermatids, that parallels that of differentiating erythroblasts. Both processes involve nuclear condensation, transcriptional silencing of chromatin and extensive cellular remodeling in which LEB-3/D930015E06Rik may play a role. Further studies are underway to localize LEB-3/D930015E06Rik protein in differentiating erythroblasts and in spermatocytes.
Figure 4.

Analysis of LEB-3/D930015E06Rik expression in mouse testis by in situ hybridization. A. Low magnification photomicrograph of a mouse seminiferous tubule hybridized with the LEB-3/D930015E06Rik antisense riboprobe. Aggregates of silver grains form a band between the basal and apical regions of the tubule. B. Low magnification photomicrograph of a mouse seminiferous tubule hybridized with the LEB-3/D930015E06Rik sense riboprobe. Only background silver grains are evident and no aggregation of silver grains is seen between the basal and apical regions of the tubule C. Higher magnification photomicrograph of an area contained in A. Silver grains can be seen in greatest density over areas of mouse seminiferous tubules corresponding to where secondary spermatocytes and early spermatids are located. sg, are of tubule where spermatogonia and primary spermatoctes are found; sc, are of tubule where secondary spermatocytes and early spermatids are found; st, area near the lumen of the tubule where late spermatids are found. D. Higher magnification of an area in B. No specific hybridization is present over the seminiferous tubule after hybridization with the sense riboprobe.
Two groups of researchers have recently used microarray profiling [39] and proteomic [40] analyses to identify changes in gene and protein levels that accompanied the chemically induced differentiation of murine erythroleukemia (MEL) cells. MEL cells are erythroblasts that have been transformed by the Friend leukemia virus. They are not sensitive to EPO and do not typically complete the differentiation process by extruding their nuclei to form reticulocytes, but do differentiate to roughly the orthochromatophilic erythroblast stage [41]. Microarray profiling [39] identified approximately 180 genes that exhibited significant changes in expression (up or down) during MEL cell differentiation. Only a small subset of these genes exhibited patterns of expression that increased during the entire time course of MEL differentiation and none of our LEB's were identified in that study. The proteomic study [40] compared uninduced MEL cells to MEL cells after 2 days of induction with N,N'-hexamethylene bisacetamide (HMBA). A total of 31 proteins were found to be differentially expressed, of which 27 were identified by mass spectrometry. Fifteen of these were up-regulated by HMBA and 16 were down-regulated. Again, none of the LEB's in this manuscript were among the proteins identified to be up-regulated in differentiating MEL cells.
We have identified 3 genes not previously described in differentiating erythroblasts. Relative expression of each of these genes peak during the period in which differentiating erythroblasts are undergoing a dramatic series of morphological and biochemical changes, suggesting a role for each in one or more of those processes. Two of the genes have no known function, while one plays a role in exporting molecules from the nucleus. The determination of the function of these genes will likely be facilitated using the FVA cell model in combination with RNAi and knockout mouse studies since all are expressed at relatively high levels during the differentiation of erythroblasts.
Materials and Methods
Cell Culture
FVA cells were prepared as previously described [42]. Briefly, female CD2F1 mice were injected with 104spleen focus forming units of the anemia-inducing strain of Friend virus. After two weeks spleens were harvested from the mice and immature erythroblasts isolated by unit gravity sedimentation over a 1 - 2% gradient of bovine serum albumin (Intergen Corp., Purchase NY). Cells were cultured in 5.0% CO2 in air. The cell culture medium was Iscove's modified Dulbecco's medium (IMDM) (Invitrogen, Grand Island, NY) containing 30% fetal calf serum (Invitrogen), 0.1% deionized bovine serum albumin, 0.1 mM monothioglycerol, 100 U/ ml penicillin, and 1 mg/ml streptomycin. Two units/ml of EPO (Ortho Pharmaceutical Corp, Raritan, NJ) were added where required.
RNA Isolation
Total RNA was extracted from FVA cells and from mouse tissues by a single-step guanidium thiocyanate-phenol-chloroform extraction method [43]. FVA cells were cultured in the absence of EPO for 30 minutes at a density of 2 × 10⁶ cells/ml. At the end of the 30 minute pre-incubation period, 30 × 106 cells were used to extract total RNA for the 0 hours of culture time point (0 hour RNA). FVA cells for later time points were cultured at an initial density of 1 × 10⁶ / ml. EPO was added after the 30 minute pre-incubation and the incubation was continued for 34, 38 or 42 hours. Total RNA was isolated from FVA cells at each time point and combined (late RNA) for use in DD-RT PCR. We chose to collect RNA at these time points to detect gene expression that might increase prior to the time when FVA cells begin to enucleate in culture [20]. Total RNA was collected and pooled from multiple early and late samples to minimize mouse-to-mouse variation in the analysis. Total RNA was also isolated from FVA cells at the initiation of culture (0 hour), and after 2, 24 and 48 hours in the presence of EPO to document levels of gene expression on northern blots and by RT-PCR.
Differential Display Reverse Transcriptase PCR
DDRT-PCR was based on that of Bauer et al [44] using one anchor primer in combination with 12 different arbitrary primers. Primers were purchased from Invitrogen (Carlsbad, CA).
Isolation and Reamplification of Differentially Displayed cDNA
Differentially displayed cDNA bands were cut from the dried gels and eluted using a modification of a previously described procedure [45]. The eluted DNA was precipitated and dissolved in 10 μl of nuclease-free water. Two μl of the eluted DNA were reamplified to generate cDNA for analysis. The anchor and arbitrary primers used for the reamplification were the same primers used in the original DD-RT PCR. After the addition of all of the components, the reaction mixture was overlaid with 50 μl of light mineral oil and subjected to 20 cycles of amplification using the temperature conditions described for the initial PCR reaction above. After 20 cycles, the concentration of each of the primers in the reaction mixture was increased to 10 μM and that of dNTPs to 100 μM. The reaction mixture was then subjected to another 20 cycles of amplification. Agarose gel analysis was performed using 15 μl of the reamplified DNA sample to confirm specificity of the PCR.
Confirmation of Differential Expression
Slot-Blot analysis was used as a secondary screen to confirm the differential expression of reamplified cDNA bands as previously described [45].
Cloning of Differentially Expressed cDNA Fragments
Differentially expressed cDNA fragments were reamplified once again as described above. The fresh PCR product was ligated into a TA cloning PCR II or 2.1 vectors (Invitrogen Corporation, Carlsbad, CA) and sequenced.
Northern Blots
Northern blots were performed as previously described [42]. Briefly, 15 μg of total RNA for each sample were resolved on a 1% alkaline agarose gel. Gel electrophoresis was carried out in the running buffer (1 x MOPS buffer) for 16-20 hours at 22 volts. After gel electrophoresis, gels were soaked in 10 x SSC buffer (pH 7.0, 1.5 M sodium chloride, 1.5 M sodium citrate) twice for 20 min each and blotted to Nytran membranes (Schleicher & Schuell Inc., Keene, NH). The membranes were air dried at room temperature, crosslinked in a UV cross linker (FB-UV XL-1000, Fisher Scientific, Wayne, NJ) and stored at 4° C until needed. Prehybridization, hybridization and washing of the blots were carried out in a hybridization oven (Integrated Separation Systems, Enprotech, Natich, MA). At the time of the hybridization experiment, blots were placed into hybridization bottles along with 10 ml of prehybridization buffer [3 ml of 20 x SSC buffer, 5 ml of formamide GR (Fisher Scientific, Fair Lawn, NJ), 1 ml of 50 x Denhardt's solution, 0.5 ml of 10% SDS, 0.5 ml of nuclease-free water] and prehybridization was allowed to proceed at 42° C for 2-3 hours. Random primer labeled LEB cDNA probes were synthesized using a Multiprime Random Primer Labeling System (Amersham International Plc, Amersham, UK) and α32P-dCTP (3,000 Ci/mmol) (Perkin Elmer, Boston, MA). The probes were denatured and added to the prehybridization buffer at a concentration of 1 × 10⁶ cpm/ml. The membranes were then hybridized at 42° C for 20 hours. Blots were washed at 42° C with 2 changes of 2x SSC/0.5% SDS for 15 minutes per change. The blots were then washed at 52° C with 3 changes of 0.1x SSC/0.1% SDS for 20 minutes per change. The blots were air-dried, sealed in plastic bags, and exposed to X-ray film (Fuji Photo Film Co Ltd, Japan) with an intensifying screen at −80° C for up to 14 days.
Quantitation of the autoradiographic signals on blots were performed on a Power Macintosh G4 computer using the public domain ImageJ program. The expression of each differentially expressed mRNA was normalized to the amount 18S RNA in each lane after reprobing the blots with a murine 18S RNA probe obtained from the American Type Culture Collection (ATCC Number 63178). This method of normalization was chosen since no housekeeping genes maintained constant levels of expression during the time course of FVA cell terminal differentiation,
5′-Rapid Amplification of cDNA Ends (5′-RACE)
Additional 5′ sequence information was obtained for LEB's 1-3 using a commercially available 5′RACE kit (5′ RACE System for Rapid Amplification of cDNA ends, Version 2.0, Invitrogen). Each RACE reaction required two gene specific primers. The first primer was used in the RT reaction to generate cDNA and the second was used as one of the primers in the PCR amplification of the RACE product, along with the anchor primer supplied with the kits. The procedure was performed as described by the manufacturer. 5′-RACE products were cloned into PCR 2.1 and sequenced. The sequences were then used in BLAST searches against the mouse genome to identify candidate genes for each.
PCR Amplification
In order to determine if potential candidate genes identified by BLAST analysis were truly being expressed during the terminal differentiation of FVA cells, we designed primers to amplify segments of the candidate gene cDNAs that were outside the region contained in the 5′RACE clones. Primers were designed using the program GeneJockeyII (Biosoft, Ferguson, MO). The primer pairs used are as follows (5′-3′): LEB-1: forward; AGCCATTGATAACTTCACGG, reverse; ACACAGAGGATGCTGAGAGTGC, LEB-2/Xpo7: forward; CTGGAAGATACAGGTCTGGTCC, reverse; GCTTCACTAACTTCCTTACG, LEB-3: forward; CGCTGCCGTGAACCTTCTGC, reverse; ATGTTCATCTCCAAGTGTAGCG. Reverse Transcription reactions were performed using 300 ng reverse primer with M-MuLV reverse transcriptase (Promega Biotech) according to manufacturers instructions. PCR was performed using PCR Master Mix (Promega Biotech) according to manufactures instructions. PCR products were cloned into pGEM-T or pGEM-T easy vectors (Promega Biotech), sequenced, and compared to the published sequences of candidate genes in the mouse genome database.
PCR was also used to determine if LEB-1 and LEB-3 could be detected in bone marrow of normal mice. Total RNA was isolated as described above from bone marrow extruded from the femur of three different adult female Balb-c mice. Total RNA was also isolated from half of one kidney from each mouse to serve as a non-erythroid control tissue. Total RNA was also isolated from FVA cells after 48 hours of culture in the presence of EPO as a positive control and from testes of one male mouse. Ten μg of total RNA from each sample was treated with Amplification Grade DNase I (Invitrogen) and then 1 μg of the DNase-treated total RNA was reverse transcribed using SuperScript III First Strand Supermix for qRT-PCR (Invitrogen). One μg DNase-treated total RNA from each sample was also subjected to a mock RT reaction, in which all components of the reaction were added but, but nuclease-free water was substituted for the RT-Enzyme Mix to serve as a negative control for PCR. The RT reactions containing total cDNA or mock reverse transcribed total RNA were diluted from 1:100 to 1:400 and 5 μl of the diluted cDNA was used in three different 30 μl total volume PCR reactions (PCR Mastermix, Promega Biotech) to amplify LEB-1, LEB-3 and GAPDH. The dilution of cDNA that was used for each sample was the highest that yielded specific and reproducible amplification of LEB-1/A333102K04 and/or LEB-3/D930015E06Rik. The primer pairs used were as follows (5′-3′): LEB-1 forward; AAGTCATTGATAACGCCACG, LEB-1 reverse; GAGGAAACTCTCGCAGAAACCG, LEB-3 forward; GGCAGAGACCACTAATACCAGC, LEB-3 reverse; TTGAGTGTTCTCTTCAGGTTGC, GAPDH forward; CATGTTCCAGTATGACTCCACTC, GAPDH reverse; GGCCTCACCCCATTTGATGT. The amplimer sizes for each were as follows: LEB-1, 222 bp; LEB-3, 174 bp and GAPDH, 136 bp. Products of the PCR reactions were analyzed on 2.0% agarose gels.
Riboprobe Production
Sense and anti-sense LEB-3 RNA riboprobes were prepared following the manufacturers instructions (Riboprobe in vitro Transcription Systems, Promega Biotech). Riboprobes were labeled with α35S-UTP (Perkin Elmer, Boston, MA, 1250 Ci/mmol). Phenol/chloroform extracted, Sal I (Promega Biotech) restricted, plasmid was used with T7 RNA polymerase to produce sense riboprobe. Sense riboprobes had the same sequence as the LEB-3 mRNA present in the mouse testis and served as a method control for non-specific hybridization of probe to the tissue. Phenol/chloroform extracted, Sac II (Promega Biotech) restricted, plasmid was used with SP6 RNA polymerase to produce anti-sense riboprobe. The anti-sense riboprobe had a sequence complementary to LEB-3 mRNA. The difference in hybridization between sense (non-specific) and anti-sense (non-specific plus specific) probes was taken to be specific LEB-3 hybridization.
In Situ Hybridization
Sections of 4-μm thickness were cut and processed for in situ hybridization as previously described [47]. Briefly, 600,000 cpm of either sense or anti-sense LEB-3 riboprobe in 30 μL hybridization buffer was applied to each slide and the sections sealed under siliconized 24 × 40 mm coverslips using rubber cement. Hybridization was allowed to proceed overnight at 50°C. Coverslips were then removed and the slides were washed for 10 minutes in 2 changes of 4X SSC +10 mM 2-mercaptoethanol (BME) at room temperature. All slides were then washed in 50% formamide:2X SSC + BME at 50°C for 30 minutes, followed by 2 brief changes of 2X SSC without added BME. The slides were then subjected to RNase digestion (40 μg/ml RNase A and 40 U/ml RNase T1 in 2X SSC) at 37°C for 30 minutes. The slides were again washed in 50% formamide:2X SSC + BME at 50°C for 30 minutes. The slides were washed at 50°C as follows and included 10 mM BME in all solutions: 3 times for 15 minutes in 1X SSC, 3 times for 15 minutes in 0.5X SSC, and 3 times for 15 minutes in 0.25X SSC. The slides were washed in three changes of 0.1X SSC without added BME at room temperature, dehydrated through 70%, 90%, and 100% ethanol and subjected to autoradiography and hematoxylin and eosin (H & E) staining as previously described. Photomicrographs were taken using an Olympus BH2 microscope equipped with a SPOT RT Color camera (Diagnostic Instruments, Sterling Heights, MI).
Footnotes
Publisher's Disclaimer: This is a PDF file of an unedited manuscript that has been accepted for publication. As a service to our customers we are providing this early version of the manuscript. The manuscript will undergo copyediting, typesetting, and review of the resulting proof before it is published in its final citable form. Please note that during the production process errors may be discovered which could affect the content, and all legal disclaimers that apply to the journal pertain.
References
- 1.Dessypris EN. Erythropoiesis. In: Lee GR, Bithell TC, Foerster J, Athens JW, Lukens JN, editors. Wintrobe's Clinical Hematology. 9. Vol. 1. Lea & Febiger; Philadelphia: 1993. [Google Scholar]
- 2.Lazarides E, Woods C. Biogenesis of the red blood cell membrane-skeleton and the control of erythroid morphogenesis. Annual Review of Cell Biology. 1989;5:427–52. doi: 10.1146/annurev.cb.05.110189.002235. [DOI] [PubMed] [Google Scholar]
- 3.Koury MJ, Bondurant MC, Mueller TJ. The role of erythropoietin in the production of principal erythrocyte proteins other than hemoglobin during terminal erythroid differentiation. Journal of Cellular Physiology. 1986;126:259–65. doi: 10.1002/jcp.1041260216. [DOI] [PubMed] [Google Scholar]
- 4.Nehls V, Drenckhahn D, Joshi R, Bennett V. Adducin in erythrocyte precursor cells of rats and humans: expression and compartmentalization. Blood. 1991;78:1692–6. [PubMed] [Google Scholar]
- 5.Hanspal M, Hanspal JS, Kalraiya R, Liu SC, Sahr KE, Howard D, Palek J. Asynchronous synthesis of membrane skeletal proteins during terminal maturation of murine erythroblasts. Blood. 1992a;80:530–9. [PubMed] [Google Scholar]
- 6.Hanspal M, Hanspal JS, Kalraiya R, Palek J. The expression and synthesis of the band 3 protein initiates the formation of a stable membrane skeleton in murine Rauscher-transformed erythroid cells. Eur J Cell Biol. 1992b;58:313–8. [PubMed] [Google Scholar]
- 7.Hanspal M, Kalraiya R, Hanspal J, Sahr KE, Palek J. Erythropoietin enhances the assembly of alpha, beta spectrin heterodimers on the murine erythroblast membranes by increasing beta spectrin synthesis. J Biol Chem. 1991;266:15626–30. [PubMed] [Google Scholar]
- 8.Lehnert ME, Lodish HF. Unequal synthesis and differential degradation of alpha and beta spectrin during murine erythroid differentiation. J Cell Biol. 1988;107:413–26. doi: 10.1083/jcb.107.2.413. [DOI] [PMC free article] [PubMed] [Google Scholar]
- 9.Koury MJ, Bondurant MC, Rana SS. Changes in erythroid membrane proteins during-erythropoieitin-mediated terminal differentiation. Journal of Cellular Physiology. 1987;133:438–448. doi: 10.1002/jcp.1041330304. [DOI] [PubMed] [Google Scholar]
- 10.Koury MJ, Sawyer ST, Brandt SJ. New insights into erythropoiesis. Current Opinion in Hematology. 2002;9:93–100. doi: 10.1097/00062752-200203000-00002. [DOI] [PubMed] [Google Scholar]
- 11.Ney PA. Gene expression during terminal erythroid differentiation. Current Opinion in Hematology. 2006;13:203–208. doi: 10.1097/01.moh.0000231415.18333.2c. [DOI] [PubMed] [Google Scholar]
- 12.Koury MJ, Sawyer ST, Bondurant MC. Splenic erythroblasts in anemia-inducing Friend disease: a source of cells for studies of erythropoietin-mediated differentiation. Journal of Cellular Physiology. 1984;121:526–32. doi: 10.1002/jcp.1041210311. [DOI] [PubMed] [Google Scholar]
- 13.Chen CY, Pajak L, Tamburlin J, Bofinger D, Koury ST. The effect of proteasome inhibitors on mammalian erythroid terminal differentiation. Experimental Hematology. 2002;30:634–9. doi: 10.1016/s0301-472x(02)00826-3. [DOI] [PubMed] [Google Scholar]
- 14.Vannucchi AM, Linari S, Lin CS, Koury MJ, Bondurant MC, Migliaccio AR. Increased expression of the distal, but not of the proximal, Gata1 transcripts during differentiation of primary erythroid cells. Journal of Cellular Physiology. 1999;180:390–401. doi: 10.1002/(SICI)1097-4652(199909)180:3<390::AID-JCP10>3.0.CO;2-K. [DOI] [PubMed] [Google Scholar]
- 15.Bondurant MC, Yamashita T, Muta K, Krantz SB, Koury MJ. C-myc expression affects proliferation but not terminal differentiation or survival of explanted erythroid progenitor cells. Journal of Cellular Physiology. 1996;168:255–63. doi: 10.1002/(SICI)1097-4652(199608)168:2<255::AID-JCP4>3.0.CO;2-O. [DOI] [PubMed] [Google Scholar]
- 16.Prasad KS, Jordan JE, Koury MJ, Bondurant MC, Brandt SJ. Erythropoietin stimulates transcription of the TAL1/SCL gene and phosphorylation of its protein products. Journal of Biological Chemistry. 1995;270:11603–11. doi: 10.1074/jbc.270.19.11603. [DOI] [PubMed] [Google Scholar]
- 17.Kelley LL, Green WF, Hicks GG, Bondurant MC, Koury MJ, Ruley HE. Apoptosis in erythroid progenitors deprived of erythropoietin occurs during the G1 and S phases of the cell cycle without growth arrest or stabilization of wild-type p53. Molecular & Cellular Biology. 1994;14:4183–92. doi: 10.1128/mcb.14.6.4183. [DOI] [PMC free article] [PubMed] [Google Scholar]
- 18.Kelley LL, Koury MJ, Bondurant MC. Regulation of programmed death in erythroid progenitor cells by erythropoietin: effects of calcium and of protein and RNA syntheses. Journal of Cellular Physiology. 1992;151:487–96. doi: 10.1002/jcp.1041510307. [DOI] [PubMed] [Google Scholar]
- 19.Kelley LL, Koury MJ, Bondurant MC, Koury ST, Sawyer ST, Wickrema A. Survival or death of individual proerythroblasts results from differing erythropoietin sensitivities: a mechanism for controlled rates of erythrocyte production. Blood. 1993;82:2340–52. [PubMed] [Google Scholar]; 22 Kim HD, Koury MJ, Lee SJ, Im JH, Sawyer ST. Metabolic adaptation during erythropoietin-mediated terminal differentiation of mouse erythroid cells. Blood. 1991;77:387–92. [PubMed] [Google Scholar]
- 20.Koury ST, Koury MJ, Bondurant MC. Cytoskeletal distribution and function during the maturation and enucleation of mammalian erythroblasts. Journal of Cell Biology. 1989;109:3005–13. doi: 10.1083/jcb.109.6.3005. [DOI] [PMC free article] [PubMed] [Google Scholar]
- 21.Koury ST, Koury MJ, Bondurant MC. Morphological changes in erythroblasts during erythropoietin-induced terminal differentiation in vitro. Experimental Hematology. 1988;16:758–63. [PubMed] [Google Scholar]
- 22.Koury MJ, Bondurant MC. Maintenance by erythropoietin of viability and maturation of murine erythroid precursor cells. Journal of Cellular Physiology. 1988;137:65–74. doi: 10.1002/jcp.1041370108. [DOI] [PubMed] [Google Scholar]
- 23.Bondurant M, Koury M, Krantz SB, Blevins T, Duncan DT. Isolation of erythropoietin-sensitive cells from Friend virus-infected marrow cultures: characteristics of the erythropoietin response. Blood. 1983;61:751–8. [PubMed] [Google Scholar]
- 24.Sawyer ST, Krantz SB, Sawada K. Receptors for erythropoietin in mouse and human erythroid cells and placenta. Blood. 1989;74:103–9. [PubMed] [Google Scholar]
- 25.Wickrema A, Bondurant MC, Krantz SB. Abundance and stability of erythropoietin receptor mRNA in mouse erythroid progenitor cells. Blood. 1991;78:2269–75. [PubMed] [Google Scholar]
- 26.Koury MJ, Koury ST, Kopsombut P, Bondurant MC. In vitro maturation of nascent reticulocytes to erythrocytes. Blood. 2005;105:2168–74. doi: 10.1182/blood-2004-02-0616. [DOI] [PubMed] [Google Scholar]
- 27.Xue SP, Zhang SF, Ma W, Zhang Z, Liu P, Zhao Q, Han D. Erythroid differentiation denucleation factors (EDDFs) function as intrinsic, post-erythropoietin regulators for mammalian erythroid terminal differentiation. Cell Prolif. 2006;39:61–74. doi: 10.1111/j.1365-2184.2006.00366.x. [DOI] [PMC free article] [PubMed] [Google Scholar]
- 28.Koch P, Bohlmann I, Schafer M, Hansen-Hagge TE, Kiyoi H, Wilda M, Hameister H, Bartram CR, Janssen JW. Identification of a novel putative Ran-binding protein and its close homologue. Biochemical & Biophysical Research Communications. 2000;278:241–9. doi: 10.1006/bbrc.2000.3788. [DOI] [PubMed] [Google Scholar]
- 29.Kutay U, Hartmann E, Treichel N, Calado A, Carmo-Fonseca M, Prehn S, Kraft R, Gorlich D, Bischoff FR. Identification of two novel RanGTP-binding proteins belonging to the importin beta superfamily. Journal of Biological Chemistry. 2000;275:40163–8. doi: 10.1074/jbc.M006242200. [DOI] [PubMed] [Google Scholar]
- 30.Duchateau PN, Pullinger CR, Cho MH, Eng C, Kane JP. Apolipoprotein L gene family: tissue-specific expression, splicing, promoter regions; discovery of a new gene. Journal of Lipid Research. 2001;42:620–30. [PubMed] [Google Scholar]
- 31.Du J, Lin G, Nie Z, Lu G. Molecular cloning and characterization analysis of HPESCRG1, a novel gene expressed specifically in human embryonic stem cell. Zhonghua Yi Xue Yi Chuan Xue Za Zhi. 2004;6:542–547. [PubMed] [Google Scholar]
- 32.Schwartz RS, Chiu DT, Lubin B. Plasma membrane phospholipid organization in human erythrocytes. Current Topics in Hematology. 1985;5:63–112. [PubMed] [Google Scholar]
- 33.Nijhof W, van der Schaft PH, Wierenga PK, Roelofsen B, Op den Kamp JA, van Deenen LL. The transbilayer distribution of phosphatidylethanolamine in erythroid plasma membranes during erythropoiesis. Biochimica et Biophysica Acta. 1986;862:273–7. doi: 10.1016/0005-2736(86)90228-2. [DOI] [PubMed] [Google Scholar]
- 34.Van der Schaft PH, Roelofsen B, Op den Kamp JA, Van Deenen LL. Phospholipid asymmetry during erythropoiesis. A study on Friend erythroleukemic cells and mouse reticulocytes. Biochimica et Biophysica Acta. 1987;900:103–15. doi: 10.1016/0005-2736(87)90282-3. [DOI] [PubMed] [Google Scholar]
- 35.Mimmack ML, Ryan M, Baba H, Navarro-Ruiz J, Iritani S, Faull RL, McKenna PJ, Jones PB, Arai H, Starkey M, Emson PC, Bahn S. Gene expression analysis in schizophrenia: reproducible up-regulation of several members of the apolipoprotein L family located in a high-susceptibility locus for schizophrenia on chromosome 22. Proceedings of the National Academy of Sciences of the United States of America. 2002;99:4680–5. doi: 10.1073/pnas.032069099. [DOI] [PMC free article] [PubMed] [Google Scholar]
- 36.Ponizovsky AM, Barshtein G, Bergelson LD. Biochemical alterations of erythrocytes as an indicator of mental disorders: an overview. Harvard Review of Psychiatry. 2003;11:317–32. [PubMed] [Google Scholar]
- 37.Ponizovsky AM, Modai I, Nechamkin Y, Barshtein G, Ritsner MS, Yedgar S, Lecht S, Bergelson LD. Phospholipid patterns of erythrocytes in schizophrenia: relationships to symptomatology. Schizophrenia Research. 2001;52:121–6. doi: 10.1016/s0920-9964(00)00189-4. [DOI] [PubMed] [Google Scholar]
- 38.Junqueira L, Carneiro J. Basic Histology. Lange Medical Publications; Los Altos., CA: 1983. [Google Scholar]
- 39.Heo HS, Kim Ju H, Lee YJ, Kim SH, Cho YS, Kim CG. Microarray profiling of genes differentially expressed during erythroid differentiation of murine erythroleukemia cells. Mol Cells. 2005;20:57–68. [PubMed] [Google Scholar]
- 40.Petrak J, Myslivcova D, Man P, Cmejlova J, Cmejla R, Vyoral D. Proteomic analysis of erythroid differentiation induced by hexamethylene bisacetamide in murine erythroleukemia cells. Exp Hematol. 2007;35:193–202. doi: 10.1016/j.exphem.2006.10.007. [DOI] [PubMed] [Google Scholar]
- 41.Friend C, Scher W, Holland JG, Sato T. Hemoglobin synthesis in murine virus-induced leukemic cells in vitro: stimulation of erythroid differentiation by dimethyl sulfoxide. Proceedings of the National Academy of Sciences of the United States of America. 1971;68:378–382. doi: 10.1073/pnas.68.2.378. [DOI] [PMC free article] [PubMed] [Google Scholar]
- 42.Sawyer ST, Koury MJ, Bondurant MC. Large-scale procurement of erythropoietin-responsive erythroid cells: assay for biological activity of erythropoietin. Methods in Enzymology. 1987;147:340–52. doi: 10.1016/0076-6879(87)47123-1. [DOI] [PubMed] [Google Scholar]
- 43.Chomczynski P, Sacchi N. Single-step method of RNA isolation by acid guanidinium thiocyanate-phenol-chloroform extraction. Anal Biochem. 1987;162:156–9. doi: 10.1006/abio.1987.9999. [DOI] [PubMed] [Google Scholar]
- 44.Bauer D, Muller H, Reich J, Riedel H, Ahrenkiel V, Warthoe P, Strauss M. Identification of differentially expressed mRNA species by an improved display technique (DDRT-PCR) Nucleic Acids Res. 1993;21:4272–80. doi: 10.1093/nar/21.18.4272. [DOI] [PMC free article] [PubMed] [Google Scholar]
- 45.Mou L, Miller H, Li J, Wang E, Chalifour L. Improvements to the differential display method for gene analysis. Biochem Biophys Res Commun. 1994;199:564–9. doi: 10.1006/bbrc.1994.1265. [DOI] [PubMed] [Google Scholar]
- 46.Molinaro RJ, Bernstein JM, Koury ST. Localization and quantitation of eotaxin mRNA in human nasal polyps. Immunological Investigations. 2003;32:143–54. doi: 10.1081/imm-120022975. [DOI] [PubMed] [Google Scholar]
- 47.Semenza GL, Koury ST, Nejfelt MK, Gearhart JD, Antonarakis SE. Cell-type-specific and hypoxia-inducible expression of the human erythropoietin gene in transgenic mice. Proceedings of the National Academy of Sciences of the United States of America. 1991;88:8725–9. doi: 10.1073/pnas.88.19.8725. [DOI] [PMC free article] [PubMed] [Google Scholar]