Abstract
Human prostaglandin (PG) E synthase (EC 5.3.99.3) is a member of a recently recognized protein superfamily consisting of membrane associated proteins involved in eicosanoid and glutathione metabolism (the MAPEG family). Previous designations of the protein are PIG12 and MGST1-L1. PGE synthase was expressed in Escherichia coli, and both cytosolic and membrane fractions were prepared. Western blot analysis specifically detected a 15- to 16-kDa protein in the membrane fraction. Both fractions were incubated with prostaglandin H2 in the presence or absence of reduced glutathione. The membrane but not the cytosolic fraction was found to possess high glutathione-dependent PGE synthase activity (0.25 μmol/min/mg). The human tissue distribution was analyzed by Northern blot analysis. High expression of PGE synthase mRNA was detected in A549 and HeLa cancer cell lines. Intermediate level of expression was demonstrated in placenta, prostate, testis, mammary gland, and bladder whereas low mRNA expression was observed in several other tissues. A549 cells have been used as a model system to study cyclooxygenase-2 induction by IL-1β. If A549 cells were grown in the presence of IL-1β, a significant induction of the PGE synthase was observed by Western blot analysis. Also, Western blot analysis specifically detected a 16-kDa protein in sheep seminal vesicles. In summary, we have identified a human membrane bound PGE synthase. The enzyme activity is glutathione-dependent, and the protein expression is induced by the proinflammatory cytokine IL-1β. PGE synthase is a potential novel target for drug development.
Prostaglandin endoperoxide H2 (PGH2) is formed from arachidonic acid by the action of cyclooxygenases (cox) -1 or -2. cox-1 is constitutively expressed in many cells and tissues such as platelets, endothelium, stomach, and kidney whereas the cox-2 protein can be induced by proinflammatory cytokines like IL-1β at sites of inflammation (for recent reviews on cox see refs. 1–3). Downstream of the cyclooxygenases, the product PGH2 can be further metabolized into the various physiologically important eicosanoids: e.g., PGF2α, PGE2, PGD2, PGI2 (prostacyclin), and thromboxane A2 (4).
The mechanism for the biosynthesis of PGE1 and PGF1α (formed by using dihomo-γ-linolenic acid instead of arachidonic acid) (5) by sheep vesicular glands was postulated to proceed via a cyclic endoperoxide (6) later designated PGH2 (7–9). In short, the reactions catalyzed by cyclooxygenase start by stereospecific abstraction of a hydrogen atom from carbon 13 of arachidonic acid. The resulting carbon radical reacts with molecular oxygen followed by the formation of the 9,11-endoperoxide and the bond between C-8 and C-12. Thereafter, a second molecule of oxygen is incorporated at C-15 followed by reduction to a hydroperoxy group, and PGG2 is formed. This hydroperoxy group can subsequently be reduced by the peroxidase activity of the cyclooxygenase (in the presence of a reducing agent: e.g., glutathione) thus forming PGH2. The enzyme(s) responsible for the isomerization of PGH2 into PGE2 are not well known. Attempts have been made to isolate the microsomal PGE synthase from ovine and bovine seminal vesicles, an organ known to contain high levels of activity (10, 11). These studies have shown that the microsomal PGE synthase can be solubilized and partly purified. However, the enzyme activity, which depended on glutathione, rapidly deteriorated during the purification attempts. Two monoclonal antibodies, designated IGG1(hei-7) and IGG1(hei-26) and raised against partly purified PGE synthase from sheep seminal vesicles, could immunoprecipitate two proteins from sheep seminal vesicles with molecular masses of 17.5 and 180 kDa, respectively (12). Both of these precipitated proteins were found to possess glutathione-dependent PGE synthase activity but no glutathione S-transferase activity. The 17.5-kDa protein showed a Km for PGH2 of 40 μM, similar to what had been described by others investigating the microsomal PGE synthase (11). In contrast, the larger protein demonstrated a Km for PGH2 of 150 μM. Of interest, the IGG1(hei-7) antibody [but not the IGG1(hei-26) antibody], when incubated with intact sheep vesicular gland microsomes, caused coprecipitation of PGE synthase and cyclooxygenase activities, thereby demonstrating that the 17.5-kDa protein and the cyclooxygenase both are associated with the same membrane systems. Microsomal PGE synthase activity also has been measured in various rat organs (13), and high glutathione-dependent activity was found in the deferens duct, genital accessory organs, and kidney. In the same study, glutathione-independent microsomal PGE synthase activity was observed in heart, spleen, and uterus. Additional proteins, belonging to the cytosolic glutathione S-transferase superfamily, also have been described to possess PGE, PGD, and PGF synthase activities (14). Recently, a microsomal 16.5-kDa protein was purified from sheep seminal vesicles possessing glutathione-dependent PGF2α synthase activity (15). The enzyme (prostaglandin endoperoxide reductase) also could catalyze the reduction of cumene hydroperoxide whereas 1-chloro-2,4-dinitrobenzene (typical substrate for various glutathione S-transferases) was not a substrate. In this paper, we describe the identification and characterization of human PGE synthase.
MATERIALS AND METHODS
Rabbit anti-human PGE synthase antiserum was raised against the following synthetic peptide: CRSDPDVERSLRAHRN conjugated with keyhole-limpet hemocyanin (Innovagen, Lund, Sweden). This peptide antigen corresponds to amino acids 59–74 of PGE synthase (note that Cys 68 was replaced with Ser). Horseradish peroxidase-linked donkey anti-rabbit antibody was purchased from Amersham Pharmacia. Film (hyperfilm ECL) was obtained from the same source. Oligonucleotides were from Kebo Laboratory (Stockholm, Sweden). Pfu DNA polymerase was from Stratagene. PGH2 and 3H-PGH2 was purchased from Cayman Chemicals, Ann Arbor, MI. PGF2α, PGE2, PGD2, and 12(S)-hydroxy-8,10-trans-5-cis-heptadecatrienoic acid (12-HHT) were obtained from Biomol (Plymouth Meeting, PA). Glutathione and IL-1β were from Sigma. HPLC solvents were from Rathburn Chemicals (Walkerburn, Scotland). Partly purified PGE synthase, isolated from ovine seminal vesicles, was obtained from Oxford Biomedical Research (Oxford, MI). The cell line A549 was from Boehringer Ingelheim. Cell culture media and antibiotics were from GIBCO/BRL and Life Technologies (Paisley, Scotland). Protease inhibitor mixture, Complete, was obtained from Boehringer Mannheim.
Isolation and Cloning of PGE Synthase.
The expressed sequence tag clone 143735 with GenBank accession number R76492 has previously been identified as “microsomal glutathione S-transferase 1-like 1” (MGST1-L1) encoded by GenBank accession number AF027740. The same gene product also has been characterized as “p53-induced PIG12” encoded by GenBank accession number AF010316. The coding sequence of PGE synthase corresponding to the nucleotide sequence 19–477 of the expressed sequence tag clone 143735 (accession number AF027740) was amplified by PCR. Oligonucleotide primers were constructed to incorporate suitable restriction sites (NdeI-HindIII) into the 5′ and 3′ ends of the product. Primer 1 (sense): 5′-GAGAGACATATGCCTGCCCACAGCCTG-3′; Primer 2 (antisense): 5′-GAGAGAAAGCTTCACAGGTGGCGGGCCGC-3′. PCR was performed with 0.2 mM dNTPs, 0.5 μM of the respective primer, 70 ng of template, 2.5 units of Pfu polymerase in 1× Pfu buffer [supplied by the manufacturer (Stratagene)]. The temperature cycles were 45 s at 94°C, 45 s at 60°C, and 45 s at 72°C, repeated 25 times. However, the first denaturing period was 4 min, and the last extension period was 10 min. The PCR product was isolated by agarose gel electrophoresis, was purified from the gel, and was cut with NdeI and HindIII. The resulting product was gel-purified and ligated into the bacterial expression vector pSP19T7LT (16). Ligated plasmids were transformed into DH5α competent cells. Plasmids were isolated from a number of clones and were cleaved with NdeI and HindIII followed by agarose gel electrophoresis to confirm the size of inserts. Selected inserts were sequenced on an Applied Biosystems 373A automated DNA sequencer using a dye terminator cycle sequencing kit. The expression construct containing the correct coding sequence for the PGE synthase was transformed into Escherichia coli BL21 (DE3) [which harbored the plasmid pLys SL (17)]. Glycerol stocks were prepared and stored frozen at −70°C for subsequent use as starting material for the expression experiments.
Expression in E. coli.
Small aliquots (1–2 μl) of bacterial glycerol stock were grown in 1.5 ml 2× YT overnight at 37°C. The cultures were diluted 1:100 into 2 liters of Terrific Broth medium containing ampicillin (75 μg/ml) and chloramphenicol (10 μg/ml) in a 5-liter flask placed in a thermostated water bath. The culture was oxygenated by air bubbling and was grown until the OD600 was 0.4–1.2. At this point, expression was induced by the addition of 1 mM isopropyl β-d-thiogalactopyranoside, the temperature was switched to 30°C, and the culture allowed to grow for another 4 h. Thereafter, cells were pelleted and resuspended in 100 ml TSEG buffer (15 mM Tris⋅HCl, pH 8.0/0.25 M sucrose/0.1 mM EDTA/1 mM glutathione). Lysozyme was added to a final concentration of 0.2 mg/ml, and the mixture was gently stirred for 30 min at 4°C. Then, the cells were lysed by six 30-s sonication pulses from a MSE Soniprep 150 (MSE Scientific Instruments, Sussex, U.K.) sonifier at 40–60% of maximum power. Cell debris was removed by centrifugation at 5,000 × g for 10 min. The supernatant then was centrifuged at 250,000 × g for 1 h, and the membrane pellets were finally resuspended in 10 mM potassium phosphate (pH 7.0), 20% glycerol, 0.1 mM EDTA, and 1 mM glutathione. Controls expressing ratMGST1 were prepared in the same fashion. Total protein concentration was determined by the Coomassie protein assay according to the manufacturer’s instructions (Bio-Rad).
SDS/PAGE and Western Blotting.
Samples were diluted and boiled for two min in SDS-containing sample buffer (18). Proteins were separated through 14% polyacrylamide gels (NOVEX, San Diego) and were electroblotted (19) onto poly(vinylidene difluoride) (Pall) membranes. Transfer efficiency was visualized by using prestained standards (NOVEX). Membranes then were soaked for 1 h at 25°C in Tris-buffered saline (TBS) (100 mM Tris⋅HCl, pH 7.5/150 mM NaCl) containing 0.1% (vol/vol) Tween 20 and 5% (wt/vol) nonfat dried milk. The membrane was subsequently washed twice in 0.1% Tween 20 in TBS (0.1% T-TBS) followed by 1-h incubation at 25°C with the indicated antiserum (1:2,000 dilution) in 0.05% (vol/vol) T-TBS and 2% (wt/vol) nonfat dried milk. After several washing steps (2 × 1 min, 1 × 15 min, and 3 × 5 min, the blot was incubated for 1 h at 25°C with a horseradish peroxidase-linked donkey anti-rabbit antibody (1:2,000 dilution) in 0.05% (vol/vol) T-TBS and 2% (wt/vol) nonfat dried milk. The washing steps were repeated, and, subsequently, enhanced chemiluminescence detection was performed according to the manufacturer’s instructions (ECL Plus, Amersham Pharmacia).
Northern Blot Analysis.
Northern dot blot analysis of human multiple tissue expression array (CLONTECH, cat no. 7775–1) and Northern blot analysis of human multiple tissue blot (CLONTECH, cat nr 7766–1) were performed according to the instructions of the manufacturer. The mRNA amount on each dot (each dot representing mRNA from a certain tissue) of the array was normalized by the manufacturer to yield similar hybridization signals for various housekeeping genes. Therefore, the amounts of mRNA on each dot varies from 53–780 ng, and the array allows for comparative analysis of gene expression in various tissues. The human multiple tissue blot, on the other hand, contained 2 μg of tissue-specific mRNA/lane. Both membranes were hybridized with a random primed cDNA probe (coding region) of PGE synthase. The cDNA probe was labeled by using the T7QuickPrime Kit (Amersham Pharmacia) and α-32P dCTP, according to the instructions of the manufacturer. The probe was purified by using ProbeQuant G-50 columns (Amersham Pharmacia). After hybridization and washing, the dot blot/blot were exposed to x-ray film (SuperRX, Fujifilm, Düsseldorf, Germany).
Cell Culture.
A549 cells were cultured in RPMI 1640 medium supplemented with heat-inactivated fetal bovine serum (10%), fungizone (2.5 μg/ml), penicillin (100 units/ml), and streptomycin (100 μg/ml) at 37°C in an atmosphere of 5% CO2. Approximately 8 × 10⁶ cells in 30 ml of media were seeded in 175-cm2 flasks. After 3 days, confluency was reached, and cells were washed in PBS twice and then were detached by using 3 ml of 1× Trypsin/EDTA solution (GIBCO/BRL) for 15 min at 37°C in an atmosphere of 5% CO2. Thereafter, 3 ml of medium was added to quench the trypsin, and cells were further diluted and reseeded at an appropriate number per square centimeter as just described. To investigate the effect of IL-1β on PGE synthase expression in A549 cells, 8 × 10⁶ cells in 30 ml of medium were plated in 175-cm2 flasks and were incubated for 24 h. Subsequently, the cells were washed in PBS three times followed by addition of 30 ml of RPMI 1640 medium containing fetal bovine serum (2%) and IL-1β (1 ng/ml) and were incubated for another 24 h. For harvest, cells were washed in PBS twice and were trypsinated in 3 ml of 1× Trypsin/EDTA solution for 15 min at 37°C. Thereafter, 3 ml of culture media was added, and cells were centrifuged at 500 × g for 10 min followed by two washes in 5 ml of PBS. The cell pellets were frozen in CO2-ethanol bath and were stored at −80°C.
Preparation of A549 Cells.
The cell pellets were resuspended in 1.0 ml of homogenization buffer consisting of potassium phosphate buffer (0.1 M, pH 7.4), 1× Complete protease inhibitor mixture, and sucrose (0.25M). The samples were sonicated 3 × 20 s and were subjected to differential centrifugation at 1,000 × g for 10 min, 10,000 × g for 15 min, and 170,000 × g for 1 h at 4°C. The 170,000 × g pellets (microsomal fraction) were resuspended in 250 μl of homogenization buffer, described above. Total protein concentration was determined by the Coomassie protein assay according to the manufacturer’s instructions (Bio-Rad).
PGE Synthase Enzyme Assay.
The protein sample was diluted in potassium inorganic phosphate buffer (0.1 M, pH 7.4) containing 2.5 mM reduced glutathione. The reaction (total volume = 100 μl) was started by the addition of 10 μM PGH2 with or without 0.1 μCi 3H PGH2 and was terminated with 60 μl of acetonitrile/HCl, lowering the pH to 3.2. To determine the formation of either PGF2α, PGE2, or PGD2, an aliquot (60 μl) was analyzed by RP-HPLC combined with UV detection (195 nm) and/or radioactivity detection using an online β-RAM detector (Inus System, Tampa, FL). The RP-HPLC column was Nova-Pak C18 (3.9 × 150 mm, 4-μm particle size) obtained from Waters. The mobile phase was water, acetonitrile, and trifluoroacetic acid (70:30:0.007, by vol.) with a flow rate of 1 ml/min. For analysis of 12-HHT, we used a mobile phase of methanol, water, and acetic acid (70:30:0.01, by vol.) and UV detection at 236 nm. The amounts of produced PGE2 and 12-HHT were quantified by integration of the areas under the eluted peaks at 195 and 236 nm, respectively.
RESULTS
Identification of PGE Synthase.
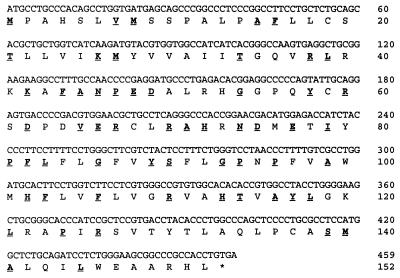
What we have now identified as PGE synthase (Fig. 1) was originally found by its amino acid sequence homology (38%) to MGST1. After complete sequence determination of the insert of the expressed sequence tag clone 143735, the nucleotide sequence as well as the encoded protein sequence was submitted directly to the GenBank database under the name of MGST1-L1 (P.-J.J., J. A. Mancini, and A. W. Ford-Hutchinson, unpublished results). Shortly beforehand, the same sequence had been submitted to GenBank and described as a p53-induced protein, referred to as PIG12 (20).
Figure 1.
Predicted amino acid sequence of PGE synthase. This ORF was used for subsequent protein expression in bacteria. Underlined letters represent amino acids aligning together with MGST1 after running gap within the wisconsin package 9.0 (Genetics Computer Group, Madison, WI).
Expression of PGE Synthase.
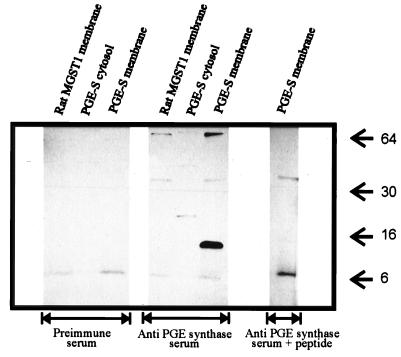
PGE-synthase was expressed by using a bacterial system. To demonstrate protein expression, a peptide antiserum was raised against PGE synthase (amino acid segment 59–74). Fig. 2 demonstrates that this antiserum recognized a 15- to 16-kDa band in the membrane fraction from bacteria expressing PGE synthase. This band was not found in the corresponding cytosolic fraction. Furthermore, the antiserum did not recognize ratMGST1 expressed using the same system. The detection of PGE synthase was specific because antiserum diluted in the presence of 1 × 10⁻⁶ M antigen (peptide) lost the capability to detect PGE synthase.
Figure 2.
Western blot analysis of PGE synthase expression. Both the membrane and cytosolic fractions from bacteria expressing PGE synthase were analyzed by SDS/PAGE and Western blotting. As control, the membrane fraction from bacteria expressing ratMGST1 was included. In all lanes, 5 μg of total protein were analyzed. The middle blot demonstrates the results obtained by using antipeptide antiserum against PGE synthase whereas the left blot shows the results using the corresponding preimmune serum. For the right blot, the antipeptide antiserum was diluted in the presence of 10−6 M peptide antigen. Arrows denote the migration of protein size markers. The exposure time was 2 min.
Prostaglandin E Synthase Activity.
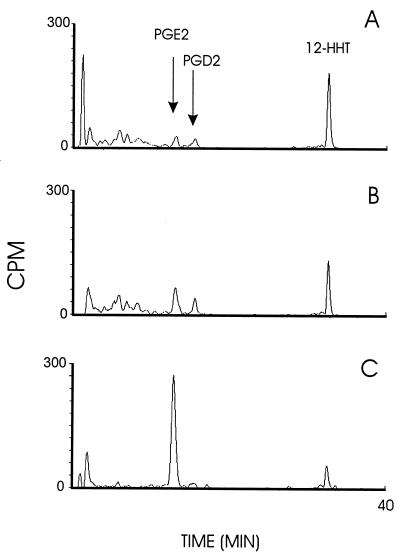
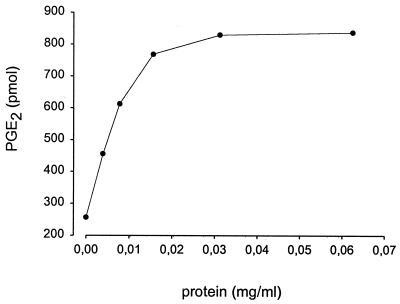
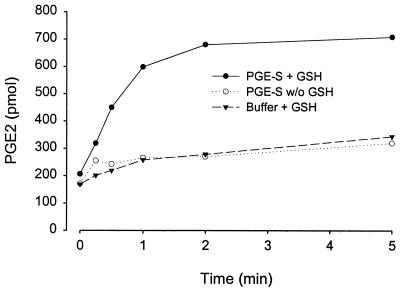
The membrane fraction (0.02 mg total protein/ml) isolated from bacteria expressing PGE synthase was incubated for 2 min in the presence of PGH2 (10 μM including 1 μCi 3H PGH2) and reduced glutathione (2.5 mM). Fig. 3C demonstrates the RP-HPLC profile of radioactive labeled products formed under these conditions. One major peak is produced eluting at 12.3 min, corresponding to the elution time of synthetic PGE2. The material of this peak was collected, derivatized, and analyzed by gas chromatography and mass spectrometry, confirming its identity as PGE2 (data not shown). A minor peak also was produced that eluted at 31.5 min, corresponding to the retention time of 12-HHT. The nonenzymatic formations of these products are shown in Fig. 3B. In this chromatogram, the peak corresponding to PGE2 accounts for <25% of that formed in the presence of membranes from bacteria expressing PGE synthase. Instead, the major product formed corresponds to 12-HHT eluting at 31.5 min as well as another minor peak with a retention time of 14.9 min, corresponding to the retention time of PGD2. The chromatogram in Fig. 3A shows the zero time incubation when substrate was added to buffer containing the membrane fraction pre-mixed with stop solution. Little PGE2 is detected, and the major product peak corresponds to the retention time of 12-HHT. The PGE2 formation (Fig. 3C) was abolished if the membrane was boiled for 2 min before incubation, demonstrating enzyme catalysis. Also, no PGE synthase activity was observed using the membrane fraction obtained from bacteria expressing ratMGST1 as controls. If the membrane fraction was treated with N-ethylmaleimide (1 mM) for 5 min before incubation, the enzyme activity was abolished. No activity was detected in the cytosolic fraction from bacteria expressing PGE synthase. Moreover, no PGE synthase activity was observed in microsomes obtained from Sf9 cells expressing MGST2 or MGST3. Fig. 4 demonstrates the production of PGE2 as a function of protein concentration. In this experiment, various dilutions of the membrane fraction obtained from bacteria expressing PGE synthase were incubated in the presence of PGH2 (10 μM) and glutathione (2.5 mM) for 2 min. The PGE2 formation was analyzed and quantified by RP-HPLC and UV detection at 195 nm, as described in Materials and Methods. A linear relationship was found by using protein concentrations up to 0.015 mg/ml. Thereafter, the curve rapidly levels off because of almost complete conversion of added PGH2 into PGE2. Fig. 5 demonstrates the time dependence of the PGE2 production after incubations of the membrane fraction (0.02 mg/ml) with PGH2 (10 μM) in the presence or absence of glutathione (2.5 mM). A linear relationship is obtained during the first 60 s of incubation, Thereafter, the slope of the curve declines because of substrate depletion. Fig. 5 also shows that the activity depends on the presence of glutathione. The specific activity (under linear conditions subtracting background formation) was 600 pmol/1.2 min/0.002 mg membrane fraction (i.e., 250 nmol/min/mg).
Figure 3.
RP-HPLC chromatogram of the products formed after incubations with PGH2. (A) PGE synthase membrane fraction premixed with stop solution before addition of 3H-PGH2 (10 μM). (B) Buffer control. (C) PGE synthase membrane fraction. B and C were incubated with 3H-PGH2 (10 μM) for 2 min. Products were detected by using radioactivity detection. The first 20 min represents isocratic elution using water, acetonitrile, and trifluoroacetic acid (70:30:0.007, by vol) as mobile phase with a flow rate of 1 ml/min. Then, a linear gradient was applied from 100% mobile phase to 100% methanol over a 10-min period, which was sustained for the rest of the run. CPM, counts per minute.
Figure 4.
Dependency of PGE2 formation on membrane protein concentration. Various dilutions of the membrane fraction isolated from bacteria expressing PGE synthase were incubated with PGH2 (10 μM) in the presence of glutathione (2.5 mM) for 2 min. Product formation was analyzed by RP-HPLC, and PGE2 was detected and quantified by using UV absorbance at 195 nm.
Figure 5.
Time course of PGE2 formation. The membrane fraction obtained from bacteria expressing PGE synthase (0.02 mg/ml) was incubated with PGH2 (10 μM) for the indicated times in the presence (filled circles) or absence (open circles) of glutathione (2.5 mM). Filled triangles represent nonenzymatic (buffer only) PGE2 formation after incubation with PGH2. The product formation was analyzed by RP-HPLC, and PGE2 was detected and quantified by using UV absorbance at 195 nm.
Tissue Distribution of PGE Synthase mRNA.
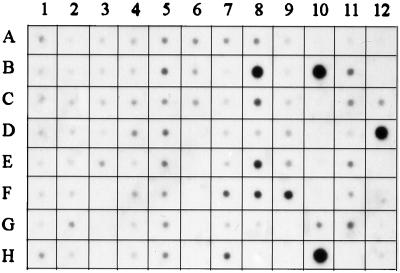
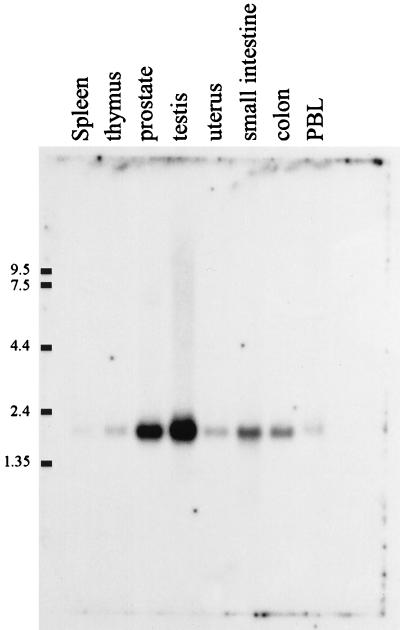
The expression of PGE synthase mRNA was investigated in various tissues by Northern dot blot analysis using a random primed cDNA probe (Fig. 6). A strong hybridization signal was observed in the two cancer cell lines A549 and HeLa (H10 and B10, respectively). A medium strong signal was demonstrated in placenta (B8), prostate (E8), testis (F8), mammary gland (F9), and bladder (C8) whereas a low hybridization signal was observed in several other tissues. Of the negative controls, a strong hybridization signal was observed in the E. coli DNA dot (D12), suggesting specific hybridization to a bacterial gene [a low signal intensity also was found in E. coli rRNA (C12)]. However, no signals were detected in yeast RNA (A12), yeast tRNA (B12), poly r(A) (E12), human Cot-1DNA (F12), human DNA (100 ng) (G12), or human DNA (500 ng) (H12). Fig. 7 demonstrates the result from a Northern blot analysis. The probe clearly hybridized to a 2-kilobase mRNA in prostate and testis. Less strong signals were observed in the small intestine and colon. No other mRNA species were detected apart from the 2-kilobase mRNA. The results from the Northern blot analysis (Fig. 7) thereby support the results from the dot blot analysis (Fig. 6), both regarding the expression pattern and specificity.
Figure 6.
Northern dot blot analysis of PGE synthase in human tissues. A human multiple tissue expression array was hybridized with a radiolabeled cDNA probe specific for PGE synthase. Because the amount of mRNA on each dot has been adjusted to produce normalized signals for various housekeeping genes, the array allows for comparisons of gene expression. The exposure time was 66 h. The various dots represent the following: A1, whole brain; B1, cerebral cortex; C1, frontal lobe; D1, parietal lobe; E1, occipital lobe; F1, temporal lobe; G1, paracentral gyrus of cerebral cortex; H1, pons; A2, cerebellum, left; B2, cerebellum, right; C2, corpus callosum; D2, amygdala; E2, caudate nucleus; F2, hippocampus; G2, medulla oblongata; H2, putamen; A3, substantia nigra; B3, accumbens nucleus; C3, thalamus; D3, pituitary gland; E3, spinal cord; F-H3, empty; A4, heart; B4, aorta; C4, atrium, left; D4, atrium, right; E4, ventricle, left; F4, ventricle, right; G4, interventricular septum; H5, apex of the heart; A5, esophagus; B5, stomach; C5, duodenum; D5, jejunum; E5, ileum; F5, ilocecum; G5, appendix; H5, colon, ascending; A6, colon, transverse; B6, colon, desending; C6, rectum; D-H6, empty; A7, kidney; B7, skeletal muscle; C7, spleen; D7, thymus; E7, peripheral blood leukocytes; F7, lymph node; G7, bone marrow; H7, trachea; A8, lung; B8, placenta; C8, bladder; D8, uterus; E8, prostate; F8, testis; G8, ovary; H8, empty; A9, liver; B9, pancreas; C9, adrenal gland; D9, thyroid gland; E9, salivary gland; F9, mammary gland; G-H9, empty; A10, HL-60; B10, HeLa S3; C10, K-562; D10, Molt-4; E10, Burkitt’s lymphoma, Raji; F10, Burkitt’s lymphoma, Daudi; G10, colorectal adenocarcinoma, SW480; H10, lung carcinoma, A549; A11, fetal brain; B11, fetal heart; C11, fetal kidney; D11, fetal liver; E11, fetal spleen; F11, fetal thymus; G11, fetal lung; H11, empty; A12, yeast, total RNA; B12, yeast tRNA; C12, E. coli rRNA; D12, E. coli DNA; E12, Poly r(A); F12, human CoT-1 DNA; G12, human DNA 100 ng; H12, human DNA 500 ng.
Figure 7.
Northern blot analysis of PGE synthase in human tissues. This human multiple tissue mRNA blot was hybridized with a radiolabeled cDNA probe specific for PGE synthase. The migration of various RNA size markers is indicated. Each lane represent 2 μg of mRNA from the indicated tissues (no normalization for different amounts of housekeeping genes). The exposure time was 32 h.
Induction of PGE Synthase by IL-1β.
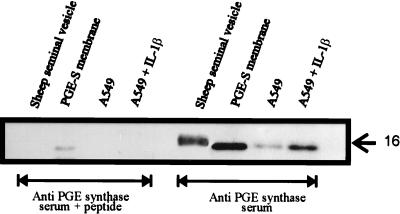
A549 cells have been used to study cox-2 induction and also have been reported to significantly increase their PGE2 release after treatment with IL-1β (21, 22). To study whether PGE synthase also may be regulated by this cytokine, A549 cells were cultured for 24 h in the presence of 1 ng/ml IL-1β. The microsomal fraction prepared from normal cells as well as cells treated with IL-1β were subsequently analyzed for PGE synthase expression by SDS/PAGE followed by Western blotting. Fig. 8 demonstrates that PGE synthase was induced by IL-1β. In the lane loaded with microsomes from IL-1β treated cells, a 15- to 16-kDa band appears comigrating with the PGE synthase expressed in bacteria. The recognition was lost if antiserum was mixed with the antigenic peptide (1 μM), demonstrating specific detection of PGE synthase. Significantly lower amount (yet detectable) of PGE synthase was found in the microsomes derived from nontreated A549 cells.
Figure 8.
Western blot analysis of PGE synthase in A549 cells and sheep seminal vesicles. The microsomal fractions (10 μg) from cells grown for 24 h in the presence (1 ng/ml) or absence of IL-1β were fractionated by SDS/PAGE and were transferred to poly(vinylidene difluoride) membrane. The membranes were incubated by using either PGE synthase antiserum or PGE synthase antiserum containing the antigenic peptide (10−6 M). Also analyzed was the commercially available, partly purified PGE synthase from sheep seminal vesicles (6 μg) as well as the membrane fraction from bacteria expressing human PGE synthase (1 μg).
Identification of an Immunoreactive 16-kDa Protein in Partly Purified PGE Synthase Derived from Ovine Seminal Vesicles.
The commercially available PGE synthase material, partly purified from ram seminal vesicles, was tested for cross reactivity to human PGE synthase antiserum. In Fig. 8, it is evident that a 16-kDa protein band does appear in the lane loaded with 6 μg of this sample. The band is lost using the peptide absorbed antiserum suggesting specific recognition. The protein differs somewhat in size and appears more diffuse, which may suggest posttranscriptional modification.
DISCUSSION
MGST1-L1 was identified as a homologue to MGST1 (P.-J.J., J. A. Mancini, A. W. Ford-Hutchinson, unpublished results) and was termed MGST1-L1. Both MGST1 and MGST1-L1 belong to a recently described protein superfamily (23) referred to as the MAPEG family (membrane-associated proteins involved in eicosanoid and glutathione metabolism). MGST1-L1 was expressed using a bacterial expression system previously used for the production of MGST1 (16). The expression was confirmed by Western blot analysis (Fig. 2). In attempts to characterize MGST1-L1, several reactive substrates for MGST1 and other MAPEG enzymes were tested but were not found to constitute substrates for MGST1-L1. These substrates included 1-chloro-2,4-dinitrobenzene and leukotriene A4 (for screening of any glutathione S-transferase activity) or cumene hydroperoxide and 5-hydroperoxy-eicosatetraenoic acid (for screening of any glutathione-dependent peroxidase activity). The rationale of testing PGH2 as substrate for MGST1-L1 evolved from some common properties among the MAPEG members and some previous reported findings regarding the nature of PGE and PGF synthases, particularly concerning subcellular localizations and glutathione dependencies (12, 14, 15). Also, at the time for the initiation of the present study, we were involved in studying the metabolism of prostaglandin endoperoxide H2 (PGH2) by nuclei isolated from various types of leukocytes.
When tested for PGE synthase activity, membranes from bacteria expressing MGST1-L1 exhibited a significant PGE synthase activity (0.25 μmol/min/mg) corresponding to the highest levels of reported, normally occurring PGE synthase activity, i.e., in microsomes isolated from sheep seminal vesicles (11) and rat ductus deferens (13). In fact, estimating that 1% of the bacterial membrane protein is MGST1-L1, the deduced specific activity becomes 25 μmol/min/mg corresponding to a kcat/Km in the 106 M−1⋅s−1 range. Such high kcat/Km values are hallmarks of very efficient enzymes (24). Considering the short half-life of PGH2 and the existence of competing pathways, it seems logical that a physiologically relevant activity is highly efficient and compartmentalized to the site of its production. Based on these results, we refer to this protein as PGE synthase.
The tissue distribution, analyzed by Northern dot blot and Northern blot analyses, demonstrated high expression of PGE synthase in two cancer cell lines, namely A549 cells and HeLa cells. The PGE synthase also was expressed at intermediate levels in prostate, testis, placenta, mammary gland, and bladder. In comparison to these organs, the gene expression was lower, but still present, in many other tissues and cells (Fig. 6). In line with our tissue distribution result, prostate and placenta are organs well known to produce PGE2 (25, 26). The precise role of prostaglandins in the human reproductive systems is, however, not fully understood. Also, several reports exist describing PGE2 production by mammary epithelial cells and urinary bladder. The human lung adenocarcinoma cell line A549 has been used in several studies concerning expression of cyclooxygenase-2 and prostaglandin E biosynthesis. In a like manner, HeLa cells have been used to some extent. This is in contrast to the cell lines that were negative for PGE synthase expression (based on medline searches), i.e., undifferentiated HL-60 cells, K562 cells, Molt-4, Raji, Daudi, and SW480. We could demonstrate, by Western blot analysis, that PGE synthase protein expression was significantly induced in A549 cells after treatment with IL-1β (Fig. 8). Our results thus agree with published data demonstrating severalfold increase of PGE2 biosynthesis and cox-2 protein in A549 cells in response to IL-1β (21, 22). Combined with these known effects by IL-1β on cox-2 induction, our data suggest that PGE synthase and cox-2 are coregulated and that PGE2 biosynthesis may depend on the presence of both of these enzymes. In accordance, an inducible PGE synthase activity has been described in lipopolysaccharide-stimulated rat peritoneal macrophages, which coincides with cox-2 expression and changes the product formation in favor of PGE2 (27–29). The induction of PGE synthase (PIG12) after p53 expression in a colorectal cancer cell line (DLD-1) (20) also may be of importance for understanding the role of cox and PGE synthase in apoptosis and cancer development, especially because cox-2 has been implicated in colon cancer through the beneficial effects observed by various nonsteroidal anti-inflammatory drugs on cancer growth (3). Likewise, epidemiological data have demonstrated the use of nonsteroidal anti-inflammatory drugs protecting against the development of Alzheimer’s disease (3). The role of cyclooxygenases and PGE synthase in the central nervous system and possible involvement in the pathophysiology of neurodegenerative disorders remains to be elucidated. Also, it will be of great interest to study the role of PGE synthase in common inflammatory diseases such as rheumatoid arthritis and asthma because, traditionally, PGE2 has been regarded as one of the most important prostanoids responsible for mediating the disease symptoms of inflammation. This view on the role of PGE2 was recently supported by the results from knock-out experiments in mice, demonstrating a critical role of the PGE receptor (subtype EP3) in fever responses triggered by IL-1β and lipopolysaccharide (30). Also, PGE2 seems to play a key role in inflammatory pain because a selective anti-PGE2 antibody (2B5) inhibits, equally as potently as indomethacin, phenylbenzoquinone-induced writhing in mice and carrageenan-induced paw oedema and hyperalgesia in rats (31, 32).
In summary, we have identified and characterized microsomal glutathione-dependent PGE synthase. Furthermore, the protein was up-regulated by the proinflammatory IL-1β. PGE synthase is likely to constitute a novel target for drug development in the areas of inflammation and possibly cancer.
Acknowledgments
We thank Dr. Mats Hamberg for performing mass spectrometric analysis. Support from the Swedish Medical Research Council (Projects nos. 03X-00217 and 03X-12573), the Swedish Cancer Society and the Swedish Society of Medicine, Magnus Bergvall, and Harald Jeansson’s and Harald and Greta Jeansson’s foundations is gratefully acknowledged.
ABBREVIATIONS
- PGH2
prostaglandin H2
- PGE2
prostaglandin E2
- 12-HHT
12(S)-hydroxy-8,10-trans-5-cis-heptadecatrienoic acid
- cox
cyclooxygenase
- MGST
microsomal glutathione S-transferase
References
- 1.Smith W. Adv Exp Med Biol. 1997;400B:989–1011. [PubMed] [Google Scholar]
- 2.Herschman H R. Biochim Biophys Acta. 1996;1299:125–140. doi: 10.1016/0005-2760(95)00194-8. [DOI] [PubMed] [Google Scholar]
- 3.Dubois R, Abramson S, Crofford L, Gupta R, Simon L, Van de Putte L, Lipsky P. FASEB J. 1998;12:1063–1073. [PubMed] [Google Scholar]
- 4.Smith W L. Am J Physiol. 1992;263:F181–F191. doi: 10.1152/ajprenal.1992.263.2.F181. [DOI] [PubMed] [Google Scholar]
- 5.Hamberg M, Samuelsson B. J Biol Chem. 1967;242:5336–5343. [PubMed] [Google Scholar]
- 6.Samuelsson B. J Am Chem Soc. 1965;87:3011–3013. doi: 10.1021/ja01091a043. [DOI] [PubMed] [Google Scholar]
- 7.Hamberg M, Samuelsson B. Proc Natl Acad Sci USA. 1973;70:899–903. doi: 10.1073/pnas.70.3.899. [DOI] [PMC free article] [PubMed] [Google Scholar]
- 8.Hamberg M, Svensson J, Wakabayashi T, Samuelsson B. Proc Natl Acad Sci USA. 1974;71:345–349. doi: 10.1073/pnas.71.2.345. [DOI] [PMC free article] [PubMed] [Google Scholar]
- 9.Nugteren D H, Hazelhof E. Biochim Biophys Acta. 1973;326:448–461. doi: 10.1016/0005-2760(73)90145-8. [DOI] [PubMed] [Google Scholar]
- 10.Ogino N, Miyamoto T, Yamamoto S, Hayaishi O. J Biol Chem. 1977;252:890–895. [PubMed] [Google Scholar]
- 11.Moonen P, Buytenhek M, Nugteren D H. Methods Enzymol. 1982;86:84–91. doi: 10.1016/0076-6879(82)86173-9. [DOI] [PubMed] [Google Scholar]
- 12.Tanaka Y, Ward S, Smith W. J Biol Chem. 1987;262:1374–1381. [PubMed] [Google Scholar]
- 13.Watanabe K, Kurihara K, Tokunaga Y, Hayaishi O. Biochem Biophys Res Commun. 1997;235:148–152. doi: 10.1006/bbrc.1997.6708. [DOI] [PubMed] [Google Scholar]
- 14.Urade Y, Watanabe K, Hayaishi O. J Lipid Mediat Cell Signal. 1995;12:257–273. doi: 10.1016/0929-7855(95)00032-l. [DOI] [PubMed] [Google Scholar]
- 15.Burgess J R, Reddy C C. Biochem Mol Biol Int. 1997;41:217–226. doi: 10.1080/15216549700201221. [DOI] [PubMed] [Google Scholar]
- 16.Weinander R, Mosialou E, DeJong J, Tu C P, Dypbukt J, Bergman T, Barnes H J, Hoog J O, Morgenstern R. Biochem J. 1995;311:861–866. doi: 10.1042/bj3110861. [DOI] [PMC free article] [PubMed] [Google Scholar]
- 17.Studier F W. J Mol Biol. 1991;219:37–44. doi: 10.1016/0022-2836(91)90855-z. [DOI] [PubMed] [Google Scholar]
- 18.Laemmli U K. Nature (London) 1970;227:680–685. doi: 10.1038/227680a0. [DOI] [PubMed] [Google Scholar]
- 19.Towbin H, Staehelin T, Gordon J. Proc Natl Acad Sci USA. 1979;76:4350–4354. doi: 10.1073/pnas.76.9.4350. [DOI] [PMC free article] [PubMed] [Google Scholar]
- 20.Polyak K, Xia Y, Zweier J L, Kinzler K W, Vogelstein B. Nature (London) 1997;389:300–305. doi: 10.1038/38525. [DOI] [PubMed] [Google Scholar]
- 21.Huang M, Stolina M, Sharma S, Mao J, Zhu L, Miller P, Wollman J, Herschman H, Dubinett S. Cancer Res. 1998;58:1208–1216. [PubMed] [Google Scholar]
- 22.Mitchell J, Belvisi M, Akarasereenont P, Robbins R, Kwon O, Croxtall J, Barnes P, Vane J. British J Pharmacol. 1994;113:1008–1014. doi: 10.1111/j.1476-5381.1994.tb17093.x. [DOI] [PMC free article] [PubMed] [Google Scholar]
- 23.Jakobsson P-J, Morgenstern R, Mancini J, Ford-Hutchinson A, Persson B. Protein Sci. 1999;8:689–692. doi: 10.1110/ps.8.3.689. [DOI] [PMC free article] [PubMed] [Google Scholar]
- 24.Fersht A. Enzyme Structure and Mechanism. New York: Freeman; 1985. [Google Scholar]
- 25.Hamberg M. Lipids. 1976;11:249–250. doi: 10.1007/BF02532867. [DOI] [PubMed] [Google Scholar]
- 26.Duchesne M J, Thaler-Dao H, de Paulet A C. Prostaglandins. 1978;15:19–42. doi: 10.1016/s0090-6980(78)80003-3. [DOI] [PubMed] [Google Scholar]
- 27.Naraba H, Murakami M, Matsumoto H, Shimbara S, Ueno A, Kudo I, Oh-ishi S. J Immunol. 1998;160:2974–2982. [PubMed] [Google Scholar]
- 28.Matsumoto H, Naraba H, Murakami M, Kudo I, Yamaki K, Ueno A, Oh-ishi S. Biochem Biophys Res Commun. 1997;230:110–114. doi: 10.1006/bbrc.1996.5894. [DOI] [PubMed] [Google Scholar]
- 29.Brock T, McNish R, Peters-Golden M. J Biol Chem. 1999;274:11660–11666. doi: 10.1074/jbc.274.17.11660. [DOI] [PubMed] [Google Scholar]
- 30.Ushikubi F, Segi E, Sugimoto Y, Murata T, Matsuoka T, Kobayashi T, Hizaki H, Tuboi K, Katsuyama M, Ichikawa A, et al. Nature (London) 1998;395:281–284. doi: 10.1038/26233. [DOI] [PubMed] [Google Scholar]
- 31.Mnich S J, Veenhuizen A W, Monahan J B, Sheehan K C, Lynch K R, Isakson P C, Portanova J P. J Immunol. 1995;155:4437–4444. [PubMed] [Google Scholar]
- 32.Portanova J P, Zhang Y, Anderson G D, Hauser S D, Masferrer J L, Seibert K, Gregory S A, Isakson P C. J Exp Med. 1996;184:883–891. doi: 10.1084/jem.184.3.883. [DOI] [PMC free article] [PubMed] [Google Scholar]


