

Abstract
c-myc is essential for cell homeostasis and growth but lethal if improperly regulated. Transcription of this oncogene is governed by the counterbalancing forces of two proteins on TFIIH—the FUSE binding protein (FBP) and the FBP-interacting repressor (FIR). FBP and FIR recognize single-stranded DNA upstream of the P1 promoter, known as FUSE, and influence transcription by oppositely regulating TFIIH at the promoter site. Size exclusion chromatography coupled with light scattering reveals that an FIR dimer binds one molecule of single-stranded DNA. The crystal structure confirms that FIR binds FUSE as a dimer, and only the N-terminal RRM domain participates in nucleic acid recognition. Site-directed mutations of conserved residues in the first RRM domain reduce FIR's affinity for FUSE, while analogous mutations in the second RRM domain either destabilize the protein or have no effect on DNA binding. Oppositely oriented DNA on parallel binding sites of the FIR dimer results in spooling of a single strand of bound DNA, and suggests a mechanism for c-myc transcriptional control.
Keywords: c-myc, FBP interacting repressor, gene transcription, RRM domain, X-ray crystallography
Introduction
The biological repercussions of c-myc expression are far reaching and determine cell fate. Disturbances in c-myc regulation and function are frequent observations in human malignancy (Dang et al, 1999), and the cellular targets of MYC encompass many major biochemical and regulatory processes in the cell (Fernandez et al, 2000; Orian et al, 2003). These observations imply that transcription of this oncogene must be closely regulated. FUSE-binding protein (FBP) binds to an AT-rich single-stranded DNA (ssDNA) sequence upstream of the P1 promoter known as the Far Upstream Element (FUSE). During transcription initiation, FUSE melts due to torsional stress (Duncan et al, 1994) and is recognized by FBP (Michelotti et al, 1996), a powerful stimulator of the p89 helicase of transcription factor IIH (TFIIH), thereby activating c-myc transcription (He et al, 2000). The nucleic acid-binding region of FBP is comprised of four central K homology (KH) motifs, which recognize melted FUSE. The three dimensional solution structure and molecular dynamics of the third and fourth KH domains of FBP bound to a 29 ssDNA sequence from FUSE determined by NMR spectroscopy demonstrates that FBP binds FUSE in an extended, linear protein–DNA complex in which the DNA is in an extended B-form conformation (Braddock et al, 2001, 2002b).
Counterbalancing FBP's effects on c-myc transcription is the FBP-interacting repressor (FIR), which binds FBP, FUSE and TFIIH, and returns c-myc transcription to basal levels (Liu et al, 2000). FIR is a 542-amino-acid protein possessing a central nucleic acid-binding domain comprised of two RRMs, and an N-terminal domain that represses activated, but not basal, c-myc transcription. In the presence of FBP, FIR is an overriding negative regulator of c-myc (Liu et al, 2001), functioning by neutralizing FBP's stimulation of the p89/XPB 3′–5′helicase of TFIIH by an as yet undescribed mechanism. Mutants of TFIIH, defective in FIR binding, are seen in the hereditary neoplastic syndrome xeroderma pigmentosum (Liu et al, 2001, 2006). A splice variant of FIR within the N-terminal repression domain was recently identified in human colorectal cancers but not in adjacent normal tissue (Matsushita et al, 2006), underscoring FIR's role in c-myc regulation. In addition to its role in gene regulation, splice variants of FIR and its rat homologues have been implicated in RNA-splicing reactions (Page-McCaw et al, 1999; Poleev et al, 2000; Zhou et al, 2002), while the Drosophila homologue, Half-Pint (HFP), which regulates Drosophila c-myc expression and the cell cycle (Quinn et al, 2004), may also regulate splicing of a subset of ovarian genes during development (Van Buskirk and Schupbach, 2002).
Domain truncation experiments reveal that FIR interacts with TFIIH via the N-terminal 55 amino acids (Liu et al, 2000), with FBP via two central RRM domains and with FUSE via the same RRM domains (Chung et al, 2006). Although both FBP and FIR bind FUSE, the degree to which they compete for binding is not known. Previous studies identified binding sequences on FUSE for the third and fourth KH domains of FBP, but the exact FIR-binding sequences remain unknown. In order to define FIR's interactions with FUSE, and as a prelude to understanding FIR's activator-selective repression of c-myc, we conducted biophysical and biochemical experiments on the first two RRM domains of FIR with 27 bases of FUSE (referred to as H27) and determined the structure of this FIR construct bound to a 25-base sequence of FUSE (H25).
Results
NMR analysis of the FIR:H27 complex
A 216-amino-acid protein (hereafter referred to as FIR1+2) consisting of the two central RRM domains of human FIR (accession code AF217197), residues 101–299, preceded by a His-tag, was expressed and purified for biochemical, biophysical and crystallization experiments (see Materials and methods). To evaluate the folding, stability and complex formation of our samples, NMR experiments were performed on FIR1+2 in the presence and absence of a 27-nucleotide ssDNA corresponding to c-myc −1561 to −1535 (Figure 1A); this sequence was previously demonstrated to form a complex with FIR1+2, but the nucleotides involved in direct interactions are unknown (H-J Chung and D Levens, unpublished observation). Protein–DNA complexes were isolated from unbound components, and 15N–1H HSQC spectra were acquired of the protein–ssDNA complex with and without transverse optimized spectroscopy (TROSY) pulse sequences (Supplementary Figure 1A). The increased signal to noise and modest line width reduction with the use of TROSY suggested that the FIR1+2:H27 complex was larger than a 1:1 complex (see Supplementary data). To determine if this was indeed the case, we examined the oligomeric state of FIR1+2 in the presence and absence of H27 using size-exclusion chromatography (SEC) with light scattering (LS).
Figure 1.

Sequence and solution characterization of FIR1+2:FUSE complex (A) Sequence of protein and DNA constructs used in this study. The sequence and secondary structure of FIR1+2 corresponding to human FIR residues 101–299 is shown. The corresponding sequences of PUF60 and Siah-BP are identical to FIR RRM1+2. The RRM domains are colored in red, and residues mutated from Cys are colored in blue. The sequence of each RNP1 is boxed, and the sequence of each RNP2 is underlined in each RRM domain. (B) Oligomeric state of FIR–DNA complex from SEC-UV/LS/RI analysis. Weight-average MWs determined from SEC-UV/LS/RI analyses are plotted as filled triangles for FIR–DNA complex and open triangles for FIR protein alone. Averages and standard deviations were calculated from 25 MW determinations for the top 0.2 ml of the eluting peaks for which the concentration is within 5% of the plotted value.
Oligomerization of FIR in solution
The oligomerization of FIR and its dependence on DNA binding was determined using SEC coupled with LS, refractive index (RI) and absorbance (UV) detection (SEC-LS/RI/UV). A series of SEC-LS/RI/UV measurements at various loading concentrations of equimolar FIR1+2 and H27, or FIR1+2 protein alone were collected. Although FIR1+2 remains monomeric at concentrations up to 120 μM, the molecular weight (MW) of FIR1+2:DNA complex reaches 58 kDa at 111 μM (Figure 1B), in agreement with an expected MW of 55 kDa for FIR1+2:DNA complex of 2:1 stoichiometry. This stoichiometry was confirmed by an online measurement of extinction coefficient for FIR1+2:DNA complex (Wen et al, 1996). Namely, to differentiate between 2:1 and 2:2 stoichiometry, with MW of 55 and 64 kDa respectively, we used the (UV)/(RI) ratio, which is directly proportional to the weight-extinction coefficient, A2950.1% (ml/mg cm), for the absorbance at 295 nm of a 1 mg/ml solution at a 1-cm path length (Wen et al, 1996). Because the observed UV/RI ratio for the DNA fragment used is 18 times higher than that of FIR1+2, the FIR1+2:H27 complex with 2:2 stoichiometry would produce a UV/RI ratio 1.5 times higher than a complex with 2:1 stoichiometry. The observed UV/RI ratio for FIR:DNA complex at the highest concentration tested is consistent with the absorbance expected for the 2:1 stoichiometry. Interestingly, at an FIR1+2:H27 concentration of 4 μM the weight-average MW of the complex decreases to 30 kDa and the UV/RI ratio increase ∼2-fold, suggesting that the FIR:DNA dissociation produces a 1:1 FIR:DNA complex as an intermediate in the FIR dimerization induced by DNA binding.
The FIR1+2:H27 complex was stable and well ordered in solution as evaluated by NMR, but ill-suited for full structure determination by standard multidimensional NMR techniques due to size limitations, revealed in the NMR and LS experiments. Therefore, structure determination proceeded with X-ray crystallography.
A structurally unique dimer interface
Crystals of the FIR1+2 protein complexed to ssDNA were grown and optimized by shortening the DNA strand two nucleotides (to H25, Figure 1A) to decrease crystal mosaicity. FIR1+2:H25 crystals diffracted to 2.1 Å, belonged to space group P31, and contained two protein molecules and one DNA strand per asymmetric unit. Selenomethionine protein:DNA complex crystals were prepared and a multiple-wavelength anomalous dispersion (MAD) data set was collected at the National Synchrotron Light Source at Brookhaven National Laboratory. The structure was solved to 2.6 Å with the MAD data and refined to 2.1 Å against the native data to an R=25.8%/Rfree=29.5%. Additional crystallographic statistics are presented in Table I.
Table 1. Crystallographic statistics.
| MAD data | |||
| Wavelength (Å) | 0.9794 | 0.9798 | 0.9600 |
| Unique refl. (total refl.) | 22 625 (126 675) | 22 692 (128 330) | 22 908 (128 321) |
| Resolution (Å) (highest shell) | 50–2.6 (2.69–2.6) | 50–2.6 (2.69–2.6) | 50–2.6 (2.69–2.6) |
| Rsym (highest shell) | 0.068 (0.284) | 0.069 (0.272) | 0.067 (0.410) |
| 〈I〉/〈σ〉 (highest shell) | 18.4 (4.5) | 17.4 (4.8) | 18.8 (3.8) |
| Completeness, % (highest shell) | 98.4 (99.6) | 99.4 (100.0) | 99.6 (100.0) |
| Mean figure of merit | |||
| Before density modification | 0.561 | ||
| After density modification | 0.715 | ||
| Native data | |||
| Wavelength (Å) | 1.1000 | ||
| Unique refl. (total refl.) | 20 889 (106 953) | ||
| Resolution (Å) (highest shell) | 50–2.1 (2.18–2.1) | ||
| Rsym (highest shell) | 0.059 (0.370) | ||
| 〈I〉/〈σ〉 (highest shell) | 21.8 (2.26) | ||
| Completeness, % (highest shell) | 97.5 (92.2) | ||
| Refinement | |||
| Space group | P31 | ||
| Unit cell | a=b=63.135 Å, c=82.589 Å, α=β=90°, γ=120° | ||
| Resolution (Å) | 2.1 | ||
| Rwork/Rfree | 25.8/29.5% | ||
| r.m.s.d. bond lengths (Å) | 0.012 | ||
| r.m.s.d. bond angles (deg) | 1.9 | ||
| Average B-factors (Å2) | |||
| Total | 54.588 | ||
| Protein | 54.073 | ||
| DNA | 92.251 | ||
| Water | 53.418 | ||
The overview of the FIR RRM1+2:H25 structure is shown in Figure 2. The protein binds DNA as a dimer in which only the N-terminal RRM domain of each subunit interacts with ssDNA. The protein monomers are packed head to head and rotated 180° about their long axes such that the nucleic acid-binding domains of the symmetry-related chains face in opposite directions. The protein binds ssDNA as a dimer with a unique subunit interface and buries 1169 Å2 of pairwise surface area. The rotation about the twofold axis juxtaposes identical RRM secondary structural elements at the dimer interface so that the RRM1 domains contact each other at their fourth β-strand and in the loop between the second α-helix and the fourth β-strand, while the C-terminal RRM domains (RRM2) form dimer contacts at their second α-helices. The dimerization interface between the β-strands in RRM1 are antiparallel to one another, while the dimerization contacts between the α-helices in RRM2 cross each other at about a 135° angle with respect to their long axes.
Figure 2.

Structure of FIR1+2 bound to FUSE DNA. (A) Ribbon representation showing the domain organization. RRM domains 1 and 2 of subunit A are in red and magenta, respectively. RRM domains 1 and 2 of subunit B are in blue and cyan, respectively. DNA is shown in purple. Residues 147–150 and 179 of subunit A, where electron density is poor, are not included in the figure. The view on the right is rotated 90° from that on the left. The two-fold axis relating the two subunits is in the plane of the page in both views. (B) Stereo-view of 1.0σ2Fo–Fc electron density of a portion of the protein from the β1-strand of RRM2 (subunit B). This figure and parts of Figure 7 were prepared using Molscript and Bobscript (Kraulis, 1991; Merritt and Bacon, 1997).
The dimer interface is stabilized by a moderate number of hydrogen bonds (Figure 3). In the C-terminal RRM domain, hydrogen bonds are formed between the side chain amide of Gln264 and both the main-chain oxygen and side-chain hydroxyl of Ser268 of the other subunit (Figure 3A). The two N-terminal RRM domains form an intricate network of hydrogen bonds (Figure 3B) involving the side chains of Asn174 (both subunits) and Lys184 (one subunit) and main chain atoms of Val185 (both subunits).
Figure 3.

Intersubunit interactions in the FIR–HJ25 complex. (A) The intersubunit interactions involving the RRM2 domains are shown (right) looking toward the surface in the direction of the arrow in the left panel. (B) Hydrogen bonding network involving RRM1 in the subunit interface, showing the participation of Asn 174 and Lys 184. The orientation is with the DNA-binding region toward the top. This figure was prepared using Molscript.
Although there are eight hydrogen bonds between the dimer interface, the complementarity among the monomer surfaces is not ideal. We performed a sequence alignment with all other RRM domains that bind nucleic acids whose structures are known and found the protein sex-lethal possesses all four residues having side chains involved in hydrogen bonds across the interface and that another RRM protein, HuD, has two of these four residues (Figure 4A). Similar to FIR, both of these contain two tandem RRM domains. However, both sex-lethal and HuD are monomers in the presence of nucleic acid. To investigate the structural basis of the difference in oligomeric state between FIR and the sex-lethal and HuD structures, we superimposed the Cαs of the RRM1 domains of FIR and sex-lethal and found a different orientation and location for the RRM2 domains (Figure 4B). (Superposition of the Cαs of the RRM1 domains of FIR and HuD is similar to that of sex-lethal). We analyzed the structure and sequences of FIR, sex-lethal and HuD to find what leads to the dramatic differences in domain topology within the subunits and the dimerization of FIR. We found one major difference between the FIR1+2 and the two other proteins. The linker between RRM1 and RRM2 in FIR is a long α-helix (Figure 4) relative to the short linkers in sex-lethal and HuD, which have no specific secondary structure. The linker α-helix of FIR1+2 interacts with a long N-terminal α-helix, resulting in a totally different positioning of the second RRM domain, allowing for a long, relatively flat dimer-forming surface, which is absent in sex-lethal and HuD. This surface has a weak propensity to form a dimer, and the interaction of two protein monomers with a single strand of DNA increases the local concentration of the protein such that dimerization occurs.
Figure 4.

Comparison of FIR with monomeric tandem RRM domain proteins. (A) Sequence alignment showing the RRM domains in FIR1+2 and the corresponding amino acids in the D. melanogaster protein sex-lethal and in the human HuD antigen (also known as ELAV-like protein 4). Highlighted in purple are the RNP1 and two central nucleic –acid-interacting residues of RRM1, and in cyan those of RRM2. In gray are the residues corresponding to those in FIR that form hydrogen bonds across the subunit interface. In pink is the linker region between the two RRM domains. (B) Structural overlay of Drosophila sex-lethal (PDB entry 1B7F) on the FIR1+2 dimer. The overlay was performed by least-squares superposition of α-carbons in the first RRM domain of sex-lethal onto the corresponding α-carbons of the first RRM domain of a subunit of FIR. The nucleic acid from both structures is omitted for clarity. This, as well as Figures 5 and 7C, was prepared using PyMol (DeLano, 2002).
RRM domain packing in the monomer subunit
The C-terminal RRM domain of FIR1+2 interacts extensively with the N-terminal domain, burying a pairwise accessible surface area of about 2000 Å2, the most observed in a dual RRM domain protein structure (Figure 5A and B) and about double that buried in other multi-RRM domain proteins involved in domain interactions (Maris et al, 2005; Vitali et al, 2006; Bae et al, 2007). Residues in the second RRM domain of FIR predicted to participate in nucleic acid binding are instead involved in interdomain contacts with RRM1. Many of these interactions are hydrophobic: Tyr212 with the Cβ and Cγ of Glu164, Tyr252 with Pro137, and Phe254 with Val162 (Figure 5C). The packing of the RRM domains is also stabilized by a network of interdomain salt bridges and hydrogen bonds. A salt bridge between Glu161 and Lys250 contributes to this network between the two domains. The putative RRM2 DNA-binding residue Tyr212 forms a hydrogen bond with the backbone carbonyl of Phe135 and the backbone carbonyl of Pro134 hydrogen bonds with the side-chain hydroxyl of Ser215. The side chain of Gln172 forms two hydrogen bonds: one between the amide group to the side-chain carbonyl of Asn271 and the other between the carbonyl of Gln172 to the guanidine moiety of Arg281.
Figure 5.

RRM–interdomain contacts. (A, B). Surface representations of FIR1+2 contrasting the surface exposure of DNA-recognition residues of the N-terminal RRM domain (RRM 1) to the relative inaccessibility of corresponding residues of RRM 2. In panel A, Tyr115 (yellow) and Phe157 (orange) are both solvent exposed. In panel B, Tyr212 (green) is completely buried and inaccessible to solvent, and Phe254 (purple) is mostly buried. (C) Cartoon and stick representation of the hydrophobic interactions between the two domains. Aromatic residues in the putative nucleic acid-binding site of RRM2 are involved in interdomain hydrophobic contacts. The RRM1 domain is colored blue, and the RRM2 domain is colored cyan, as in Figure 2.
FIR1+2:FUSE binding analyzed by fluorescence anisotropy
Such extensive interactions between the two RRM domains is unprecedented among all known RRM domains containing consensus aromatic residues critical for nucleic acid binding within their two short RNP motifs (Figure 1). To evaluate the participation of RNP sub motifs in FIR1+2 binding, we mutated conserved aromatic residues to leucine. This substitution retains the hydrophobic character of the amino-acid side chain but eliminates π bonding interactions with stacked nucleic acid bases, and therefore is expected to decrease affinity of the protein for nucleic acid if the RNP motif binds nucleic acid.
Alteration of aromatic residues in either RNP motif of RRM1 dramatically affected FUSE binding as determined by fluorescence anisotropy. In accordance with the SEC results, we fit the fluorescence anisotropy data to a model in which two molecules of FIR bind sequentially to two distinct binding sites on FUSE. Wildtype FIR1+2 binds H27 to the first site with a Kd1 of 2.3±1.8 μM (Figure 6) and to the second site with a Kd2 of 74±47 μM, both of which are within the range of reported affinities of individual RRM domains for nucleic acid (10−4–10−6 M) (Zamore et al, 1992; Amrute et al, 1994; Shamoo et al, 1994; Conte et al, 2000). Mutating Tyr115 in the second RNP motif of RRM1 to Leu reduced the affinity for both sites by a factor of 40 and 5–81±31 and 380±110 μM, respectively, while mutating a conserved residue in the first RNP motif of RRM1, Phe157, to Leu also reduced binding by 70- and seven-fold to 140±85 and 490±310 μM, essentially abrogating specific FIR-FUSE interaction (Table II).
Figure 6.

Equilibrium binding affinities of wildtype and mutant FIR determined by fluorescence anisotropy. Steady-state anisotropy of 3′-fluorescein-labeled H27 is plotted as a function of FIR concentration for FIR1+2 wildtype (black squares), Y115L (red circles), F157L (green triangles) and F254L (blue upside-down triangles). Lines depict the best fits of [FIR] dependence of the anisotropy data to equation 3. The equilibrium binding affinities obtained from the best fits of [FIR] dependence of the anisotropy data to equation 3 are presented in Table II.
Table 2. Affinities of WT and mutant FIR1+2 to HH27.
| FIR | r0 | Kd1 | r1 | Kd2 | r2 |
|---|---|---|---|---|---|
| WT | 0.034±0.002 | 2.3±1.8 | 0.065±0.012 | 74±47 | 0.12±0.01 |
| Y115L | 81±31 | * | 380±110 | * | |
| F157L | 140±85 | * | 490±310 | * | |
| F254L | 0.17±0.13 | * | 20±6.7 | * | |
| *Indicates that mutant data were fit by constraining the r0, r1, and r2 values to those of wild type FIR. | |||||
Analogous mutations in the second RRM domain disrupted protein folding, resulting in either insoluble protein that could not be refolded or protein that was stable only within a limited concentration range compared with wildtype. These observations are consistent with our structure, which reveals that the nucleic acid-binding surface of RRM2 is essentially buried in a hydrophobic pocket formed between the two RRM domains (Figure 5). In agreement with this packing arrangement, we found that the protein was intolerant to changes in the completely buried Y212 residue. Mutating the partially buried Phe254 residue was better tolerated and yielded enough metastable protein to perform a limited binding study by fluorescence anisotropy (Figure 6). While we were unable to obtain sufficient quantities of this protein to produce a saturating binding curve, the results up to ∼25 μM protein clearly show that F254L retains high affinities (Kd1, 0.17±0.13 μM; Kd2, 20±6.7 μM) for FUSE, thus confirming that RRM2 of FIR is uninvolved in nucleic acid binding.
Protein–nucleic acid contacts
The crystal structure reveals that only the N-terminal RRM domains participate in nucleic acid recognition. Although only a single base can be modeled with certainty in each binding site, this is sufficient to define the directionality of binding due to the orientation of the deoxyribose rings. In agreement with other known RRM–nucleic acid complexes, the DNA is bound to the RRM β-sheet, with the 5′ end located on the first half (β4β1) of the sheet and the 3′ end on the second half (β3β2) (Figure 7A). The nucleic acid orientation in all RRM domains is conserved, so the dimerization of FIR1+2 oppositely orients the DNA on parallel binding sites of the FIR monomers such that direct threading of ssDNA between the neighboring nucleic acid-binding sites is impossible without looping the DNA.
Figure 7.

(A) Nucleotide stacked against Tyr115 in subunit B, with 1.0σ2Fo–Fc electron density, calculated by omitting the DNA from the model. (B) 2.5σFo–Fc electron density, calculated by omitting the DNA from the model. The adenine stacking against Tyr115 in subunit A is shown. (C) A view of the DNA-binding site centered on the dimeric interface, showing the base stacking of Tyr115 of each subunit with nucleotide. Subunit A is depicted in maroon and subunit B in blue, similar to Figure 2A. (D) View of unmodelled 1.0σ2Fo–Fc electron density corresponding to DNA near Phe157. Shown is subunit B, but unmodelled density is also present in subunit A. (E) Hydrogen bond between adenine and Arg187.
The base recognition of FUSE by FIR is structurally similar to recognized nucleic acid interaction by RRM domains. The RRM consensus sequence of FIR in the N-terminal RRM domain (RRM1) is K-G-F-A-F-V-E-Y (RNP1) and V-Y-V-G-S-I (RNP2). Hydrophobic base stacking interactions between the aromatic ring of Tyr115 (in the second position of RNP2) and DNA are clearly present at the binding site in each subunit (Figure 7B–D). This interaction is typically found in nucleic acid–RRM domain complexes, along with base stacking of the next nucleotide with the fifth residue of RNP1, which is Phe157 in RRM1. Tyr115 base-stacks with Cyt-2 in one subunit and an adenine in the other subunit (Figure 7B and C). This observation agrees with a recent analysis of base recognition by RRM domains, which concludes that a C or A is better accommodated in the RNP2 pocket of the RRM domain (Auweter et al, 2006). Electron density is seen both 3′ and 5′ to each of these bases and electron density corresponding to nucleotide bases stacking with Phe157 of each subunit are present, but the quality is insufficient to reliably model the bases (Figure 7D). However, the nucleotide sequence of H25 has a single CG repeat and three AT repeats, and therefore the FIR dimer binds the sequence CG…AT. The asymmetry of the oligonucleotides in the RRM-binding pocket suggests that a single DNA molecule is bound by an FIR dimer, which is supported by the solvent fraction calculated from a crystal containing either one or two DNA molecules. If an FIR dimer and one molecule of DNA is used in the calculation, the solvent fraction of the crystals is 35%, whereas if two molecules of DNA and a dimer of FIR is used the solvent fraction decreases to 25.9%. The fraction of the crystal volume occupied by solvent in all protein crystals ranges from 78 to 27%, with a rather sharp cutoff at the lower end corresponding to the approximate value for closely packed spheres (Kantardjieff and Rupp, 2003). As protein–DNA crystals with solvent contents lower than 27% are nonexistent, the asymmetric unit almost certainly consists of a single DNA and two FIR molecules. Therefore, the bound adenine and cytosine are interpreted as part of the same oligonucleotide chain. Ade-6 is too close to Gua-3 to allow a single strand to loop across the dimer, but either Ade-13 or Ade-23 is a possibility.
In classical RRM binding, hydrophobic interactions between the aromatic residue at position 3 of RNP1 and the sugar between the dinucleotides are present. In the FIR:FUSE structure this residue (Phe155) packs near this sugar, against the C5′ atom of Cyt-2s DNA backbone, but not to the sugar ring as typically described. Base recognition of the adenine is provided by the main-chain oxygen of Arg187, which accepts a hydrogen bond from the 6-amino group on the adenine ring (Figure 7E). This helped us identify this residue as an adenine as opposed to a guanine, which contains a carbonyl at position 6. The main-chain amide of Ser189, located just C-terminal to the final β4 strand and therefore outside the RRM domain, may form a weak hydrogen bond with the N7 atom of the adenine. The side chain of Ser189 in the other subunit donates a hydrogen bond to the O2 atom of the cytosine.
Discussion
Nucleic acid recognition by FIR
The nucleic acid-binding region of FIR is comprised of two centrally located RRM domains. RRM domains are typically present as multiple copies in nucleic acid-binding proteins, with each RRM domain contributing to the avidity and specificity of the protein for nucleic acid. The arrangement of the RRM domains in the crystal structure of the FIR1+2:H25 complex is surprising because the C-terminal RRM domain does not participate in nucleic acid recognition. Indeed, FIR is the only example of a multi-RRM protein in which one RRM domain participates in nucleic acid binding while the other RRM domain is sequestered in protein contacts.
To validate the nucleic acid binding observed in the crystal structure, we tested the effect of site directed mutations in the DNA-binding region of each RRM. Mutations were chosen to eliminate π stacking interactions between aromatic residues in the protein and DNA, an established mechanism of RRM nucleic acid recognition. Site-directed mutants of the nucleic acid-binding surface of RRM1, which is exposed to solvent (Figure 5A), resulted in severely diminished nucleic acid-binding. Analogous mutations in the second RRM domain resulted in poorly soluble protein, consistent with the structure, which indicates that these residues are involved in obligate interdomain protein–protein interactions necessary for protein stability (Figure 5B). One RRM2 mutant was sufficiently stable to be analyzed for nucleic acid binding. The affinity between this mutant, F254L, and DNA was unaltered (Figure 6), demonstrating that the hydrophobic residues of RRM2 are important for the correct folding and stability of FIR but not for nucleic acid recognition.
Tandem RRM domains and nucleic acid-binding surfaces
Single RRM domains generally bind nucleic acid with affinities in the 10−4–10−6 M range, while proteins with multiple RRM domains display affinities much greater (for review see Maris et al, 2005). The exception to this rule is single RRM domains, which bind nucleic acid with hairpin-like structures, which can exhibit very high (nM) affinity (Rimmele and Belasco, 1998; Law et al, 2006; Skrisovska et al, 2007). While one would be tempted to assume that the affinity of a multi-RRM domain protein would be the product of the individual affinities, this turns out to be incorrect. The affinity of combined RRM domains has been experimentally linked to the length of the flexible linker separating the domains—the shorter the linker, the greater the affinity (Shamoo et al, 1995). A mathematical relationship between linker length and ligand affinity has been derived, which allows one to predict the affinity of a dual RRM domain protein given the affinity of the individual domains: 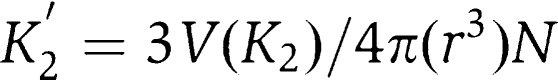 where K2′ is the affinity that would be observed for a second RRM domain had it bound first, r is the mean free radius linking the two RRM domains and N is the number of protein molecules per volume V. According to this model, a dual RRM domain protein with a linker length of 20 residues and an individual Kd of 10−5 M should bind nucleic acid with a dissociation constant of 120 nM, or over an order of magnitude greater than observed for the FIR1+2-FUSE complex. This observation is also consistent with the notion that only a single RRM domain of FIR1+2 is involved in DNA recognition.
In addition to RNA-bound sex-lethal (Handa et al, 1999) and HuD (Wang and Tanaka Hall, 2001), five other structures of tandem RRM proteins bound to nucleic acids have been determined: hnRNP A1 complexed with telomeric ssDNA (Ding et al, 1999), nucleolin bound to an RNA stem loop (Allain et al, 2000), poly(A)-binding protein (PABP) bound to polyadenylate RNA (Deo et al, 1999), all four domains of polypyrimidine tract-binding protein (PTB) complexed with RNA (Oberstrass et al, 2005) and U2AF with a polypyrimidine tract (Sickmier et al, 2006). These complexes can be grouped into two classes—those whose RRM domains closely contact each other to bind nucleic acid and those that do not. The first two RRM domains of PTB, the RRM domains of nucleolin, sex-lethal, HuD and U2AF all bind nucleic acid as independent modules, while the RRM domains of hnRNPA1, PABP and the third and fourth domains of PTB all form interdomain contacts when bound to RNA. Multi-RRM domain proteins that form intersubunit or oligomeric contacts usually do so to extend their nucleic acid-binding surfaces. The RRM domains of hnRNP A1 bound to telomeric DNA, for example, pack in a head to tail arrangement that extends a 5′–3′ nucleic acid polarity across both RRM domains, allowing for continuous binding of ssDNA between subunits. In PABP, the RRM domains of a single subunit associate to form an extended β-platform capable of binding an elongated, contiguous nucleic acid. In PABP, the RRM domains interact burying 550 Å2 of surface area to form a narrow binding trough capable of directly threading nucleic acid from the second RRM domain into the first. The third and fourth RRM domains in the PTB–RNA complex depart from this model. In this structure, the two RRM domains of a subunit associate along their dorsal (α-helical) surfaces, causing their β-sheet surfaces to face in opposite directions from each other such that these contiguous domains are incapable of binding a single extended nucleic acid sequence without looping. Although the dimer interface of FIR is different than that used by the third and fourth domains of PTB, the effect is the same: a single bound oligonucleotide must be looped or spooled to bind two RRM domains.
Models for FIR inhibition of c-myc
c-myc is a lethal oncogene if improperly regulated, yet essential for life. Cells with MYC haploinsufficiency double more slowly than their parent cells, while complete loss of MYC expression in somatic cells severely hampers proliferation (Mateyak et al, 1997). c-myc knockout mice expire at embryonic day 10.5 (Davis et al, 1993), and MYC haploinsufficient mice are viable but grow more slowly and are smaller than their wildtype siblings (Trumpp et al, 2001). At the cellular level, when MYC is either too abundant or too scarce, cellular apoptosis increases (Evan et al, 1992). MYC misregulation alters cell proliferation, cell growth, cell differentiation and cell metabolism, and MYC is a well recognized molecular lesion in multistep carcinogenesis (for review see Dang et al, 1999). The targets of MYC expression include representatives of virtually every biochemical and regulatory pathway in the cell (Menssen and Hermeking, 2002), demonstrating the protein's global importance to organismal fate. All of these observations suggest that there are severe and unforgiving consequences to MYC misregulation.
FBP and FIR are dominant regulators of Myc expression: FBP is potent activator of myc, while FIR returns FBP stimulated myc to basal levels. The following details of c-myc regulation by FBP, FIR and FUSE have been established: FUSE becomes single stranded due to forces generated during c-myc transcription and transcription stalls; FBP binds to single-stranded FUSE and TFIIH, allowing transcription to proceed; and sometime later, FIR binds to FBP, FUSE and TFIIH, reducing c-myc transcription back to basal levels (Liu et al, 2006). The structure of the FIR:FUSE complex reveals that FIR binds FUSE as a dimer, which spools a single bound DNA strand. Analytical LS experiments demonstrate FIR to be a monomer in the absence of DNA and a dimer at higher protein concentrations in the presence of ssDNA. Furthermore, UV/RI ratios reveal that FIR binds DNA with a stoichiometry of 2:1 FIR:FUSE at high concentrations and of 1:1 at lower concentrations. Finally, the asymmetry of the oligonucleotides in the dimeric RRM-binding pockets—one being an AT and the other a CG—also supports the notion that an FIR dimer binds a single strand of DNA in solution. These observations allow us to propose that FIR binds FUSE as a monomer, and then dimerizes as local protein concentrations increase. The dimerization of FIR loops FUSE, inducing a structural reorganization of upstream c-myc effector elements, which favors a reduction of c-myc expression to basal levels.
The structural model presented in Figure 8 is supported by several in vitro and in vivo observations of FBP:FIR:FUSE systems. FIR was discovered because of its ability to interact with FBP (Liu et al, 2000) and the proteins have been demonstrated to interact in vivo (He et al, 2003). Moreover, ChIP analysis shows that FBP and FIR clearly coreside at FUSE in vivo (Liu et al, 2006), and both proteins may be co-immunoprecipitated from cells (Chung et al, 2006). FIR binding and FBP ejection are noted to be temporally linked (Liu et al, 2006). Finally, the biophysical and biochemical experiments presented in this study demonstrate that FIR and FBP bind FUSE in different conformational states of DNA.
Figure 8.

Model of progression in FBP and FIR interaction with FUSE during c-myc transcription. FUSE becomes single stranded upon the initiation of c-myc transcription and is recognized by FBP. Shortly thereafter, FIR binds the FBP/FUSE complex, forming a trimeric complex. Finally, FBP is ejected and FIR forms a long-lived stable complex with FUSE. (A) Molecular dynamic studies of the third and fourth KH domains of FBP bound to FUSE show that FBP binds FUSE as an elongated molecule in which the DNA is flexible but linear (from Braddock et al, 2002a). (B, C) SEC/LS/RI/UV measurements demonstrate that FIR binds FUSE as a monomer at low concentrations, but dimerizes at higher concentrations in the presence of ssDNA. FIR dimerization would change the topology of FUSE, helping to pry the C-terminal activation domain of FBP of TFIIH and facilitate the ejecting FBP from FUSE.
Structural deformations of DNA induced during transcription provide an immediate feedback mechanism for monitoring gene transcription. The conformation of FUSE observed in the repressor FIR:FUSE complex is quite different than in the activator FBP:FUSE complex. The altered DNA conformation suggests that structural changes in FUSE induced by FIR may play a role in the activator-selective inhibition of c-myc. Previous structures of FBP bound to FUSE reveal a flexible, linear protein–DNA complex (Braddock et al, 2002a). The FIR:FUSE structure reveals that FIR alters the linear arrangement of the DNA seen in the FBP:FUSE complex, and therefore conformational changes induced in FUSE by FIR dimerization, may provide leverage to dissociate FBP's C-terminal activation domain from TFIIH, allowing FIR to substitute its N-terminal repression domain on TFIIH (Figure 8). Finally, dimerization of FIR bound to FUSE may provide a locking mechanism stabilizing long-lived FIR:FUSE complexes, which have been reported in time-course CHIP assays (Liu et al, 2006). In a related manner, alternative splicing products and homologues of FIR implicated in RNA splicing, SIAH-BPI and HFP, may utilize dimerization to loop out RNA excised in splicing reaction, as these factors bring distant nucleotides into close proximity for splicing and processing. This mechanism has been proposed for the looping of RNA induced by the third and fourth domains of PTB (Oberstrass et al, 2005). Future structures of FBP:FIR and FBP:FIR:FUSE complexes will provide further insight into this unique means of genetic regulation.
Materials and methods
Cloning and protein expression and purification, complex formation
Nucleotides 311–907 from human FIR cDNA (GenBank accession code AF217197), which correspond to human FIR amino acids 101–299, were cloned into the pET15b protein expression vector with an R to G mutation at amino acid 106. To ease protein handling, cysteine residues in the sequence were replaced by serine (Cys112) and alanine (Cys238) depending on their predicted location in the protein structure (alanine if buried, serine if exposed). Cloning artifacts introduced 17 amino acids at the N-terminus of the protein following cleavage of a histidine tag, of which most are disordered and only one is visible in the final electron density. The protein was expressed in Escherichia coli, strain BL21 (DE3), using standard methods. Further details are provided in Supplementary data.
Synthetic oligonucleotides were purchased from The Midland Certified Reagent Company (Midland, TX). The sequence of the oligonucleotides corresponds to the FUSE element in human c-myc −1561 to −1535 (H27, Figure 1A). H25 was used for structural studies and is identical to H27 but lacks the two terminal 3′ bases (Figure 1). FIR:DNA complexes were formed by mixing the protein and DNA at a 1:1.1 molar ratio, and removing uncomplexed material by gel filtration on a Superdex S 75 column (Amersham Biosciences) in a buffer containing 50 mM Tris, 100 mM NaCL, pH 8.0.
Size exclusion and light scattering
The LS data were collected using a Superdex S-200, 10/30, HR SEC column (GE Healthcare, Piscataway, NJ), connected to an HPLC system, Alliance 2965, (Waters Corp., Milford, MA) equipped with an autosampler. The elution from SEC was monitored by a photodiode array (PDA) UV/VIS detector (996 PDA; Waters Corp.), differential refractometer (OPTI-Lab, or OPTI-rEx Wyatt Corp., Santa Barbara, CA) and static, multiangle laser LS detector (DAWN-EOS; Wyatt Corp., Santa Barbara, CA). The SEC-UV/LS/RI system was equilibrated in 20 mM HEPES, pH 8.0, 150 mM NaCl, 1 mM EDTA buffer at the flow rate of 0.5 ml/min. The MW determination in SEC-UV/LS/RI measurement depends only on the signals from downstream LS and RI detectors (Folta-Stogniew and Williams, 1999; details presented in Supplementary data), and is independent of the elution position; SEC is used solely as a fractionation step to separate various oligomers or complexes. Thus, unusual elution because of non-globular shape or interactions with the SEC support has no impact on the MW determination by SEC-UV/LS/RI (Folta-Stogniew and Williams, 1999). Further details regarding the conversion of LS to concentration and weight average MWs, relationship of the refractive index to the molar mass of the complex, and other details are described in the Supplementary data.
Fluorescence anisotropy
Binding of wildtype and mutant FIR RRM1+2 to FUSE DNA was monitored by a change in the steady-state anisotropy of a 3′ fluorescein-labeled 27-mer sequence from the 3′ end of FUSE previously demonstrated to interact with FIR (sequence: 5′CCTCGGGATTTTTTATTTTGTGTTATT-3′), hereafter referred to as H27. Experiments conducted with the fluorescent probe at the 5′ end of the oligonucleotide yielded identical results (not shown). The concentration of DNA was kept constant at 50 nM, while the concentration of protein was varied from 0 to ∼400 μM. Samples were prepared in a buffer of 50 mM Tris–HCl, 150 mM NaCl, 20 μM EDTA, pH 8.0 and equilibrated at room temperature for at least 30 min before measurements were taken on a two-channel fluorometer (Photon Technology International Alphascan, Birmingham, NJ). Excitation was at 485 nm and emission was collected at 530 nm with 4-nm slit widths. Further details regarding the anisotropy measurements are available in the Supplementary data.
Crystallization and X-ray data collection
Crystals of the FIR1+2:H25 complex grew from hanging drops of 0.1 M Tris–HCl, 32% PEG 4000, pH 8.5 at room temperature in 7 days after the protein solution (20 mg/ml, 20 mM Tris–HCl, pH 8.0, 100 mM NaCl) was mixed with an equal volume of the reservoir solution. MAD and native data were collected at Brookhaven National Light Source Beam X25. The crystals were flash frozen in liquid nitrogen without cryoprotection, mounted directly onto the beamline, and annealed prior to data collection by interrupting the stream of nitrogen for 3 s. All three MAD data sets (peak, inflection and remote wavelength) were collected from one crystal at 100 K. Each data set has 120 frames with an oscillation angle of 1.5 degree. All data sets were processed using HKL2000 (Otwinowski and Minor, 1997).
Solvent fraction calculation
The solvent content was calculated from the Mathews coefficient using the partial specific volume of the separate protein and DNA constituents according to the method of Matthews as modified by Kantardjieff and Rupp (Matthews, 1968; Kantardjieff and Rupp, 2003).
Structure determination and sequence alignment
SOLVE (Terwilliger and Berendzen, 1999) was employed directly on the processed MAD data from HKL2000, and successfully found 10 selenium sites. RESOLVE (Terwilliger, 1999) was subsequently employed for solvent modification and NCS identification. RESOLVE unambiguously found a twofold axis and the resulting electron density map at 3.0 Å clearly revealed protein structural features so that β-strands and α-helices could be virtually identified. The program Arp/warp (Perrakis et al, 1997) was employed to build the model. Eventually, Arp/warp built half the model, and the rest of the model was built manually using the programs O (Jones et al, 1991) and COOT (Emsley and Cowtan, 2004). Structure refinement was performed with REFMAC5 (Murshudov et al, 1997) and CNS. After the 2.6-Å model was built, the native data set was used to refine the structure to 2.1 Å using CNS. The twinning fraction was found to be 0.49 using CNS. The crystal was treated as a perfect twin, and the data accordingly detwinned using CNS. The atomic coordinates of the FIR1+2:H25 complex have been deposited with the Brookhaven Protein Data Bank (PDB code 2QFJ).
ClustalW (Thompson et al, 1994) was used for the sequence alignment among FIR1+2, sex-lethal and HuD. The alignment found by the program was compared to structural overlays of sex-lethal and FIR1+2, and, accordingly, slight modifications to the alignment were manually performed in the region linking the two RRM domains to reflect the true structural alignment of those residues. Structural overlays were performed using LSQKAB (Kabsch, 1976) in the CCP4 software package.
Supplementary Material
Supplementary Figure 1
Supplementary Information
Acknowledgments
We gratefully acknowledge CL Kielkopf and Juhong Liu for helpful discussions, and the beamline staff at X25, National Synchrotron Light Source, Brookhaven National Laboratory, for helping with data collection and retrieval, and Dr Frank Delaglio for the preparation of all NMR figures. DTB acknowledges the course directors of the CSHL 2006 X-ray Methods in Structural Biology (James Pflugrath, Alexander McPherson and Gary Gillian) for invaluable support and technical advice. This work was supported in part by the American Cancer Society, RSG-0-222-01 (DTB), the NSF (MCB-0546353), American Heart Association (0655849T) and NIH (GM071688) (EMDLC). KBF is supported by a Howard Hughes Medical Institute Predoctoral Fellowship. EFS is supported in part by NHLBI/NIH contract N01-HV-28186 and NIDA/NIH grant 1 P30 DA018343-01. GVC was supported by NIH training grant T32 CA09085.
References
- Allain FH, Gilbert DE, Bouvet P, Feigon J (2000) Solution structure of the two N-terminal RNA-binding domains of nucleolin and NMR study of the interaction with its RNA target. J Mol Biol 303: 227–241 [DOI] [PubMed] [Google Scholar]
- Amrute SB, Abdul-Manan Z, Pandey V, Williams KR, Modak MJ (1994) Purification and nucleic acid binding properties of a fragment of type C1/C2 heterogeneous nuclear ribonucleoprotein from thymic nuclear extracts. Biochemistry 33: 8282–8291 [DOI] [PubMed] [Google Scholar]
- Auweter SD, Oberstrass FC, Allain FH (2006) Sequence-specific binding of single-stranded RNA: is there a code for recognition? Nucleic Acids Res 34: 4943–4959 [DOI] [PMC free article] [PubMed] [Google Scholar]
- Bae E, Reiter NJ, Bingman CA, Kwan SS, Lee D, Phillips GN Jr, Butcher SE, Brow DA (2007) Structure and interactions of the first three RNA recognition motifs of splicing factor prp24. J Mol Biol 367: 1447–1458 [DOI] [PMC free article] [PubMed] [Google Scholar]
- Braddock DT, Baber JL, Levens D, Clore GM (2002a) Molecular basis of sequence-specific single-stranded DNA recognition by KH domains: solution structure of a complex between hnRNP KKH3 and single-stranded DNA. EMBO J 21: 3476–3485 [DOI] [PMC free article] [PubMed] [Google Scholar]
- Braddock DT, Cai ML, Baber JL, Huang Y, Clore GM (2001) Rapid identification of medium- to large-scale interdomain motion in modular proteins using dipolar couplings. J Am Chem Soc 123: 8634–8635 [DOI] [PubMed] [Google Scholar]
- Braddock DT, Louis JM, Baber JL, Levens D, Clore GM (2002b) Structure and dynamics of KH domains from FBP bound to single-stranded DNA. Nature 415: 1051–1056 [DOI] [PubMed] [Google Scholar]
- Chung HJ, Liu J, Dundr M, Nie Z, Sanford S, Levens D (2006) FBPs are calibrated molecular tools to adjust gene expression. Mol Cell Biol 26: 6584–6597 [DOI] [PMC free article] [PubMed] [Google Scholar]
- Conte MR, Grune T, Ghuman J, Kelly G, Ladas A, Matthews S, Curry S (2000) Structure of tandem RNA recognition motifs from polypyrimidine tract binding protein reveals novel features of the RRM fold. EMBO J 19: 3132–3141 [DOI] [PMC free article] [PubMed] [Google Scholar]
- Dang CV, Resar LMS, Emison E, Kim S, Li Q, Prescott JE, Wonsey D, Zeller K (1999) Function of the c-Myc oncogenic transcription factor. Exp Cell Res 253: 63–77 [DOI] [PubMed] [Google Scholar]
- Davis AC, Wims M, Spotts GD, Hann SR, Bradley A (1993) A null c-myc mutation causes lethality before 10.5 days of gestation in homozygotes and reduced fertility in heterozygous female mice. Genes Dev 7: 671–682 [DOI] [PubMed] [Google Scholar]
- DeLano WL (2002) The PyMOL Molecular Graphics System. Palo Alto, CA: DeLano Scientific, http://www.pymol.org [Google Scholar]
- Deo RC, Bonanno JB, Sonenberg N, Burley SK (1999) Recognition of polyadenylate RNA by the poly(A)-binding protein. Cell 98: 835–845 [DOI] [PubMed] [Google Scholar]
- Ding J, Hayashi MK, Zhang Y, Manche L, Krainer AR, Xu RM (1999) Crystal structure of the two-RRM domain of hnRNP A1 (UP1) complexed with single-stranded telomeric DNA. Genes Dev 13: 1102–1115 [DOI] [PMC free article] [PubMed] [Google Scholar]
- Duncan R, Bazar L, Michelotti G, Tomonaga T, Krutzsch H, Avigan M, Levens D (1994) Sequence-specific, single-strand binding-protein activates the far upstream element of c-Myc and defines a new DNA-binding motif. Genes Dev 8: 465–480 [DOI] [PubMed] [Google Scholar]
- Emsley P, Cowtan K (2004) Coot: model-building tools for molecular graphics. Acta Crystallogr D 60: 2126–2132 [DOI] [PubMed] [Google Scholar]
- Evan GI, Wyllie AH, Gilbert CS, Littlewood TD, Land H, Brooks M, Waters CM, Penn LZ, Hancock DC (1992) Induction of apoptosis in fibroblasts by c-myc protein. Cell 69: 119–128 [DOI] [PubMed] [Google Scholar]
- Fernandez EJ, Wilken J, Thompson DA, Peiper SC, Lolis E (2000) Comparison of the structure of vMIP-II with eotaxin-1, RANTES, and MCP-3 suggests a unique mechanism for CCR3 activation. Biochemistry 39: 12837–12844 [DOI] [PubMed] [Google Scholar]
- Folta-Stogniew E, Williams KR (1999) Determination of molecular masses of proteins in solution: implementation of an HPLC size exclusion chromatography and laser light scattering service in a core laboratory. J Biomol Tech 10: 51–63 [PMC free article] [PubMed] [Google Scholar]
- Handa N, Nureki O, Kurimoto K, Kim I, Sakamoto H, Shimura Y, Muto Y, Yokoyama S (1999) Structural basis for recognition of the tra mRNA precursor by the Sex-lethal protein. Nature 398: 579–585 [DOI] [PubMed] [Google Scholar]
- He L, Bradrick TD, Karpova TS, Wu X, Fox MH, Fischer R, McNally JG, Knutson JR, Grammer AC, Lipsky PE (2003) Flow cytometric measurement of fluorescence (Forster) resonance energy transfer from cyan fluorescent protein to yellow fluorescent protein using single-laser excitation at 458 nm. Cytometry A 53: 39–54 [DOI] [PubMed] [Google Scholar]
- He LS, Liu JH, Collins I, Sanford S, O'Connell B, Benham CJ, Levens D (2000) Loss of FBP function arrests cellular proliferation and extinguishes c-myc expression. EMBO J 19: 1034–1044 [DOI] [PMC free article] [PubMed] [Google Scholar]
- Jones TA, Zou JY, Cowan SW, Kjeldgaard M (1991) Improved methods for building protein models in electron density maps and the location of errors in these models. Acta Crystallogr A 47 (Part 2): 110–119 [DOI] [PubMed] [Google Scholar]
- Kabsch W (1976) A solution for the best rotation to relate two sets of vectors. Acta Crystallogr A 32: 922–923 [Google Scholar]
- Kantardjieff KA, Rupp B (2003) Matthews coefficient probabilities: improved estimates for unit cell contents of proteins, DNA, and protein–nucleic acid complex crystals. Protein Sci 12: 1865–1871 [DOI] [PMC free article] [PubMed] [Google Scholar]
- Kraulis PJ (1991) MOLSCRIPT: A program to produce both detailed and schematic plots of protein structures. J Appl Crystallogr 24: 946–950 [Google Scholar]
- Law MJ, Rice AJ, Lin P, Laird-Offringa IA (2006) The role of RNA structure in the interaction of U1A protein with U1 hairpin II RNA. RNA 12: 1168–1178 [DOI] [PMC free article] [PubMed] [Google Scholar]
- Liu J, Kouzine F, Nie Z, Chung HJ, Elisha-Feil Z, Weber A, Zhao K, Levens D (2006) The FUSE/FBP/FIR/TFIIH system is a molecular machine programming a pulse of c-myc expression. EMBO J 25: 2119–2130 [DOI] [PMC free article] [PubMed] [Google Scholar]
- Liu JH, Akoulitchev S, Weber A, Ge H, Chuikov S, Libutti D, Wang XW, Conaway JW, Harris CC, Conaway RC, Reinberg D, Levens D (2001) Defective interplay of activators and repressors with TFIIH in xeroderma pigmentosum. Cell 104: 353–363 [DOI] [PubMed] [Google Scholar]
- Liu JH, He LS, Collins I, Ge H, Libutti D, Li JF, Egly JM, Levens D (2000) The FBP interacting repressor targets TFIIH to inhibit activated transcription. Mol Cell 5: 331–341 [DOI] [PubMed] [Google Scholar]
- Maris C, Dominguez C, Allain FH (2005) The RNA recognition motif, a plastic RNA-binding platform to regulate post-transcriptional gene expression. FEBS J 272: 2118–2131 [DOI] [PubMed] [Google Scholar]
- Mateyak MK, Obaya AJ, Adachi S, Sedivy JM (1997) Phenotypes of c-Myc-deficient rat fibroblasts isolated by targeted homologous recombination. Cell Growth Differ 8: 1039–1048 [PubMed] [Google Scholar]
- Matsushita K, Tomonaga T, Shimada H, Shioya A, Higashi M, Matsubara H, Harigaya K, Nomura F, Libutti D, Levens D, Ochiai T (2006) An essential role of alternative splicing of c-myc suppressor FUSE-binding protein-interacting repressor in carcinogenesis. Cancer Res 66: 1409–1417 [DOI] [PubMed] [Google Scholar]
- Matthews BW (1968) Solvent content of protein crystals. J Mol Biol 33: 491–497 [DOI] [PubMed] [Google Scholar]
- Menssen A, Hermeking H (2002) Characterization of the c-MYC-regulated transcriptome by SAGE: identification and analysis of c-MYC target genes. Proc Natl Acad Sci USA 99: 6274–6279 [DOI] [PMC free article] [PubMed] [Google Scholar]
- Merritt EA, Bacon DJ (1997) Raster3D photorealistic molecular graphics. Methods Enzymol 277: 505–524 [DOI] [PubMed] [Google Scholar]
- Michelotti GA, Michelotti EF, Pullner A, Duncan RC, Eick D, Levens D (1996) Multiple single-stranded cis elements are associated with activated chromatin of the human c-myc gene in vivo. Mol Cell Biol 16: 2656–2669 [DOI] [PMC free article] [PubMed] [Google Scholar]
- Murshudov GN, Vagin AA, Dodson EJ (1997) Refinement of macromolecular structures by the maximum-likelihood method. Acta Crystallogr D 53: 240–255 [DOI] [PubMed] [Google Scholar]
- Oberstrass FC, Auweter SD, Erat M, Hargous Y, Henning A, Wenter P, Reymond L, Amir-Ahmady B, Pitsch S, Black DL, Allain FH (2005) Structure of PTB bound to RNA: specific binding and implications for splicing regulation. Science 309: 2054–2057 [DOI] [PubMed] [Google Scholar]
- Orian A, van Steensel B, Delrow J, Bussemaker HJ, Li L, Sawado T, Williams E, Loo LW, Cowley SM, Yost C, Pierce S, Edgar BA, Parkhurst SM, Eisenman RN (2003) Genomic binding by the Drosophila Myc, Max, Mad/Mnt transcription factor network. Genes Dev 17: 1101–1114 [DOI] [PMC free article] [PubMed] [Google Scholar]
- Otwinowski Z, Minor W (1997) Processing of X-ray diffraction data collected in oscillation mode. Methods Enzymol 276: 307–326 [DOI] [PubMed] [Google Scholar]
- Page-McCaw PS, Amonlirdviman K, Sharp PA (1999) PUF60: a novel U2AF65-related splicing activity. RNA 5: 1548–1560 [DOI] [PMC free article] [PubMed] [Google Scholar]
- Perrakis A, Sixma TK, Wilson KS, Lamzin VS (1997) wARP: improvement and extension of crystallographic phases by weighted averaging of multiple-refined dummy atomic models. Acta Crystallogr D 53: 448–455 [DOI] [PubMed] [Google Scholar]
- Poleev A, Hartmann A, Stamm S (2000) A trans-acting factor, isolated by the three-hybrid system, that influences alternative splicing of the amyloid precursor protein minigene. Eur J Biochem 267: 4002–4010 [DOI] [PubMed] [Google Scholar]
- Quinn LM, Dickins RA, Coombe M, Hime GR, Bowtell DD, Richardson H (2004) Drosophila Hfp negatively regulates dmyc and stg to inhibit cell proliferation. Development 131: 1411–1423 [DOI] [PubMed] [Google Scholar]
- Rimmele ME, Belasco JG (1998) Target discrimination by RNA-binding proteins: role of the ancillary protein U2′ and a critical leucine residue in differentiating the RNA-binding specificity of spliceosomal proteins U1A and U2B″. RNA 4: 1386–1396 [DOI] [PMC free article] [PubMed] [Google Scholar]
- Shamoo Y, Abdul-Manan N, Patten AM, Crawford JK, Pellegrini MC, Williams KR (1994) Both RNA-binding domains in heterogenous nuclear ribonucleoprotein A1 contribute toward single-stranded-RNA binding. Biochemistry 33: 8272–8281 [DOI] [PubMed] [Google Scholar]
- Shamoo Y, Abdul-Manan N, Williams KR (1995) Multiple RNA binding domains (RBDs) just don't add up. Nucleic Acids Res 23: 725–728 [DOI] [PMC free article] [PubMed] [Google Scholar]
- Sickmier EA, Frato KE, Shen H, Paranawithana SR, Green MR, Kielkopf CL (2006) Structural basis of polypyrimidine tract recognition by the essential pre-mRNA splicing factor, U2AF65. Mol Cell 23: 49–59 [DOI] [PMC free article] [PubMed] [Google Scholar]
- Skrisovska L, Bourgeois CF, Stefl R, Grellscheid SN, Kister L, Wenter P, Elliott DJ, Stevenin J, Allain FH (2007) The testis-specific human protein RBMY recognizes RNA through a novel mode of interaction. EMBO Rep 8: 372–379 [DOI] [PMC free article] [PubMed] [Google Scholar]
- Terwilliger TC (1999) Reciprocal-space solvent flattening. Acta Crystallogr D 55: 1863–1871 [DOI] [PMC free article] [PubMed] [Google Scholar]
- Terwilliger TC, Berendzen J (1999) Automated MAD and MIR structure solution. Acta Crystallogr D 55 (Part 4): 849–861 [DOI] [PMC free article] [PubMed] [Google Scholar]
- Thompson JD, Higgins DG, Gibson TJ (1994) CLUSTAL W: improving the sensitivity of progressive multiple sequence alignment through sequence weighting, position-specific gap penalties and weight matrix choice. Nucl Acids Res 22: 4673–4680 [DOI] [PMC free article] [PubMed] [Google Scholar]
- Trumpp A, Refaeli Y, Oskarsson T, Gasser S, Murphy M, Martin GR, Bishop JM (2001) c-Myc regulates mammalian body size by controlling cell number but not cell size. Nature 414: 768–773 [DOI] [PubMed] [Google Scholar]
- Van Buskirk C, Schupbach T (2002) Half pint regulates alternative splice site selection in Drosophila. Dev Cell 2: 343–353 [DOI] [PubMed] [Google Scholar]
- Vitali F, Henning A, Oberstrass FC, Hargous Y, Auweter SD, Erat M, Allain FH (2006) Structure of the two most C-terminal RNA recognition motifs of PTB using segmental isotope labeling. EMBO J 25: 150–162 [DOI] [PMC free article] [PubMed] [Google Scholar]
- Wang XM, Tanaka Hall TM (2001) Structural basis for recognition of AU-rich element RNA by the HuD protein. Nat Struct Biol 8: 141–145 [DOI] [PubMed] [Google Scholar]
- Wen J, Arakawa T, Talvenheimo J, Welcher AA, Horan T, Kita Y, Tseng J, Nicolson M, Philo JS (1996) Techniques in Protein Chemistry. San Diego: Academic [Google Scholar]
- Zamore PD, Patton JG, Green MR (1992) Cloning and domain structure of the mammalian splicing factor U2AF. Nature 355: 609–614 [DOI] [PubMed] [Google Scholar]
- Zhou Z, Licklider LJ, Gygi SP, Reed R (2002) Comprehensive proteomic analysis of the human spliceosome. Nature 419: 182–185 [DOI] [PubMed] [Google Scholar]
Associated Data
This section collects any data citations, data availability statements, or supplementary materials included in this article.
Supplementary Materials
Supplementary Figure 1
Supplementary Information