Abstract
Recent advances in coherent Raman spectroscopy hold exciting promise for many potential applications. For example, a technique, mitigating the nonresonant four-wave-mixing noise while maximizing the Raman-resonant signal, has been developed and applied to the problem of real-time detection of bacterial endospores. After a brief review of the technique essentials, we show how extensions of our earlier experimental work [Pestov D, et al. (2007) Science 316:265–268] yield single-shot identification of a small sample of Bacillus subtilis endospores (≈104 spores). The results convey the utility of the technique and its potential for “on-the-fly” detection of biohazards, such as Bacillus anthracis. The application of optimized coherent anti-Stokes Raman scattering scheme to problems requiring chemical specificity and short signal acquisition times is demonstrated.
Keywords: biohazard, CARS, hybrid, technique, identification
In recent years, local as well as remote real-time detection and identification of warfare agents has become vital. Whereas the detection of warfare chemical compounds, such as nerve gases (1) and explosives (2), has been developed, there is still an apparent need for satisfactory detection technology targeting biohazards, like Bacillus anthracis. A number of optical techniques have been considered as alternatives to well established but cumbersome and time-consuming biological methods (for a review, see ref. 3). In particular, the Raman spectra of endospores have been characterized as their “fingerprints.” Detection schemes based on conventional spontaneous Raman spectroscopy (4–9) and surface-enhanced Raman spectroscopy (SERS) (see, e.g., ref. 10) have been reported. For 1.4 × 10³ spores, a data collection time as low as 10 s has been achieved (11). In this article, we consider a complementary approach, coherent anti-Stokes Raman scattering (CARS) spectroscopy (12, 13), and demonstrate the acquisition of a CARS spectrum from ≈104 Bacillus subtilis spores in a single laser shot.
The use of CARS for spore detection was suggested several years ago (14). A set of femtosecond adaptive spectroscopic techniques for CARS (FAST CARS), including electronic-resonance-enhanced coherent Raman scattering (15, 16), laser pulse shaping (17), and timing, was proposed and analyzed. The authors showed how to boost the CARS efficiency and discussed possible strategies for real-time bacterial spore detection.
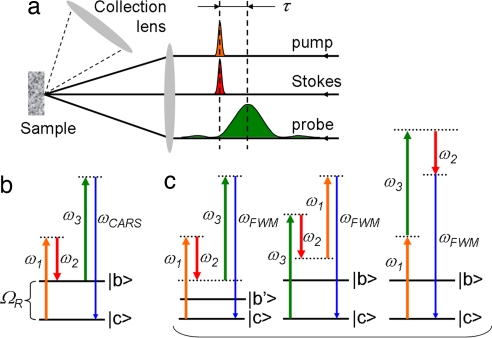
Here, we use a recently introduced time-frequency adaptation of CARS that brings together the concepts of frequency-resolved (18–22) and time-resolved (23–25) CARS measurements. The scheme combines broadband Raman excitation by a pair of ultrashort laser pulses and a time-delayed narrowband probing of the resultant coherent molecular vibrations (Fig. 1a). The broadband preparation allows the monitoring of multiple Raman lines in a single measurement—i.e., gives specificity. The narrowband probing allows for frequency-resolved acquisition. Recording of the whole CARS spectrum at once, without tuning the laser wavelengths, makes the technique relatively insensitive to fluctuations. As we explain in the following section, the technique provides a means to differentiate between the resonant and nonresonant (NR) contributions. It also helps to mitigate the strength of NR four-wave mixing (FWM). The use of a non-zero probe delay further optimizes the ratio between the two contributions in favor of the vibrationally resonant signal, which we will simply refer to as CARS.
Fig. 1.
CARS technique and experiment. (a) Schematic layout of the experiment. The ultrashort pump and Stokes pulses, focused in the same spot on the sample, are followed by a narrowband probe pulse, which is shaped and delayed with respect to the first two. The scattered radiation is collected in the backward geometry, under ≈30° to the main axis. (b) Energy level diagram for CARS—i.e., Raman-resonant contribution into the acquired signal. The Raman mode at frequency ΩR is excited by the pump (ω1) and Stokes (ω2) pulses. The induced molecular vibrations lead to inelastic scattering of the probe pulse (ω3), giving rise to frequency up-converted radiation at ωCARS. (c) Possible channels of NR FWM generation that does not involve the transition between the ground state |c〉 and Raman-active state |b〉.
We have recently used this broadband preparation—narrowband time-delayed probing scheme (called hybrid CARS for short)—to obtain the spectrum from highly scattering samples of sodium dipicolinate powder and Bacillus subtilis endospores (26). The same approach was applied by Stauffer et al. (27) to CARS on neat solutions of toluene and chloroform as well as rhodamine 6G with an emphasis on prospective monitoring of intramolecular vibrational energy redistribution; another but conceptually similar scheme was also implemented by Hamaguchi et al. (28). By delaying a narrowband pump pulse relative to dispersion-compensated supercontinuum (used as a Stokes pulse within a standard broadband CARS scheme), they observed NR background-free CARS signal from impulsively excited vibrational modes of indene. Finally, the time-resolved dynamics of the resonant and NR broadband picosecond CARS signals from gas-phase nitrogen was investigated in ref. 29.
In this contribution, we improve on our hybrid CARS measurements on B. subtilis endospores (26) and elaborate on the optimization of the initially proposed experimental setup. First, the wavelengths of the pump, Stokes, and probe beams are shifted into the near-IR domain, where the photodamage threshold for the spores is higher as compared with the visible-range wavelengths. Second, the bandwidth and delay of the probe pulse are carefully optimized. These steps have led to a 102 to 103 increase in the sensitivity of our CARS setup and enabled us to acquire the spectrum from a small sample volume (≈104 spores) in a single laser shot.
Because CARS efficiency is expected to be proportional to the intensity of the excitation laser pulses, the generated signal can in principle be increased (and the required sample size decreased) by tighter focusing of the applied laser beams. However, there is obviously a limit imposed by the laser-induced damage to the sample. In our previous work, wherein signal collection was done over many laser shots, the applied laser intensities (and therefore the average signal strengths) were limited by cumulative damage to the sample. An obvious question that one may ask is whether higher peak intensities can be used when the signal is generated on a subpicosecond time scale. In this article, we provide an experimental answer to this question by measuring the optimized CARS signal vs. the applied laser energy fluence on a single-shot basis.
Resonant vs. Nonresonant Nonlinear Response
The overwhelming NR background due to multiple off-resonant vibrational modes and the instantaneous electronic response (see the energy level diagrams in Fig. 1 b and c) is a major practical constraint on the utilization of CARS as an otherwise powerful spectroscopic tool. Even though there are techniques that make use of the interfering NR FWM to enhance a weak CARS signal (30–33), they are susceptible to depolarization and dephasing because of scattering in realistic samples. The very same arguments work against polarization-sensitive (34) and phase-dependent (35) schemes designed to suppress the NR FWM contribution and associated optical noise. The hybrid CARS technique is an alternative solution that seems to withstand the hassles encountered with realistic samples. In this section, we review the benefits of such a scheme and indicate the parameters essential for its optimization.
As is well known, the third-order polarization induced by pump, Stokes, and probe pulses naturally splits into two parts, nonresonant and resonant contributions. We find it convenient to adopt the notation of Silberberg et al. (36) and write the nonlinear polarization as
 |
where S12(Ω) ≡ ∫0+∞E1(ω′ + Ω)E*2(ω′)dω′ is the convolution of the pump and Stokes spectral amplitudes, E1(ω′) and E2(ω′); E3(ω′, τ) is the spectral amplitude of the probe pulse; and τ is its time delay relative to the preparation pulses. We assume that the three pulses are spectrally isolated from each other and only the indicated combination of the fields produces the FWM signal within the frequency domain of interest.
The main difference between the two contributions comes from the fact that the NR nonlinear susceptibility, χNR(3), is frequency insensitive, while its counterpart is two-photon resonant and can be modeled as
Here, the summation is held over all affected Raman transitions, ΩRj and γj denote the vibrational frequency and the Raman line half-width, αj is a constant related to the spontaneous Raman cross-section, and ω1 and ω2 are the frequencies of the pump and Stokes laser fields.
For the sake of simplicity, we consider the interplay between the NR and resonant contributions when a single vibrational mode at frequency ΩR is excited by a pair of ultrashort Gaussian laser pulses centered at ωc1 and ωc2 for the pump and Stokes fields
and probed by a time-delayed Gaussian pulse centered at ωc3,
 |
with two adjustable parameters: the spectral full-width-at-half-maximum (FWHM) Δω3 of the pulse and its time delay τ. Other simplifying assumptions are that ωc1 − ωc2 = ΩR and ωcl ≫ Δωl for = 1, 2, 3, which yields S12(Ω) = S0 exp(−2 ln(2)·(Ω − ΩR)2/Δω122) with Δω12 = (Δω12 + Δω22)1/2, and
 |
From Eq. 5, it follows that the excitation within a fixed band of width Δω12 centered at ΩR is optimal when —i.e., two equally broadband pulses are used. Because the pulses are assumed to be transform-limited, it is equivalent to having the pump and Stokes pulses of the same temporal duration. Note that this is usually not the case for the standard broadband CARS arrangement, where a spectrally narrowband pump pulse is combined with a broadband Stokes-shifted continuum. According to Eq. 5, the excitation amplitude |S0|2 increases by 50 times when a 3-ps pump and 30-fs Stokes pulses are replaced by two 42-fs pulses of the same energy. The effective excitation bandwidth stays the same.
We first put τ equal to zero—i.e., overlap the preparation and probe pulses in time—and consider the dependence of the nonlinear response of the medium, subject to the broadband excitation (Δω12 ≫ γ), on the bandwidth of the probe pulse Δω3. Two quantities, the spectral bandwidth and the peak spectral magnitude of |PNR(3)|2 and |PR(3)|2, are indicative of the observed changes.
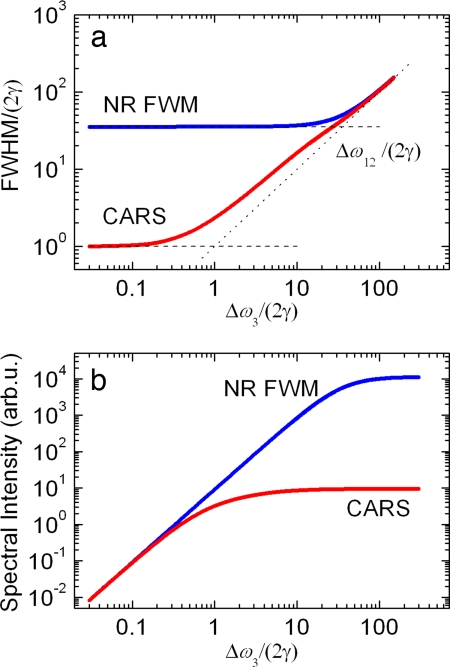
Indeed, Fig. 2a shows the calculated dependence of the FWHM bandwidth for CARS and NR FWM. As expected, the spectral width of the NR profile is determined by the convolution of all of the three laser pulses and therefore has the lower limit of Δω12. In contrast, the lower limit for the resonant part is dictated by the bandwidth of the Raman line. It is advantageous to use Δω3 ∼ 2γ ≪ Δω12 (i.e., narrowband probing) and gain the spectral contrast between the two contributions. Furthermore, cutting the probe spectrum facilitates substantial reduction of the NR background without appreciable loss in the peak spectral intensity of the CARS signal (see Fig. 2b). Please note that the relative position of the two curves along the vertical axis in Fig. 2b depends on the choice of χNR(3), the Raman scattering coefficient α (see Eq. 2), and the molecular vibration decay rate γ. In particular, they happen to merge in the limit Δω3 ≪ γ because γχNR(3)/α = 1 for the demonstrated calculations.
Fig. 2.
The calculated spectral bandwidth (a) and peak spectral intensity (b) of the resonant (CARS) and nonresonant (NR FWM) contributions into |P(3)|2, without taking into account the interference term, 2 Re(PNR(3)·PR(3)). The parameters used are χNR(3) = 1, α = 1, γ = 1, Δω1 = Δω2 = 50γ, τ = 0, S0 = 1, and A3 = 1.
One can obtain the following analytical expression for the ratio of the two peaks at ω = ωc3 + ΩR:
 |
Here, W ≡ Δω12Δω3/(Δω122 + Δω32)1/2 and erf(x) ≡ (2/π1/2) ∫0x exp(−t2)dt is the error function. In the limit of a large probe bandwidth [i.e., for Δω3 ≫ γ (we also assume Δω12 ≫ γ)], R ≈ 2π ln(2)/W2·|α/χNR(3)|2. In the opposite limit (i.e., for Δω3 ≪ γ), one gets R ≈ 1/γ2·|α/χNR(3)|2. Finally, R scales as Δω3−2 for γ ≪ Δω3 ≪ Δω12.
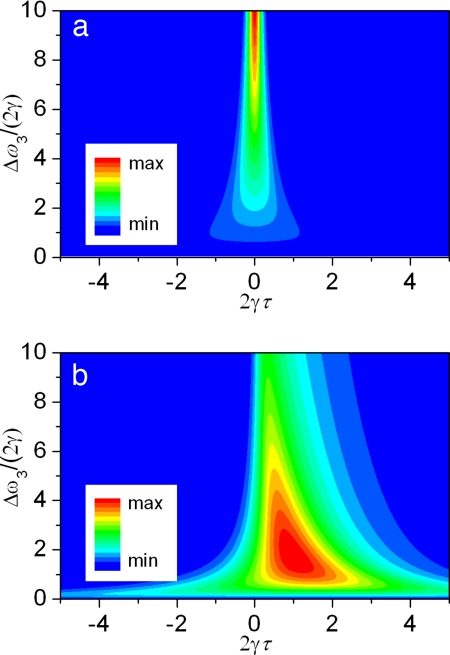
The other parameter that has been left out of the discussion so far, but that can be used to further improve the signal-to-background ratio, is the probe pulse delay. For any fixed probe pulse bandwidth, the NR contribution peaks at zero probe delay and decreases as the overlap between the three pulses is reduced via the probe pulse timing (see Fig. 3a). The resonant response, in contrast, becomes maximal at some positive probe delay and decreases at larger delays with a decay rate determined by the dephasing time of molecular oscillations [Fig. 3b; see also supporting information (SI) Fig. 9]. When normalized on the probe pulse energy, the resonant contribution reaches maximum for the probe pulse bandwidth Δω3 on the order of 2γ, and its delay τ about Δω3−1. The NR FWM peaks at zero probe delay and Δω3 ∼ Δω12 (which is out of the range plotted in Fig. 3a).
Fig. 3.
The calculated magnitude of |PNR(3)|2 (a) and |PR(3)|2 (b) at ω = ωc3 + ΩR as a function of the probe spectral bandwidth Δω3 and time delay τ relative to the overlapped preparation pulses. The parameters are similar to those used for Fig. 2, but τ is varied and the probe pulse amplitude is normalized such that A3 = (4 ln(2)/π)1/4Δω3−1/2 to have the probe pulse energy constant.
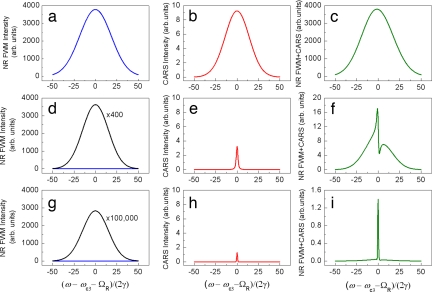
Simulations presented in Fig. 4 summarize the effect of the probe bandwidth and delay on the spectrally resolved profiles of |PNR(3)|2, |PR(3)|2, and |PNR(3) + PR(3)|2. The initially featureless spectrum, dominated by the NR FWM (Fig. 4 a–c), reveals the presence of a Raman-resonant response, distinct from the interfering NR background, when the probe pulse bandwidth is adjusted (see Fig. 4 d–f); adding probe delay further improves the signal-to-background ratio, as shown in Fig. 4 g–i. The actual optimal values of the probe pulse parameters depend on γ, the ratio γχNR(3)/α, the noise level, and the necessary spectral resolution.
Fig. 4.
The calculated spectrally resolved profiles of |PNR(3)|2 (Left), |PR(3)|2 (Center), and |PNR(3) + PR(3)|2 (Right) for Δω3 = 50γ, τ = 0 (a–c); Δω3 = 2γ, τ = 0 (d–f); and Δω3 = 2γ, τ = 2/γ (g–i). The other parameters are the same as in Fig. 2.
It is worthwhile to note that suitable probe pulse shapes are not limited to the considered Gaussian waveform. For example, one can use a probe pulse with a sinc2(Δω3t/2)-shaped temporal profile, as we do in our experiment. By putting the preparation pulses on the node of the probe field, as shown in SI Fig. 10, one can virtually cancel out the NR FWM contribution at a finite probe pulse delay. Of course, the timing between the pulses is essential here, and multiple scattering inside the sample, if present, fills in the field node to some extent.
Experimental Results and Discussion
An essential improvement in performance was achieved by shifting of the pump, Stokes, and probe wavelengths from the visible into the IR domain. This allowed us to increase the energy of the pulses and their peak intensities by three to five times without destroying the spores.
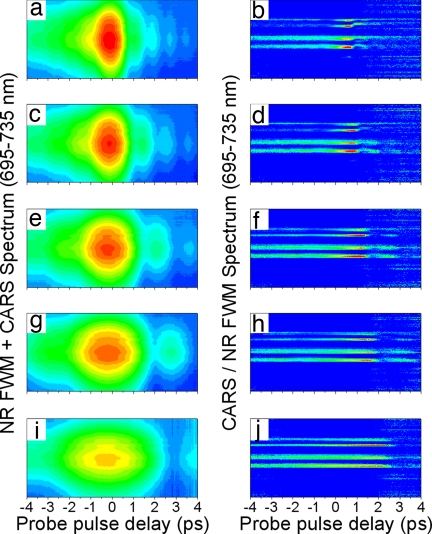
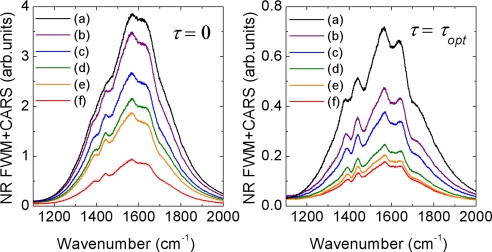
The next step toward superior sensitivity was the optimization of the spectral bandwidth and the time delay of the probe pulse. Because the observed NR background in the recorded CARS spectra was dominated by the multiple scattering within the sample, this was done experimentally. A set of spectrograms, shown in Fig. 5Left, was recorded for different spectral bandwidths of the probe pulse. For each probe delay in a spectrogram, the acquired spectrum was processed to remove the NR background and account for the pump–Stokes excitation profile.†† The normalized spectrograms (see Fig. 5 Right) reveal sharp resonant features on top of the smooth NR background as well as the optimal probe delay τopt, corresponding to the maximal ratio between CARS and NR FWM, for every chosen value of Δω3. Fig. 6 illustrates the recorded, flat-field corrected CARS spectra at τ = 0 and τ = τopt.‡‡ As expected, two tendencies can be observed. If the probe bandwidth is small compared with the Raman line width, the visibility of the Raman peak depends only weakly on the probe delay, and the signal magnitude is low. If the probe bandwidth is large, the signal is stronger but the contrast degrades. For the observed Raman transitions, Δω3 ≈ 30 cm−1 and the time delay τ ≈ 0.77 ps were found to be optimal (see Figs. 5d and 6c).
Fig. 5.
The experimentally obtained CARS spectrograms (Left) and processed CARS-vs.-FWM profiles (Right) acquired with a pellet of B. subtilis spores for different FWHM spectral bandwidths of the probe pulse Δω3: 40 cm−1 (a and b), 30 cm−1 (c and d), 20 cm−1 (e and f), 15 cm−1 (g and h), and 10 cm−1 (i and j). The integration time is 1 s. The central wavelengths of the pump, Stokes, and probe pulses are 1.28 μm, 1.62 μm, and 805 nm, respectively. The energy of the probe pulse is kept constant while the spectral bandwidth is adjusted.
Fig. 6.
Cross-sections of the recorded CARS spectrograms, similar to those in Fig. 5, for two different probe delays: zero delay (Left) and optimal delay (Right). The last one is adjusted for different values of Δω3: 60 cm−1 (a), 40 cm−1 (b), 30 cm−1 (c), 20 cm−1 (d), 15 cm−1 (e), and 10 cm−1 (f).
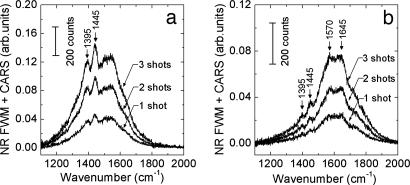
Once we had the parameters optimized, the setup performance was evaluated by decreasing the acquisition time. Fig. 7 shows CARS spectra of B. subtilis spores taken in only one to three laser shots. Spore Raman transitions in the fingerprint region (1,300–1,700 cm−1) are apparent even after a single shot. For these measurements, the laser system was switched from normal (continuous) operation at 1 kHz rep rate into the single-shot mode, and the laser pulses were fired manually. The integration time of the charge-coupled device (CCD) camera was set to 3 s to ensure a comfortable time span for the manual firing of up to 10 shots. The variation of the CCD integration time from 0.5 to 10 s did not show any appreciable change in the noise level of the single-shot spectra because the dominant part of the noise came from the scattered laser radiation entering the spectrometer. At last, the reported pulse energies were deduced from the power measurements in the normal (continuous) operation mode. We found that they differed from the actual pulse energies when the laser system was operated in the single-shot mode. The ratio of the single-shot to the continuous-mode pulse energy was 0.75, 0.47, and 1.3 for the pump, Stokes, and probe pulses, respectively.
Fig. 7.
Acquired CARS spectra for one, two, and three laser shots at the optimal probe delay. Parameters were as follows. (a) Pump wavelength λ1 = 1.25 μm, 4 μJ per pulse; probe, λ3 = 805.8 nm, Δω3 = 30 cm−1, 3 μJ per pulse; Stokes, λ2 = 1.54 μm, 4 μJ per pulse. (b) Stokes, λ2 = 1.56 μm, 4 μJ per pulse.
Note that the single-shot spectra were obtained from a fairly small number of spores. Taking the effective laser pulse penetration depth for the highly scattering sample (a clump of closely packed spores) to be 10 μm and the diameter of the probed region to be 32 μm, one gets a rough estimate for the probed volume of 104 μm3. Allocating 1 μm3 for a single spore gives ≈104 contributing spores.
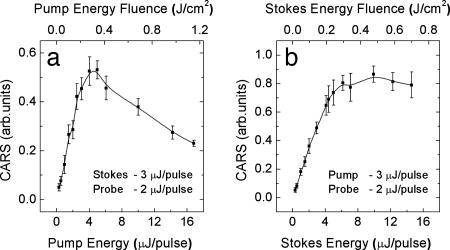
The dependence of the resonant CARS signal on the energy of the pump and Stokes pulses is shown in Fig. 8. Here, the resonant contribution is defined as an integral over the two Raman peaks, 1,395 cm−1 and 1,445 cm−1. The data reveal that at high enough pulse energies, the dependence strongly deviates from the expected linear increase. The CARS signal magnitude saturates and even drops down at higher pulse energies. The total acquired signal, which is dominated by the nonresonant contribution, exhibits similar dependence on the pulse energies but with a slightly weaker decay at the high-energy limit (data not shown). Within the available range (up to 3 μJ per pulse), we observed a linear dependence of the CARS signal on the energy of the probe pulse.
Fig. 8.
Dependence of the CARS signal on the energy of the pump (a) and Stokes (b) pulses. Other parameters are λ1 = 1.24 μm, λ2 = 1.54 μm, λ3 = 805.7 nm, and Δω3 = 30 cm−1. The CARS signal was recorded in the single-shot regime, moving the sample after each laser shot to avoid accumulated effects due to the laser-induced damage.
The saturation and decrease of the generated CARS signal as a function of the pump or Stokes pulse energies is probably due to the laser-induced damage of the exposed endospores. Accounting for the beam focusing and the scaling factors, we estimate the damage threshold for our spore sample to be 0.2 J/cm2 per ultrashort pump or Stokes pulse. For 50-fs pulses, this energy fluence corresponds to a peak intensity of ≈3 × 10¹² W/cm2. Note that this threshold is retrieved from the single-short measurements and corresponds to ultrafast (femtosecond-scale) photodamage. We have also observed a longer-scale cumulative effect of CARS signal degradation as a function of the shot number. To avoid the substantial damage of the sample over 100 laser shots, one needs to use a pulse energy fluence that is at least three times lower than the single-shot threshold value.
To summarize, we have optimized our earlier hybrid CARS experiment and demonstrated that the CARS spectrum from ≈104 bacterial endospores can be obtained in a single, femtosecond laser shot. This is to be compared with our initial acquisition time of many seconds. The dependence of the CARS signal on the energy of the ultrashort preparation pulses shows that it scales linearly, up to a peak energy fluence of ≈0.2 J/cm2 per pulse. Further signal increase is hampered by photodamage of the sample interacting with the strong electric field of the femtosecond pulses. Finally, it is important to note that spore detection, addressed in this article, is only one application of our technique. The technique can be adapted in a straightforward fashion for many other applications requiring chemical specificity and short acquisition times. A particularly interesting example is CARS microscopy (37–40).
Methods
We used a Ti:Sapphire-based laser system (Legend; Coherent: ≈805 nm, 50 fs, 1 kHz rep rate, 1 mJ/pulse) pumping two optical parametric amplifiers (OPAs) (OPerA; Coherent). The signal beams at two different wavelengths, generated in the OPAs by the down-conversion of 805-nm photons, provided pump (λ1 ∼ 1.25 μm) and Stokes (λ2 ∼ 1.55 μm) pulses. The probe pulses came from the residual 805-nm beam spectrally filtered and shaped by a 4f pulse shaper with a mechanical slit in its Fourier plane. The resulting pulse shape had a sinc-squared intensity profile. The three beams were arranged in folded-BOXCAR geometry and focused on the sample, as shown schematically in Fig. 1a. The FWHM diameters for the pump, Stokes, and probe beams on the sample were 36, 43, and 32 μm, respectively (from knife-edge measurements). The timing between the three input pulses was adjusted by computer-controlled delay stages. The generated CARS signal was collected in the backward direction, at a 30° angle to the main axis, by a 2-inch-diameter lens (focal length of 10 cm) and directed into a spectrometer (Spectrograph-250i; Chromex) with an attached liquid nitrogen-cooled CCD (Spec-10; Princeton Instruments).
Supplementary Material
ACKNOWLEDGMENTS.
This work was supported by Office of Naval Research Award N00014-03-1-0385, the Defense Advanced Research Projects Agency, National Science Foundation Grant PHY-0354897, an award from the Research Corporation, and Robert A. Welch Foundation Grants A-1261 and A-1547.
Footnotes
The authors declare no conflict of interest.
This article contains supporting information online at www.pnas.org/cgi/content/full/0710427105/DC1.
We have found it useful to obtain a smoothed replica of the acquired CARS spectrum by averaging the recorded counts over 200 adjacent pixels and then dividing the original spectrum by the generated profile. It is analogous to forming the ratio of CARS plus NR FWM over NR FWM.
The etaloning effect, common for back-illuminated CCDs in the spectral range of interest, leads to inhomogeneous optical response of the CCD over its surface. It results in parasitic amplitude modulation of recorded spectra. To correct for ghost spectral peaks, we acquired a sample spectrum with the probe beam blocked (high harmonic generation due to the pump and Stokes fields contributed as a smooth background) and then divided all CARS spectra by the obtained profile.
References
- 1.Pushkarsky MB, Webber ME, Macdonald T, Patel CKN. High-sensitivity, high-selectivity detection of chemical warfare agents. Appl Phys Lett. 2006;88 044103. [Google Scholar]
- 2.Pushkarsky MB, et al. High-sensitivity detection of TNT. Proc Natl Acad Sci USA. 2006;103:19630–19634. doi: 10.1073/pnas.0609789104. [DOI] [PMC free article] [PubMed] [Google Scholar]
- 3.Edwards KA, Clancy HA, Baeumner AJ. Bacillus anthracis: toxicology, epidemiology and current rapid-detection methods. Anal Bioanal Chem. 2006;384:73–84. doi: 10.1007/s00216-005-0090-x. [DOI] [PubMed] [Google Scholar]
- 4.Spiro TG. Biological Applications of Raman Spectroscopy. New York: Wiley; 1987. [Google Scholar]
- 5.Arp Z, Autrey D, Laane J, Overman SA, Thomas GJ. Structural studies of viruses by Raman spectroscopy part LXXI—Tyrosine Raman signatures of the filamentous virus Ff are diagnostic of non-hydrogen-bonded phenoxyls: Demonstration by Raman and infrared spectroscopy of p-cresol vapor. Biochemistry. 2001;40:2522–2529. doi: 10.1021/bi0023753. [DOI] [PubMed] [Google Scholar]
- 6.Esposito AP, et al. Analysis of single bacterial spores by micro-Raman spectroscopy. Appl Spectrosc. 2003;57:868–871. doi: 10.1366/000370203322102979. [DOI] [PubMed] [Google Scholar]
- 7.Chan JW, et al. Reagentless identification of single bacterial spores in aqueous solution by confocal laser tweezers Raman spectroscopy. Anal Chem. 2004;76:599–603. doi: 10.1021/ac0350155. [DOI] [PubMed] [Google Scholar]
- 8.Nelson WH, Dasari R, Feld M, Sperry JF. Intensities of calcium dipicolinate and Bacillus subtilis spore Raman spectra excited with 244 nm light. Appl Spectrosc. 2004;58:1408–1412. doi: 10.1366/0003702042641290. [DOI] [PubMed] [Google Scholar]
- 9.Farquharson S, et al. Detecting Bacillus cereus spores on a mail sorting system using Raman spectroscopy. J Raman Spectrosc. 2004;35:82–86. [Google Scholar]
- 10.Zhang XY, Young MA, Lyandres O, Van Duyne RP. Rapid detection of an anthrax biomarker by surface-enhanced Raman spectroscopy. J Am Chem Soc. 2005;127:4484–4489. doi: 10.1021/ja043623b. [DOI] [PubMed] [Google Scholar]
- 11.Zhang XY, Zhao J, Whitney AV, Elam JW, Van Duyne RP. Ultrastable substrates for surface-enhanced Raman spectroscopy: Al2O3 overlayers fabricated by atomic layer deposition yield improved anthrax biomarker detection. J Am Chem Soc. 2006;128:10304–10309. doi: 10.1021/ja0638760. [DOI] [PubMed] [Google Scholar]
- 12.Maker PD, Terhune RW. Study of optical effects due to an induced polarization third order in electric field strength. Phys Rev. 1965;137:A801. [Google Scholar]
- 13.Levenson MD, Bloembergen N. Dispersion of nonlinear optical susceptibility tensor in centrosymmetric media. Phys Rev B. 1974;10:4447–4463. [Google Scholar]
- 14.Scully MO, et al. FAST CARS: Engineering a laser spectroscopic technique for rapid identification of bacterial spores. Proc Natl Acad Sci USA. 2002;99:10994–11001. doi: 10.1073/pnas.172290899. [DOI] [PMC free article] [PubMed] [Google Scholar]
- 15.Hanna SF, et al. Electronic-resonance-enhanced coherent anti-Stokes Raman spectroscopy of nitric oxide. Appl Phys Lett. 2003;83:1887–1889. [Google Scholar]
- 16.Rebane A, et al. Femtosecond resonance enhanced CARS for background-free detection of organic molecules. J Mod Opt. 2005;52:1243–1253. [Google Scholar]
- 17.Rabitz H, de Vivie-Riedle R, Motzkus M, Kompa K. Chemistry—Whither the future of controlling quantum phenomena? Science. 2000;288:824–828. doi: 10.1126/science.288.5467.824. [DOI] [PubMed] [Google Scholar]
- 18.Voroshilov A, Otto C, Greve J. On the coherent vibrational phase in polarization sensitive resonance CARS spectroscopy of copper tetraphenylporphyrin. J Chem Phys. 1997;106:2589–2598. [Google Scholar]
- 19.Muller M, Schins JM. Imaging the thermodynamic state of lipid membranes with multiplex CARS microscopy. J Phys Chem B. 2002;106:3715–3723. [Google Scholar]
- 20.Chen JX, Volkmer A, Book LD, Xie XS. Multiplex coherent anti-stokes Raman scattering microspectroscopy and study of lipid vesicles. J Phys Chem B. 2002;106:8493–8498. [Google Scholar]
- 21.Kee TW, Cicerone MT. Simple approach to one-laser, broadband coherent anti-Stokes Raman scattering microscopy. Opt Lett. 2004;29:2701–2703. doi: 10.1364/ol.29.002701. [DOI] [PMC free article] [PubMed] [Google Scholar]
- 22.Petrov GI, Yakovlev VV. Enhancing red-shifted white-light continuum generation in optical fibers for applications in nonlinear Raman microscopy. Opt Express. 2005;13:1299–1306. doi: 10.1364/opex.13.001299. [DOI] [PubMed] [Google Scholar]
- 23.Materny A, et al. Wave packet dynamics in different electronic states investigated by femtosecond time-resolved four-wave-mixing spectroscopy. Appl Phys B. 2000;71:299–317. [Google Scholar]
- 24.Siebert T, Schmitt M, Grafe S, Engel V. Ground state vibrational wave-packet and recovery dynamics studied by time-resolved CARS and pump-CARS spectroscopy. J Raman Spectrosc. 2006;37:397–403. [Google Scholar]
- 25.Lucht RP, Roy S, Meyer TR, Gord JR. Femtosecond coherent anti-Stokes Raman scattering measurement of gas temperatures from frequency-spread dephasing of the Raman coherence. Appl Phys Lett. 2006;89:251112. [Google Scholar]
- 26.Pestov D, et al. Optimizing the laser-pulse configuration for coherent Raman spectroscopy. Science. 2007;316:265–268. doi: 10.1126/science.1139055. [DOI] [PubMed] [Google Scholar]
- 27.Prince BD, Chakraborty A, Prince BM, Stauffer HU. Development of simultaneous frequency- and time-resolved coherent anti-Stokes Raman scattering for ultrafast detection of molecular Raman spectra. J Chem Phys. 2006;125 doi: 10.1063/1.2219439. 044502. [DOI] [PubMed] [Google Scholar]
- 28.Kano H, Hamaguchi H. Dispersion-compensated supercontinuum generation for ultrabroadband multiplex coherent anti-Stokes Raman scattering spectroscopy. J Raman Spectrosc. 2006;37:411–415. [Google Scholar]
- 29.Roy S, Meyer TR, Gord JR. Time-resolved dynamics of resonant and nonresonant broadband picosecond coherent anti-Stokes Raman scattering signals. Appl Phys Lett. 2005;87:264103. [Google Scholar]
- 30.Evans CL, Potma EO, Xie XS. Coherent anti-Stokes Raman scattering spectral interferometry: determination of the real and imaginary components of nonlinear susceptibility χ(3) for vibrational microscopy. Opt Lett. 2004;29:2923–2925. doi: 10.1364/ol.29.002923. [DOI] [PubMed] [Google Scholar]
- 31.Lim SH, Caster AG, Leone SR. Single-pulse phase-control interferometric coherent anti-Stokes Raman scattering spectroscopy. Phys Rev A. 2005;72 041803. [Google Scholar]
- 32.Potma EO, Evans CL, Xie XS. Heterodyne coherent anti-Stokes Raman scattering (CARS) imaging. Opt Lett. 2006;31:241–243. doi: 10.1364/ol.31.000241. [DOI] [PubMed] [Google Scholar]
- 33.Lim SH, Caster AG, Nicolet O, Leone SR. Chemical imaging by single pulse interferometric coherent anti-Stokes Raman scattering microscopy. J Phys Chem B. 2006;110:5196–5204. doi: 10.1021/jp057493k. [DOI] [PubMed] [Google Scholar]
- 34.Oudar JL, Smith RW, Shen YR. Polarization-sensitive coherent anti-Stokes Raman spectroscopy. Appl Phys Lett. 1979;34:758–760. [Google Scholar]
- 35.Oron D, Dudovich N, Yelin D, Silberberg Y. Quantum control of coherent anti-Stokes Raman processes. Phys Rev A. 2002;65 043408. [Google Scholar]
- 36.Dudovich N, Oron D, Silberberg Y. Single-pulse coherent anti-Stokes Raman spectroscopy in the fingerprint spectral region. J Chem Phys. 2003;118:9208–9215. [Google Scholar]
- 37.Duncan MD, Reintjes J, Manuccia TJ. Scanning coherent anti-Stokes Raman microscope. Opt Lett. 1982;7:350–352. doi: 10.1364/ol.7.000350. [DOI] [PubMed] [Google Scholar]
- 38.Zumbusch A, Holtom GR, Xie XS. Three-dimensional vibrational imaging by coherent anti-Stokes Raman scattering. Phys Rev Lett. 1999;82:4142. [Google Scholar]
- 39.Evans CL, et al. Chemical imaging of tissue in vivo with video-rate coherent anti-Stokes Raman scattering microscopy. Proc Natl Acad Sci USA. 2005;102:16807–16812. doi: 10.1073/pnas.0508282102. [DOI] [PMC free article] [PubMed] [Google Scholar]
- 40.Ogilvie JP, Beaurepaire E, Alexandrou A, Joffre M. Fourier-transform coherent anti-Stokes Raman scattering microscopy. Opt Lett. 2006;31:480–482. doi: 10.1364/ol.31.000480. [DOI] [PubMed] [Google Scholar]
Associated Data
This section collects any data citations, data availability statements, or supplementary materials included in this article.


