Abstract
Homeostatic synaptic response is an important measure in confining neuronal activity within a narrow physiological range. Whether or not homeostatic plasticity demonstrates synapse specificity, a key feature characteristic of Hebbian-type plasticity, is largely unknown. Here, we report that in cultured hippocampal neurons, α-amino-3-hydroxy-5-methyl-isoxazole-4-propionic acid subtype glutamate receptor (AMPAR) accumulation is increased selectively in chronically inhibited single synapses, whereas the neighboring normal synapses remain unaffected. This synapse-specific homeostatic regulation depends on the disparity of synaptic activity and is mediated by GluR2-lacking AMPARs and PI3-kinase signaling. These results demonstrate the existence of synaptic specificity and the crucial role of AMPAR-gated calcium in homeostatic plasticity in central neurons.
Keywords: single synapse, synaptic plasticity, synaptic specificity, Kir 2.1
During development and normal brain function, changes in synaptic strength driven by Hebbian plasticity, including long-term potentiation (LTP) and long-term depression (LTD), may lead to neurons with either saturated activity or complete silence. To circumvent this potential problem, neurons have been found to sense their overall activity level and adjust it via a negative-feedback mechanism known as homeostatic plasticity (1, 2), through which neurons can restore their function at a set-point level when challenged by external or internal perturbations and thus maintain neuronal or network stability. Homeostatic synaptic plasticity has been studied on the neuron-population scale. When network activity is chronically suppressed, homeostatic response leads to an increase in synaptic strength across all affected synapses, where one of the major cellular mechanisms is to alter receptor expression at the postsynaptic domain (3–6). It has been characterized that the homeostatic enhancement in synaptic activity is proportional to previous synaptic activity levels (termed synaptic scaling), thereby maintaining relative weights among synapses (2, 7, 8).
When homeostatic regulation is induced by global activity perturbation, all neuronal components and all synapses are indiscriminately affected. It is therefore difficult to determine whether homeostatic regulation happens at individual synapses, i.e., the existence of synaptic specificity and whether the homeostatic change is a result of altered presynaptic input or postsynaptic neuronal excitability. Using a culture model in which individual synaptic activity is selectively inhibited, we find that accumulation of AMPARs, as well as the AMPAR-interacting protein GRIP, is selectively increased at the presynaptically inhibited synapses in a manner of proportional scaling. Furthermore, single-synapse homeostatic plasticity requires PI3-kinase activity and GluR2-lacking AMPARs, indicating a crucial role for AMPAR-gated calcium signaling. In contrast, no alterations in AMPAR expression were observed in postsynaptically suppressed neurons, suggesting the existence of perturbation–location-dependence in homeostatic induction.
Results
Selective Suppression of Single-Synapse Activity in Cultured Hippocampal Neurons.
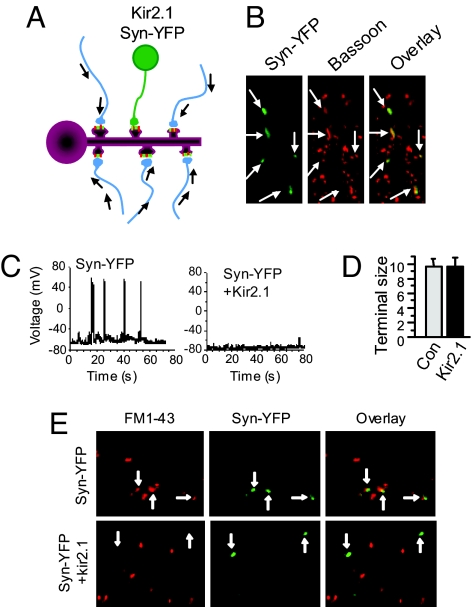
To set up a paradigm in which an individual neuron, and thus the activity of downstream synapses formed with its axon terminals, is selectively inhibited, we transfected 12-d-old hippocampal neurons with the inwardly rectifying potassium channel Kir2.1 and YFP-tagged synapsin (synapsin-YFP) to identify axon termini (Fig. 1 A and B). Consistent with previous studies (9, 10), expression of Kir2.1 hyperpolarized the membrane potential by ≈10 mV, leading to a dramatic reduction in the firing rate of action potentials in all transfected neurons, with some being completely silenced (Fig. 1C). Because transfection efficiency was controlled to low levels, only a fraction of neurons received axonal inputs from the transfected cells. The inhibited terminals from Kir2.1-expressing neurons were identified by synapsin-YFP fluorescence, whose puncta showed complete colocalization with the endogenous presynaptic markers Bassoon (Fig. 1B) and synaptophysin (data not shown). Estimated from the YFP puncta, we found no difference in axon terminal size between neurons expressing synapsin-YFP alone and those coexpressing synapsin-YFP and Kir2.1 (Fig. 1D). Consistent with the inhibition of neuronal firing by Kir2.1 overexpression, FM1–43 labeling demonstrated a dramatic reduction in synaptic vesicle recycling at termini from Kir2.1-expressing neurons, whereas expression of synapsin-YFP alone did not affect vesicle dynamics (Fig. 1E), indicating selective suppression of activity in a few individual synapses neighbored by many synapses with normal activity. Because the suppression of firing rate in Kir2.1 neurons recovers in 3 d after transfection in cultured hippocampal neurons (10), we examined alterations in the inhibited synapses 2 d after Kir2.1 transfection.
Fig. 1.
Selective inhibition of individual synapses in cultured hippocampal neurons. (A) Schematic illustration of the experimental paradigm. Among a population of synapses on dendritic spines showing normal synaptic activity, one synapse, formed with a neuron expressing potassium channel Kir2.1, is inhibited. (B) In addition to the functional construct Kir2.1, neurons were cotransfected with YFP-tagged synapsin as a synapse marker. Immunostaining of the endogenous synaptic protein Bassoon showed a complete colocalization of synapsin-YFP and Bassoon (arrows). (C) Whole-cell recordings on transfected neurons. Under current-clamp configuration, small depolarizing synaptic activities were observed in both the Syn-YFP control neurons and the Kir2.1 neurons, with the amplitudes of the latter much smaller. (Left) In controls (n = 12), some depolarization pulses were big enough to trigger action potential (8–15 firings per min). (Right) In contrast, Kir2.1 neurons had hyperpolarized resting potentials and were mostly silent. (D) Axon terminal areas were estimated by measuring the YFP signals of synapsin-YFP. No changes in axon terminal size were found from neurons expressing synapsin-YFP (Con) and synapsin-YFP+Kir2.1 (Kir2.1) (Syn-YFP, 9.6 ± 1.1, n = 65; Kir2.1, 9.6 ± 1.2, n = 74). (E) Kir2.1 neuron terminals show reduced synaptic vesicle turnover. Two days after transfection with synapsin-YFP or together with Kir2.1, cells were rinsed twice with ACSF and incubated with 20 μM fixable FM1–43 in ACSF under basal conditions for 5–8 min. After three washes for 10 min with dye-free ACSF (containing no calcium to minimize spontaneous exocytosis), cells were fixed and imaged. Terminals from neurons expressing synapsin-YFP only (green) were loaded with FM dye (red, Upper), but those from Kir2.1-expressing neurons were largely lacking FM labeling (Lower), indicating a reduction in synaptic terminal activity. Arrows indicate colocalization of FM1-43 and Syn-YFP.
Single-Synapse Inactivity Increases AMPAR, but Not NMDAR, Accumulation.
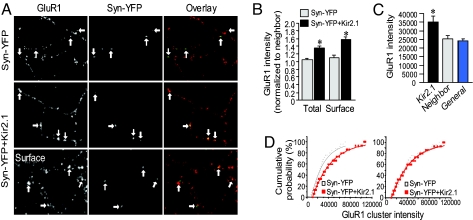
In central neurons, a commonly studied model of functional homeostasis is activity deprivation by tetrodotoxin (TTX). When cultured neurons are incubated with TTX to abolish action potentials and silence network activity, synaptic transmission responds in a compensatory manner, resulting in enhanced synaptic transmission through an increase in AMPAR expression in all synapses (4, 11). We first explored whether AMPAR accumulation was altered in a similar manner specifically at synapses whose input, among many intact neighboring synapses in the same neuron, was chronically suppressed. By immunostaining under permeant conditions, we found an elevated level in AMPAR GluR1 subunits selectively at inhibited synapses compared with neighboring nonaffected synapses. At synapses with synapsin-YFP only, GluR1 expression remained unchanged compared with neighbor synapses (Syn-YFP only, 1.03 ± 0.1, n = 42; Kir2.1, 1.3 ± 0.1, n = 48, P < 0.05) (Fig. 2 A and B). When surface immunostaining was performed under nonpermeant conditions, we found that the intensity of synaptic GluR1 was increased to higher levels (Syn-YFP 1.1 ± 0.1, n = 54; Kir2.1 1.6 ± 0.1, n = 54; P < 0.05) (Fig. 2 A Bottom and B). The absolute intensity value of GluR1 at neighboring synapses showed no difference from the general synapse population in a much larger area (Fig. 2C), indicating that the increase of AMPAR accumulation at Kir2.1 synapses relative to adjacent synapses was not due to a reduction of the neighbor clusters. Importantly, it also indicates a lack of competition between local synapses in receptor localization. A key characteristic of homeostatic regulation is synaptic scaling. During alterations in global neuronal activity, AMPAR numbers and synaptic transmission strength are regulated in the same proportion in different individual synapses compared with their original levels (1, 4, 12). We found that at single Kir2.1 synapses the relative increase in GluR1 cluster intensity was also scaled proportionally; when GluR1 immunointensity from control synapses expressing synapsin-YFP alone was multiplied with a fixed factor, the accumulative curve overlapped with that from the Kir2.1 synapses (Fig. 2D), indicating that the homeostatic increase in AMPAR numbers at single synapses may use the same scaling mechanism as in global inactivation.
Fig. 2.
Homeostatic increase of GluR1 expression at inhibited single synapses. (A) GluR1 subunits were immunolabeled under permeant (Top and Middle) and nonpermeant (Bottom) conditions. At Kir2.1 synapses indicated by synapsin-YFP fluorescence (green), GluR1 (red) intensity was higher compared with neighboring normal synapses (Middle and Bottom), whereas GluR1 at synapsin-YFP-only synapses was not changed (Top). Arrows indicate synapsin-YFP terminals and the corresponding GluR1 puncta. (B) Pooled data of relative intensity of GluR1 stained under permeant (Total) and nonpermeant (Surface) conditions (Total: Syn-YFP, 1.03 ± 0.1, n = 42; Kir2.1, 1.3 ± 0.1, n = 48; P < 0.05. Surface: Syn-YFP, 1.1 ± 0.1, n = 54; Kir2.1, 1.6 ± 0.1, n = 54; P < 0.05, t test). (C) Absolute immunointensity of GluR1 clusters at Kir2.1 synapses (35,066 ± 3,136, n = 57), their neighbors (25,224 ± 1,609, n = 57) and the general synapse population (24,022 ± 960, n = 57) showed an increase at the inhibited but not the neighboring synapses, indicating that the increase in normalized GluR1 intensity was not due to a reduction in neighbor synapses. (D) Cumulative distribution of GluR1 puncta intensity. (Left) Data are fitted with single exponential. (Right) An overlap of the curves after multiplying a factor to the control (Syn-YFP) indicated a scaling up of AMPAR synaptic expression at Kir2.1 synapses. Error bars show SEM.
Consistent with the increase of GluR1 subunits, expression of other AMPAR subunits on the Kir2.1 synapses was also enhanced when neurons were immunostained with antibodies against GluR2/3 (Syn-YFP, 1.2 ± 0.1, n = 54; Kir2.1, 1.7 ± 0.1, n = 44; P < 0.05) (Fig. 3 A and B). In contrast, another type of ionotropic glutamate receptors, NMDARs, which are normally colocalized with AMPARs at the same synapses, showed no difference at Kir2.1 sites from those at neighboring synapses (Syn-YFP, 1.1 ± 0.1, n = 60; Kir2.1, 0.96 ± 0.1, n = 60; P > 0.05) (Fig. 3 A and B). These data indicate that receptor targeting was precisely regulated to compensate for the weakened synaptic transmission in a site- and receptor-specific manner. At the Kir2.1 synapses, we found that the AMPAR-associated postsynaptic density protein GRIP (1.1 ± 0.1, n = 38 and 1.5 ± 0.1, n = 41 for Syn-YFP and Kir2.1 synapses, respectively; P < 0.05), but not PSD-95 (Syn-YFP, 1.2 ± 0.1, n = 36; Kir2.1, 1.1 ± 0.1, n = 40; P > 0.05), was also up-regulated (Fig. 3 A and B), indicating that the additional AMPARs might be delivered as preassembled complexes with associated components to the synaptic site (13).
Fig. 3.
Homeostatic response is AMPAR-specific. (A) GluR2/3 expression, like GluR1, was increased at Kir2.1 synapses (Syn-YFP, 1.2 ± 0.1, n = 54; Kir2.1, 1.7 ± 0.1, n = 44; P < 0.05), but no changes were found for NMDAR subunit NR1 (Syn-YFP, 1.1 ± 0.1, n = 60; Kir2.1, 0.96 ± 0.1, n = 60; P > 0.05). Immunolabeling of the synaptic scaffolding protein PSD-95 and AMPAR-associated protein GRIP showed that at Kir2.1 synapses PSD-95 remained the same (Syn-YFP, 1.2 ± 0.1, n = 36; Kir2.1, 1.1 ± 0.1, n = 40; P > 0.05), whereas expression of GRIP increased (1.1 ± 0.1, n = 38 and 1.5 ± 0.1, n = 41 for Syn-YFP and Kir2.1 synapses, respectively; P < 0.05), suggesting a package delivery of AMPAR complexes during homeostatic response. (B) Pooled data.
GluR1 Accumulation at the Inhibited Synapses Depends on the Relative Contrast in Synaptic Activity.
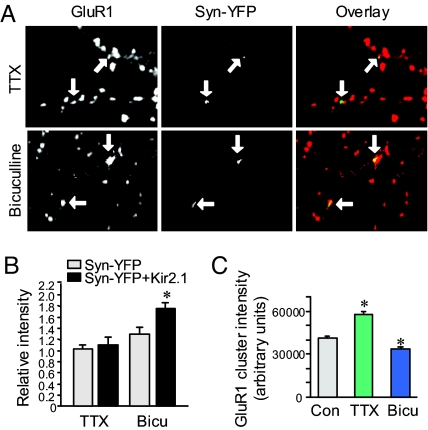
We then wanted to determine whether homeostatic regulation at single synapses depends on the relative disparity in input strength. We first added TTX after Kir2.1 transfection to globally inhibit and equalize all synaptic activity. Under these conditions no difference was observed in GluR1 accumulation between Kir2.1 synapses and their neighbors (Syn-YFP, 1.10 ± 0.07, n = 52; Kir2.1, 1.18 ± 0.08, n = 54; P > 0.05) (Fig. 4 A and B). To examine the opposite, we treated the culture during Kir2.1 expression for 2 d with bicuculline, an antagonist to the inhibitory GABAA receptors, to enhance network activity and amplify the contrast in synaptic activity. Under this condition, GluR1 at Kir2.1 synapses increased to a level much higher than at basal conditions (Syn-YFP, 1.30 ± 0.12, n = 40; Kir2.1, 1.76 ± 0.09, n = 43; P < 0.05) (Fig. 4 A and B). Consistent with previous reports (3, 4, 12), TTX and bicuculline also nonselectively altered synaptic AMPAR accumulation by a global homeostatic response. At nontransfected synaptic sites, TTX incubation increased GluR1 synaptic accumulation by 40%, whereas bicuculline caused a 20% reduction (Control 41,360 ± 791; TTX 57,905 ± 976, n = 1,000; P < 0.05; bicuculline 33,881 ± 780, n = 1,300; P < 0.05) (Fig. 4C).
Fig. 4.
Synapse-specific homeostatic response depends on disparity of synaptic strength. (A and B) When synaptic activity was equalized to low levels by application of TTX (1 μM) after Kir2.1 transfection, the homeostatic response in GluR1 expression was abolished (Syn-YFP, 1.10 ± 0.07, n = 52; Kir2.1, 1.18 ± 0.08, n = 54; P > 0.05). In contrast, when the network activity was enhanced by the GABAA receptor antagonist bicuculline (20 μM) to enlarge activity contrast, homeostatic increase in GluR1 expression at Kir2.1 synapses was enhanced (Syn-YFP, 1.30 ± 0.12, n = 40; Kir2.1, 1.76 ± 0.09, n = 43; P < 0.05). Arrows indicate Syn-YFP terminals and the corresponding GluR1 puncta. (C) The absolute intensity of synaptic GluR1 clusters of all synapses was increased by 2-d TTX treatment and was decreased by application of bicuculline, confirming the induction of global homeostatic synaptic regulation.
Activity of Calcium-Permeable AMPARs and PI3-Kinase Are Required for the Homeostatic Response.
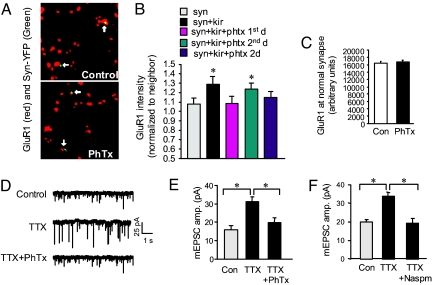
Although homeostatic regulation has been identified in a variety of systems and is attracting a growing amount of interest, the underlying mechanisms are largely unknown (2). Calcium has long been considered a critical mediator in homeostatic plasticity. However, in contrast to Hebbian plasticity, homeostatic regulation is NMDAR-independent, suggesting the involvement of a novel route of calcium entry. At hippocampal synapses GluR1 and GluR2 are coexpressed to form calcium-impermeant AMPAR channels (14). However, studies have demonstrated that during synaptic inactivity by TTX and/or NMDAR blockage, AMPAR subunits are differentially regulated, causing a preferential increase in the expression of GluR1 subunits (15), which may lead to the generation of GluR2-lacking, calcium-permeable AMPARs (Cp-AMPARs) (16). Because the synaptic activity at Kir2.1 synapses is chronically suppressed, we hypothesize that the Cp-AMPARs may be intimately involved in the homeostatic regulation. Consistent with this idea, we found that when philanthotoxin-343 (PhTx, 5 μM), an inhibitor specific to GluR2-lacking AMPARs, was applied to the transfected cultures during Kir2.1 expression, the homeostatic response in GluR1 expression was blocked (Fig. 5 A and B). Consistently, another inhibitor specific to Cp-AMPARs, 1-naphthyl acetyl spermine (Naspm, 10 μM), also blocked changes at Kir2.1 sites [supporting information (SI) Fig. 8]. In fact, incubation of PhTx for the first 24 h after Kir2.1 transfection was sufficient to completely abolish the homeostatic response, which was also blocked by continuous incubation with PhTx for 2 d after Kir2.1 transfection. However, application of PhTx on the second day showed no significant effect (Fig. 5B), indicating that Cp-AMPARs are required for the early induction, but not late-phase expression, of homeostatic plasticity. Using controls, we found that 2-d incubation with the toxins had no effect on either GluR1 cluster immunointensity (Fig. 5C) or mEPSC amplitude (SI Fig. 9). We next investigated whether the Cp-AMPARs are also involved in global homeostatic plasticity. First, we examined the relative abundance of AMPAR subunits at synapses. After 1-d TTX (1 μM) incubation, surface GluR1 and GluR2 were immunolabeled and measured at individual clusters. TTX caused a reduction in the GluR2/GluR1 ratio (SI Fig. 10), suggesting the formation of Cp-AMPARs. As reported (11), miniature recording showed a significant increase in mEPSC amplitude in neurons pretreated with TTX (1 μM) for 2 d (control, 15.98 ± 1.86 pA, n = 15; TTX, 31.11 ± 2.54 pA, n = 15; P < 0.05). However, in neurons coincubated with TTX (1 μM) and PhTx (5 μM), or with another Cp-AMPAR inhibitor Naspm (10 μM), no homeostatic increase in mEPSC amplitude was observed (TTX plus PhTx, 19.74 ± 2.44, n = 11; TTX+Naspm 19.29 ± 2.66, n = 5; P > 0.05 compared with the control) (Fig. 5 D–F), strongly indicating an important role for GluR2-lacking AMPARs and related calcium signaling in homeostatic plasticity. Consistently, we found that in neurons overexpressing GluR2-GFP that presumably forms heteromers with endogenous GluR1 (17) thus minimizing GluR2-lacking AMPARs, TTX failed to induce homeostatic increase in AMPAR synaptic expression (SI Fig. 11).
Fig. 5.
GluR2-lacking, calcium-permeable AMPARs are required for the induction of homeostatic response. (A) In neurons transfected with Syn-YFP and Kir2.1, homeostatic increase in GluR1 immunointensity (Upper) was completely blocked by coincubation with PhTx to specifically block the GluR2-lacking AMPARs (Lower). (B) Homeostatic response was blocked when PhTx was applied for only the first day or for 2 d after transfection. (Syn, 1.08 ± 0.06, n = 50; Kir2.1, 1.29 ± 0.08, n = 53; P < 0.05; Kir2.1 with PhTx-for 1 d, 1.09 ± 0.07, n = 61; P > 0.05; for 2 d 1.15 ± 0.06, n = 53; P > 0.05 compared with the Synapsin-YFP control). However, when supplemented only at the second day after transfection, PhTx failed to block the homeostatic response (1.24 ± 0.06, n = 56; P < 0.05 compared with Synapsin-YFP control), indicating a critical role of GluR2-lacking AMPARs in the early stages of homeostasis induction. (C) In neurons expressing Kir2.1 plus synapsin-YFP, 2-d incubation with PhTx did not change GluR1 intensity at normal synapses (n = 1,155). (D and E) TTX treatment (1 μM, 2 d) of cultured neurons induced global homeostatic increase in mEPSC amplitude (n = 15; P < 0.05). Coincubation of TTX (1 μM) and PhTx (5 μM) for 2 d abolished the TTX effect on mEPSC amplitude, indicating the critical role of GluR2-lacking AMPARs in homeostatic plasticity. A complete blockade of mEPSCs by CNQX confirmed AMPARs as the current mediators. (F) TTX-induced homeostatic increase in mEPSC amplitude was blocked by Naspm (n = 5).
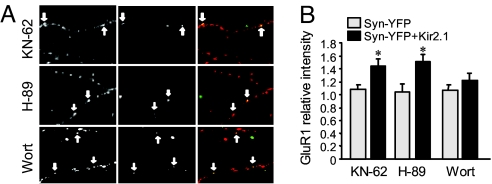
We then explored the intracellular signaling pathways that may be involved in single synapse homeostatic regulation. Because the alteration in AMPAR accumulation at inhibited synapses is likely caused by receptor translocation, we investigated the role of several kinases that have been implicated in up-regulation of AMPAR surface expression via receptor trafficking, including protein kinase A (PKA) (18–20), calcium/calmodulin-dependent kinase II (CaMKII) (21) and phosphoinositide-3 kinase (PI3K) (22, 23). Incubation of the Kir2.1-transfected neurons for 2 d with H-89 (2 μM) and KN-62 (10 μM) to inhibit PKA and CaMKII, respectively, did not affect the homeostatic increase of GluR1 expression at Kir2.1 synapses (H-89: Syn-YFP, 1.05 ± 0.13, n = 42; Kir2.1, 1.51 ± 0.12, n = 57; P < 0.05; KN-62: Syn-YFP, 1.09 ± 0.08, n = 40; Kir2.1, 1.44 ± 0.11, n = 47; P < 0.05) (Fig. 6 A and B). However, application of wortmannin (100 nM) to inhibit the PI3K activity abolished the homeostatic response (Syn-YFP, 1.07 ± 0.10, n = 56; Kir2.1, 1.23 ± 0.10, n = 56; P > 0.05) (Fig. 6 A and B), indicating a crucial role of the PI3K-dependent pathway in homeostatic synaptic plasticity.
Fig. 6.
Involvement of signaling kinases in homeostatic regulation. (A) Kinase inhibitors were applied to neurons after Kir2.1 transfection for 2 d. (B) Inhibition of PI3K activity (Wortmannin, 100 nM, n = 56) abolished the relative increase of GluR1 immunointensity at Kir2.1 synapses; whereas inhibition of CaMKII (KN-62, 10 μM, n = 47) and PKA (H-89, 1 μM, n = 57) did not affect the homeostatic response. Arrows indicate the inhibited synapses. *, P < 0.05, t test.
Individual Inhibited Neurons in the Network Do Not Have Homeostatic Response in AMPAR Synaptic Expression.
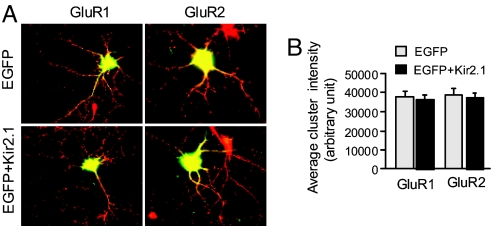
If activity of a single neuron in a network is chronically down-regulated by overexpressing Kir2.1, will the strength of synapses formed onto this neuron be scaled upwardly in the same homeostatic manner as reported on the population level? To answer this question, we examined AMPAR expression on neurons that expressed Kir2.1 and were thus postsynaptically less excitable. In contrast to the above-studied synapses where the presynaptic input is selectively suppressed, neither GluR1 nor GluR2 synaptic accumulation at Kir2.1-expressing neurons was altered compared with the EGFP-expressing sister coverslips (for GluR1: EGFP, 37,872 ± 2,577, n = 303; EGFP plus Kir2.1, 36,445 ± 2,677, n = 269; P > 0.05; for GluR2: EGFP, 38,651 ± 2,856, n = 207; EGFP plus Kir2.1, 37,440 ± 2,362, n = 270; P > 0.05) (Fig. 7 A and B). A previous report using the same paradigm showed increases in mEPSC frequency, but not amplitude, in Kir2.1 neurons, indicating that the homeostatic regulation under this condition is mainly through a presynaptic mechanism (10).
Fig. 7.
Postsynaptic suppression induces no homeostatic response in AMPAR synaptic expression. (A) Twelve-day cultured hippocampal neurons were transfected with EGFP as indicator or together with Kir2.1 to suppress neuronal excitability for 2 d. (B) Synaptic cluster intensity of GluR1 and GluR2 showed no difference compared with EGFP control, indicating that the homeostatic response in AMPAR expression is not sensitive to postsynaptic inhibition.
Discussion
We found that, at individual synapses whose activity was selectively reduced, the accumulation of AMPAR subunits including GluR1 and GluR2/3 was increased at the corresponding postsynaptic domain, similar to the homeostatic response in globally silenced neurons (4). A previous study showed that, in selectively silenced synapses, the expression of PSD-95 was, consistently, not altered However, in contrast to our findings, the authors found no change in GluR2/3 and decreases in GluR1 synaptic localization (24), probably because of enhanced GluR1 membrane diffusion (25). The discrepancy regarding AMPAR synaptic accumulation is likely caused by differences in experimental models and in activity manipulation. In the other study, neurons were inhibited by chronic expression of tetanus toxin, which blocks all vesicle-mediated membrane fusion at synapses and the whole cell in general. Compared with our paradigm in which only the action potential-mediated synaptic activity is suppressed, leaving the vesicle fusion machinery intact to allow random fusion and release at basal conditions, the tetanus toxin completely silences the synapse. This indicates that either basal level transmitter release or some unidentified vesicle-mediated synaptic signal molecules are crucial for the induction of homeostatic synaptic plasticity.
A reduction in synaptic strength can be caused by reduced terminal input or reduced postsynaptic responsiveness. At the Kir2.1 synapses, inhibition of the presynaptic activity induced a homeostatic response at the postsynaptic site, but in Kir2.1 neurons where the postsynaptic response was suppressed, no similar changes in AMPAR accumulation was observed. Combining our findings with a previous study that demonstrated an enhanced transmitter release onto Kir2.1-inhibited neurons (10), it suggests that homeostatic plasticity may be expressed at the synaptic side opposite to the site of perturbation.
This homosynaptic homeostatic regulation shares common features with global homeostasis: dependency on Cp-AMPARs and scaling of AMPAR levels to their original sizes, implying that the global homeostasis is a generalized synapse-specific response. Because the homeostatic response can happen in a synapse-specific manner, a “sensor” for synaptic activity should exist in individual synapses (26). Regarding the molecular nature of the sensor, calcium as a direct indicator of neuronal excitation has long been proposed as the candidate, but the source of calcium is not clear (26). In the Drosophila neuromuscular junction, the presynaptic calcium channel Cav2.1 has recently been implicated in presynaptically expressed homeostasis (27). Our data support a model in which reduced synaptic activity causes the formation of GluR2-lacking AMPARs by an unknown mechanism, leading to the expression of homeostatic regulation, probably via AMPAR-gated calcium signaling. Glia-released TNF-α has also been implicated in synaptic scaling (12). Because TNF-α induces rapid surface expression of Cp-AMPARs (28), it is interesting to postulate that the same AMPAR-calcium signaling pathway is used after TNF-α stimulation. Furthermore, although calcium is critical for both Hebbian and homeostatic plasticity, the type of response may be determined by the route of calcium entry, i.e., NMDAR-gated calcium for LTP/LTD, and AMPAR-gated calcium for homeostatic regulation. Given the existence of homosynaptic homeostasis suggested by the present work, how the two types of plasticity cross-talk remains an intriguing and important question. A possible prediction is that any “long-term” synaptic plasticity might actually be short-lived because of a reversal by homeostatic mechanisms.
The origin of the AMPARs recruited during homeostatic response is unknown at this time. Local protein synthesis can be an efficient means to provide new receptors in a synapse-specific manner (15, 29, 30). It is possible that calcium via Cp-AMPARs activates the AMPAR-associated PI3K (22), which subsequently initiates protein synthesis processes (31). Receptor lateral diffusion or membrane insertion may also be involved (32, 33). Because intracellular calcium rises cause immobilization of surface AMPARs (32), calcium via GluR2-lacking AMPARs may prevent receptors from diffusing out of the synaptic domain, resulting in local accumulation of AMPARs at the inhibited synapses. Further studies are needed to elucidate the detailed molecular mechanisms underlying these processes.
Methods
Neuron Cultures.
Primary hippocampal cultures were prepared from E18 rat embryos as described (34). Cells (0.3–0.5 × 10⁶) were plated into a 60-mm dish with five polylysine-precoated coverslips and maintained in neurobasal medium, changed twice a week, for ≈2 wk until transfection. Because typical homeostatic plasticity mainly occurs in neurons <14 days in vitro (35), relatively young cultures were used in experiments.
Neuron Transfection.
Coverslips of 12- to 14-d-old hippocampal neurons were first transferred to a 12-well plate and were transfected with Lipofectamine 2000 (Invitrogen) according to the manufacturer's protocol. For one coverslip, DNA of synapsin-YFP alone or together with Kir2.1 (1 μg of each) and Lipofectamine (0.5 μl) were separately diluted with MEM, combined, and incubated at room temperature for 20 min. The DNA complex was then added to a well containing 0.5 ml of culture medium and kept in the incubator. After 3-h incubation, the transfection medium was removed and replaced with fresh culture medium until the next regular medium change or use.
Drug Treatment.
Drugs (1 μM TTX, 20 μM Bicuculline, 10 μMKN-62, 1 μM H-89, and 0.1 μM Wortmannin) were added to the culture medium 4 h after neuronal transfection, supplemented with a half dose the second day until use. PhTx (5 μM) was added to the medium after transfection for 2 d, replaced with normal culture medium the second day, or added the second day after transfection until performing the experiment.
Immunocytochemistry.
Neurons were washed with artificial cerebrospinal fluid (ACSF) and fixed with 4% paraformaldehyde/4% sucrose for 10 min, permeabilized with 0.2% Triton X-100 (on ice, 10 min) or stained without permeabilization for surface labeling. For immunostaining of NMDA receptors, cells were fixed with 4% paraformaldehyde/4% sucrose for 5 min, followed by ice-cold 100% methanol for 20 min. Coverslips with neurons were blocked with 10% normal goat serum (NGS) in PBS for 1 h and then incubated with primary antibodies dissolved in 5% NGS in PBS for 2 h at room temperature. Cells were then washed four times with PBS and incubated with fluorescence Alexa Fluor-conjugated secondary antibodies (1:700; Invitrogen) for 1 h for visualization.
For some surface staining, live neurons were incubated with antibodies against the extracellular N termini of GluR1 (1:100) and/or GluR2 (1:100) in culture medium in the incubator for 10 min. Plates were then placed on ice and washed four times with ACSF. After fixation, cells were blocked and incubated with fluorescence secondary as above. The specificity of surface labeling was confirmed by dim intrasoma immunointensity and the lack of staining by incubation with GluR1 C-terminal antibodies.
Electrophysiology.
For mEPSC recordings, 2-wk-old cultured hippocampal neurons were treated with tetrodotoxin (TTX, 1 μM) for 2 d to induce homeostatic regulation. The coverslip was then transferred to a recording chamber with extracellular solution containing 140 mM NaCl, 3 mM KCl, 1.5 mM MgCl2, 2.5 mM CaCl2, 11 mM glucose, and 10 mM Hepes (pH 7.4), which was supplemented with TTX (1 μM) to block action potentials, APV (50 μM) to block NMDAR and bicuculline (20 μM) to block GABAA receptor-mediated IPSCs. Whole-cell voltage-clamp recordings were made with patch pipettes filled with intracellular solution containing 100 mM Cs-methanesulfonate, 10 mM CsCl, 10 mM Hepes, 0.2 mM EGTA, 4 mM Mg-ATP, 0.3 mM Na-GTP, 5 mM QX-314, and 10 mM sodium phosphocreatine (pH 7.4), with the membrane potential clamped at −70 mV. Recordings started 10 min after establishing whole-cell configuration to ensure equilibration between the pipette solution and the cytosol. mEPSCs were recorded with an Axopatch 200B amplifier and displayed and recorded digitally on a computer for subsequent off-line analysis by Clamp-Fit. In some experiments, neurons were pretreated with TTX (1 μM) alone or to together with PhTx (5 μM) for 2 d. To record resting and action potentials, cells were held under current-clamp configuration with the pipette solution 100 mM K-methanesulfonate, 20 mM KCl, 10 mM Hepes, 0.5 mM EGTA, 4 mM Mg-ATP, 0.3 mM Na-GTP, and 10 mM sodium phosphocreatine (pH 7.4).
Image Collection.
Immunostained coverslips were mounted onto slides by using Prolong Gold anti-fade reagent (Invitrogen) and kept in the dark for >4 h before imaging. By using ×63 oil-immersion objective (N.A. 1.4), a DIC snap was first taken for morphology purposes. The exposure time for fluorescence signal was first set automatically by the software and adjusted manually so that the signals were within the full dynamic range. Either the glow scale look-up table or the histogram was used to monitor the saturation level. Once the parameters were set, they were fixed and used throughout the experiment. For accurate quantification, all images were collected in 12-bit gray scale and saved as raw data. Dual channels were used for receptor staining (red) and the presynaptic YFP (green).
Data Analysis.
A double-colored image (red from stained glutamate receptors or other proteins and green signals from synapsin-YFP or EGFP) was separated into two channels with Image-J software, and the two windows were synchronized. By pointing to a YFP puncta (synapsin-YFP), indicating a presynaptic terminal from a Kir2.1-expressing or synapsin-YFP control neuron, the corresponding postsynaptic AMPA receptor cluster was able to be precisely located. Fluorescence intensity of this cluster and those of the neighboring intact clusters were measured. To avoid bias, two or more control clusters were chosen from both sides of the positive synapse in the same dendrite, and the average of the neighboring clusters was used as control. The data were presented as ratios of Kir2.1 synapse versus the average of neighbor synapses or in original readings as indicated. Normally two to three positive synapses were measured per cell, and 20–30 neurons were analyzed. All values are reported as mean ± SEM, and statistical analysis was performed by using the two-population t test.
Supplementary Material
Footnotes
The authors declare no conflict of interest.
This article is a PNAS Direct Submission. R.S. is a guest editor invited by the Editorial Board.
This article contains supporting information online at www.pnas.org/cgi/content/full/0706447105/DC1.
References
- 1.Turrigiano GG, Nelson SB. Nat Rev Neurosci. 2004;5:97–107. doi: 10.1038/nrn1327. [DOI] [PubMed] [Google Scholar]
- 2.Davis GW. Annu Rev Neurosci. 2006;29:307–323. doi: 10.1146/annurev.neuro.28.061604.135751. [DOI] [PubMed] [Google Scholar]
- 3.O'Brien RJ, Kamboj S, Ehlers MD, Rosen KR, Fischbach GD, Huganir RL. Neuron. 1998;21:1067–1078. doi: 10.1016/s0896-6273(00)80624-8. [DOI] [PubMed] [Google Scholar]
- 4.Wierenga CJ, Ibata K, Turrigiano GG. J Neurosci. 2005;25:2895–2905. doi: 10.1523/JNEUROSCI.5217-04.2005. [DOI] [PMC free article] [PubMed] [Google Scholar]
- 5.Kilman V, van Rossum MC, Turrigiano GG. J Neurosci. 2002;22:1328–1337. doi: 10.1523/JNEUROSCI.22-04-01328.2002. [DOI] [PMC free article] [PubMed] [Google Scholar]
- 6.Shepherd JD, Rumbaugh G, Wu J, Chowdhury S, Plath N, Kuhl D, Huganir RL, Worley PF. Neuron. 2006;52:475–484. doi: 10.1016/j.neuron.2006.08.034. [DOI] [PMC free article] [PubMed] [Google Scholar]
- 7.Turrigiano GG, Nelson SB. Neuron. 1998;21:933–935. doi: 10.1016/s0896-6273(00)80607-8. [DOI] [PubMed] [Google Scholar]
- 8.Turrigiano GG, Nelson SB. Curr Opin Neurobiol. 2000;10:358–364. doi: 10.1016/s0959-4388(00)00091-x. [DOI] [PubMed] [Google Scholar]
- 9.Paradis S, Sweeney ST, Davis GW. Neuron. 2001;30:737–749. doi: 10.1016/s0896-6273(01)00326-9. [DOI] [PubMed] [Google Scholar]
- 10.Burrone J, O'Byrne M, Murthy VN. Nature. 2002;420:414–418. doi: 10.1038/nature01242. [DOI] [PubMed] [Google Scholar]
- 11.Turrigiano GG, Leslie KR, Desai NS, Rutherford LC, Nelson SB. Nature. 1998;391:892–896. doi: 10.1038/36103. [DOI] [PubMed] [Google Scholar]
- 12.Stellwagen D, Malenka RC. Nature. 2006;440:1054–1059. doi: 10.1038/nature04671. [DOI] [PubMed] [Google Scholar]
- 13.Gerrow K, Romorini S, Nabi SM, Colicos MA, Sala C, El-Husseini A. Neuron. 2006;49:547–562. doi: 10.1016/j.neuron.2006.01.015. [DOI] [PubMed] [Google Scholar]
- 14.Ogoshi F, Weiss JH. J Neurosci. 2003;23:10521–10530. doi: 10.1523/JNEUROSCI.23-33-10521.2003. [DOI] [PMC free article] [PubMed] [Google Scholar]
- 15.Sutton MA, Ito HT, Cressy P, Kempf C, Woo JC, Schuman EM. Cell. 2006;125:785–799. doi: 10.1016/j.cell.2006.03.040. [DOI] [PubMed] [Google Scholar]
- 16.Ju W, Morishita W, Tsui J, Gaietta G, Deerinck TJ, Adams SR, Garner CC, Tsien RY, Ellisman MH, Malenka RC. Nat Neurosci. 2004;7:244–253. doi: 10.1038/nn1189. [DOI] [PubMed] [Google Scholar]
- 17.Shi SH, Hayashi Y, Petralia RS, Zaman SH, Wenthold RJ, Svoboda K, Malinow R. Science. 1999;284:1811–1816. doi: 10.1126/science.284.5421.1811. [DOI] [PubMed] [Google Scholar]
- 18.Ehlers MD. Neuron. 2000;28:511–525. doi: 10.1016/s0896-6273(00)00129-x. [DOI] [PubMed] [Google Scholar]
- 19.Esteban JA, Shi SH, Wilson C, Nuriya M, Huganir RL, Malinow R. Nat Neurosci. 2003;6:136–143. doi: 10.1038/nn997. [DOI] [PubMed] [Google Scholar]
- 20.Man HY, Sekine-Aizawa Y, Huganir RL. Proc Natl Acad Sci USA. 2007;104:3579–3584. doi: 10.1073/pnas.0611698104. [DOI] [PMC free article] [PubMed] [Google Scholar]
- 21.Hayashi Y, Shi SH, Esteban JA, Piccini A, Poncer JC, Malinow R. Science. 2000;287:2262–2267. doi: 10.1126/science.287.5461.2262. [DOI] [PubMed] [Google Scholar]
- 22.Man HY, Wang Q, Lu WY, Ju W, Ahmadian G, Liu L, D'Souza S, Wong TP, Taghibiglou C, Lu J, et al. Neuron. 2003;38:611–624. doi: 10.1016/s0896-6273(03)00228-9. [DOI] [PubMed] [Google Scholar]
- 23.Passafaro M, Piech V, Sheng M. Nat Neurosci. 2001;4:917–926. doi: 10.1038/nn0901-917. [DOI] [PubMed] [Google Scholar]
- 24.Harms KJ, Tovar KR, Craig AM. J Neurosci. 2005;25:6379–6388. doi: 10.1523/JNEUROSCI.0302-05.2005. [DOI] [PMC free article] [PubMed] [Google Scholar]
- 25.Ehlers MD, Heine M, Groc L, Lee MC, Choquet D. Neuron. 2007;54:447–460. doi: 10.1016/j.neuron.2007.04.010. [DOI] [PMC free article] [PubMed] [Google Scholar]
- 26.Davis GW, Bezprozvanny I. Annu Rev Physiol. 2001;63:847–869. doi: 10.1146/annurev.physiol.63.1.847. [DOI] [PubMed] [Google Scholar]
- 27.Frank CA, Kennedy MJ, Goold CP, Marek KW, Davis GW. Neuron. 2006;52:663–677. doi: 10.1016/j.neuron.2006.09.029. [DOI] [PMC free article] [PubMed] [Google Scholar]
- 28.Ogoshi F, Yin HZ, Kuppumbatti Y, Song B, Amindari S, Weiss JH. Exp Neurol. 2005;193:384–393. doi: 10.1016/j.expneurol.2004.12.026. [DOI] [PubMed] [Google Scholar]
- 29.Aakalu G, Smith WB, Nguyen N, Jiang C, Schuman EM. Neuron. 2001;30:489–502. doi: 10.1016/s0896-6273(01)00295-1. [DOI] [PubMed] [Google Scholar]
- 30.Grooms SY, Noh KM, Regis R, Bassell GJ, Bryan MK, Carroll RC, Zukin RS. J Neurosci. 2006;26:8339–8351. doi: 10.1523/JNEUROSCI.0472-06.2006. [DOI] [PMC free article] [PubMed] [Google Scholar]
- 31.Schratt GM, Nigh EA, Chen WG, Hu L, Greenberg ME. J Neurosci. 2004;24:7366–7377. doi: 10.1523/JNEUROSCI.1739-04.2004. [DOI] [PMC free article] [PubMed] [Google Scholar]
- 32.Borgdorff AJ, Choquet D. Nature. 2002;417:649–653. doi: 10.1038/nature00780. [DOI] [PubMed] [Google Scholar]
- 33.Tardin C, Cognet L, Bats C, Lounis B, Choquet D. EMBO J. 2003;22:4656–4665. doi: 10.1093/emboj/cdg463. [DOI] [PMC free article] [PubMed] [Google Scholar]
- 34.Liao D, Scannevin RH, Huganir R. J Neurosci. 2001;21:6008–6017. doi: 10.1523/JNEUROSCI.21-16-06008.2001. [DOI] [PMC free article] [PubMed] [Google Scholar]
- 35.Wierenga CJ, Walsh MF, Turrigiano GG. J Neurophysiol. 2006;96:2127–2133. doi: 10.1152/jn.00107.2006. [DOI] [PubMed] [Google Scholar]
Associated Data
This section collects any data citations, data availability statements, or supplementary materials included in this article.


