

Abstract
Dividing protein structures into domains is proven useful for more accurate structural and functional characterization of proteins. Here, we develop a method, called DDOMAIN, that divides structure into DOMAINs using a normalized contact-based domain–domain interaction profile. Results of DDOMAIN are compared to AUTHORS annotations (domain definitions are given by the authors who solved protein structures), as well as to popular SCOP and CATH annotations by human experts and automatic programs. DDOMAIN's automatic annotations are most consistent with the AUTHORS annotations (90% agreement in number of domains and 88% agreement in both number of domains and at least 85% overlap in domain assignment of residues) if its three adjustable parameters are trained by the AUTHORS annotations. By comparison, the agreement is 83% (81% with at least 85% overlap criterion) between SCOP-trained DDOMAIN and SCOP annotations and 77% (73%) between CATH-trained DDOMAIN and CATH annotations. The agreement between DDOMAIN and AUTHORS annotations goes beyond single-domain proteins (97%, 82%, and 56% for single-, two-, and three-domain proteins, respectively). For an “easy” data set of proteins whose CATH and SCOP annotations agree with each other in number of domains, the agreement is 90% (89%) between “easy-set”-trained DDOMAIN and CATH/SCOP annotations. The consistency between SCOP-trained DDOMAIN and SCOP annotations is superior to two other recently developed, SCOP-trained, automatic methods PDP (protein domain parser), and DomainParser 2. We also tested a simple consensus method made of PDP, DomainParser 2, and DDOMAIN and a different version of DDOMAIN based on a more sophisticated statistical energy function. The DDOMAIN server and its executable are available in the services section on http://sparks.informatics.iupui.edu.
Keywords: structure/function studies, structural proteins, new methods, domain parser
Proteins are made of single or multiple functional domains that can fold and function independently. Dividing a protein into domains is useful for more accurate function and structure determination because the methods for phylogenetic analysis and protein modeling usually work best for single domains (Ponting and Russell 2002). Both sequence-based (Chivian et al. 2003; Heger and Holm 2003; Linding et al. 2003; Bateman et al. 2004; Letunic et al. 2004; Liu and Rost 2004; Nagarajan and Yona 2004; von Ohsen et al. 2004; Sim et al. 2005) and structure-based methods (Holm and Sander 1994; Siddiqui and Barton 1995; Sowdhamini and Blundell 1995; Swindells 1995; Holm and Sander 1998; Taylor 1999; Xu et al. 2000; Alexandrov and Shindyalov 2003; Guo et al. 2003; Kundu et al. 2004) have been developed for identification of protein domains.
The problem of dividing a protein structure into domains is not yet solved. This is in part due to the lack of an unambiguous definition of domains. In general, structural domains can be defined as spatially separable, independent folding units. However, how to implement this qualitative definition is proven mathematically challenging. As a result, widely used databases of structural domains such as SCOP (Murzin et al. 1995) and CATH (Orengo et al. 1997) rely on human experts to make all (SCOP) or most (CATH) decisions on domain annotations. However, as the number of solved structures increases rapidly, there is an urgent need for the development of accurate methods for automatic domain identification of protein structures.
The commonly used principle in automatic domain parsing is that the interdomain interaction under a correct domain assignment is weaker than the intradomain interaction. Examples are PUU (Holm and Sander 1994), DOMARK (Siddiqui and Barton 1995), DETECTIVE (Swindells 1995), DALI (Holm and Sander 1998), STRUDL (Wernisch et al. 1999), DomainParser (Xu et al. 2000; Guo et al. 2003), and protein domain parser (PDP) (Alexandrov and Shindyalov 2003). Others (Sowdhamini and Blundell 1995; Pugalenthi et al. 2005) define domains by clustering substructures based on their spatial distances. A new approach based on decoupled domain motions obtained from a Gaussian network model was also proposed recently (Kundu et al. 2004). In all these approaches, residue–residue interaction is described by either the number of contacts based on a distance cutoff (Crippen 1978) or contact surface area (Wodak and Janin 1981).
Here, we propose the method DDOMAIN—an automatic method that divides domains by using a normalized domain–domain interaction profile. With appropriate training of three adjustable parameters, the new method has the best agreement (89.7% in number of domains) with protein domains annotated by the authors who solved the structures (AUTHORS annotations). This is followed by SCOP (82.6%) and CATH (76.6%) annotations. The same trend with slightly smaller success rates is observed when both the number of domains and at least 85% overlap in domain assignment of residues are used as a criterion for agreement between DDOMAIN and expert annotations. Comparing to two other recent SCOP-trained methods (PDP and DomainParser 2), SCOP-trained DDOMAIN has the highest agreement with SCOP annotations in number of domains.
Materials and Methods
The DDOMAIN algorithm
We establish an automatic domain-parsing procedure based on the assumption that each structural domain corresponds to a continuous segment of its amino acid sequence, and the interaction between the domains is the weakest under a correct domain assignment. To estimate domain–domain interactions, we use the number of contacts between the domains. To reduce computing time, a contact is defined by the distance between two residue side-chain centers of mass within a distance cutoff. The detail procedure for domain parsing is as follows.
(1) For a given structure, all residues with coordinates are considered as continuous from 1 to Nr. The structure is divided into two candidate domains—residues from 1 to i and from i + 1 to Nr. The contact energy between the two candidate domains, E1:i,i+1:Nr, can be calculated as below:
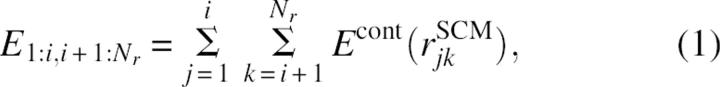 |
where Econt(rSCMjk) is the contact interaction energy between residues j and k whose side chain centers of mass are at distance rSCMjk apart. A contact is defined when rSCMjk≤rcut with rcut = 6.5 Å and Econt(rSCMjk) = -1 regardless of contacting residue types. To facilitate the comparison among domain candidates, the interdomain interaction energy E1:i,i+1:Nr is first “normalized” by the sizes of individual domains.
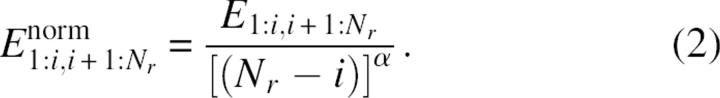 |
This normalization is similar to the normalization of the number of interdomain contacts used in the PDP (protein domain parser) method (Alexandrov and Shindyalov 2003). As in PDP, we let α = 0.43. Unlike PDP, we further normalize  so that the average normalized energy is 1.That is,
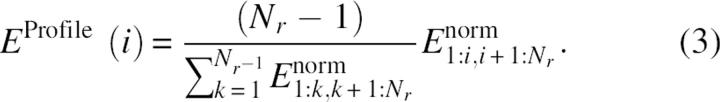 |
The final energy is called the interaction profile between two domain candidates with residues i and i + 1 as the domain boundary. The interaction profile has a positive value because of normalization. The purposes of the first and second normalizations are to facilitate the comparison between domains and proteins in different sizes, respectively.
(2) Once the interaction profile for a given protein structure is constructed for all residues, we locate the lowest value of the profile EProfile(Imin). (The lowest interaction-profile value means the weakest interaction because the interaction profile, unlike interaction energy, is positive.) Imin is the location for two separated domains if (a) 40 < Imin < Nr − 40, (b) EProfile(Imin)≤Elowcutoff, and (c) EProfile(j-EProfile(Imin)≥Eexcesscutoff for a continuous segment of length >Lcut in both proposed domains (1: Imin and Imin + 1: Nr). Here, Elowcutoff is the maximum allowed profile energy for a residue to be designated as a domain boundary, Eexcesscutoff is the minimum profile energy that is above the profile energy at the domain boundary, and Lcut is the minimum length of a continuous segment that satisfies the above condition. An example of the interaction profile with the locations of three parameters is shown in Figure 1. This protein (PDB ID 1gg3, chain A) belongs to one of the proteins in the easy benchmark set in which SCOP and CATH annotations give the same number of domains (see below).
Figure 1.

The contact-based interaction profile of chain A of protein 1gg3 is shown along with the domains identified by DDOMAIN (solid line), SCOP (dashed line), and CATH (dash dotted line). The residue index here is different from the actual residue number in the PDB structure file because only residues with coordinates are numbered.
(3) If two domains are found, each domain is subject to steps 1 and 2 in order to see if each domain can be further divided into smaller domains. The domain-parsing procedure ends when no additional domains can be found.
The above procedure assumes that a domain must be 40 residues or longer. It also has three to-be-determined parameters. These parameters will be Elowcutoff, Eexcesscutoff, and Lcut determined by using a training data set described below.
The DFIRE-based statistical potential
To examine the effect of interaction energy on the accuracy of domain prediction, we also employed a distance-dependent, pairwise statistical potential EDFIRE(rjk) based on a Distance-scaled, Finite, Ideal-gas REference (DFIRE) state (Zhou and Zhou 2002). For a residue-based DFIRE-energy function, the equation for deriving the DFIRE potential is (Zhang et al. 2004)
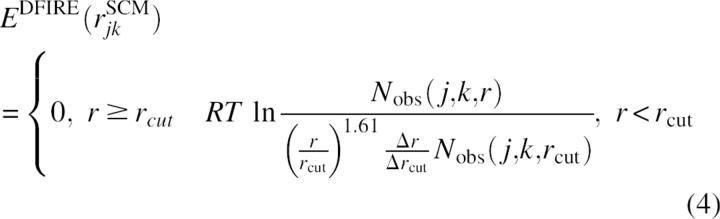 |
where Nobs(j,k,r) is the number of observed pairs of residues j and k at distance r apart (based on side-chain centers of mass), R is the gas constant, T is temperature, and Δrcut is the width of distance bin Δr at r = rcut. The DFIRE-based energy function was generated with rcut = 14.5 Å, Δr = 2 Å for r < 2 Å, Δr = 0.5 Å for 2 Å < r < 8 Å, and Δr = 1 Å for 8 Å < r < 15 Å. The value of Nobs(j,k,r) was obtained from a structural database of 1011 nonhomologous (<30% homology) proteins with resolution <2 Å (http://chaos.fccc.edu/research/labs/dunbrack/culledpdb.html) (Wang and Dunbrack Jr. 2003). This residue-level potential is found to be one of the best statistical energy functions in structure discrimination (Zhang et al. 2004).
The overall procedure for a DFIRE-based domain parser is the same as DDOMAIN except that Econt(rSCMjk) used in Equation 1 is now replaced by EDFIRE(rSCMjk). This method will be labeled as DDOMAIN-DFIRE. The three parameters for DDOMAIN-DFIRE are trained independently from DDOMAIN.
The training and test data sets
To optimize the three parameters used in DDOMAIN (or DDOMAIN-DFIRE) and test its performance, we use the following data sets.
(1) The AUTHORS set. We downloaded the AUTHORS domain data set in which domain annotations are from the authors who solved structures. The AUTHORS domain data set is collected by Islam et al. (1995) (http://bmm.cancerresearchuk.org/∼domains/). It contains 2240 protein structures from a non-redundant representative set of the April 1996 Brookhaven protein data bank (PDB). The set is randomly divided into two groups with 1101 structures for training and 1139 structures for testing, respectively.
(2) The SCOP-CATH set. We built a set of proteins annotated by both SCOP (Murzin et al. 1995) and CATH (Orengo et al. 1997). We started with the representative protein structures of SCOP 1.61 at a maximal sequence identity of 25%. This set has 2889 structures and is labeled as the SCOP set. Within this set, there are 2301 structures that have CATH annotations. The set is randomly divided into two groups with 1157 structures for training and 1144 structures for testing, respectively.
(3) The SCOP-CATH easy set. We found that 81% of the structures (1853 out of 2301 proteins) in the SCOP-CATH set have the same number of domains according to either SCOP or CATH domain database. The 1853 structures can be viewed as an “easy” set for domain parsing because two expert-based domain databases agree with each other. The easy set is randomly divided into two groups with 941 and 912 structures, respectively. We labeled them as easy-1 and easy-2 sets, respectively.
(4) The SCOP-CATH hard set. We further made a corresponding “hard” set by removing the proteins contained in easy sets from the 2301 data set that has both SCOP and CATH annotations. The hard set contains 448 proteins.
(5) The DomainParser set. We downloaded the test data set used by DomainParser 2 (Guo et al. 2003). It contains 1317 chains whose domains were assigned by SCOP 1.59. This set is based on a 25% sequence identity cutoff. We excluded some proteins whose structures contain only Cα atoms. The number of protein chains in this DomainParser set is 1224, in which 195, 210, and 107 proteins are in the easy-1, easy-2, and hard sets, respectively. We removed the proteins from easy-1 that was used in training. The final data set contains 1029 proteins.
Criterion for domain comparison
Here, we use a simple criterion based on the number of domains to judge if there is an agreement between the domains assigned by DDOMAIN and the domains annotated by other methods. That is, two methods are in agreement if they give an identical number of domains for a given structure.
We also use an additional constraint of at least 85% overlap in domain assignment of residues (Jones et al. 1998) to ensure the agreement in actual sequence locations of domains.
The three parameters in DDOMAIN are obtained by optimizing the agreement between number of domains predicted and annotated in a given training set. Optimization is performed by a simple grid search in step size of 0.01 for Elowcutoff and Eexcesscutoff and 1 for Lcut. We have also optimized the parameters by optimizing the agreement in both number of domains and at least 85% overlap. We found that the additional constraint does not make a significant change in percent of agreement reported here, as found by Alexandrov and Shindyalov (2003) (see Results). Thus, we report most results using the criterion based on the number of domains for simplicity, unless it is indicated otherwise.
DomainParser 2, PDP, and consensus prediction
DomainParser 2 and PDP are obtained from their respective authors. They are tested locally with the default setting on the same test sets listed above. The same criterion is used for measuring the agreement between the domains predicted from the automatic domain parsers (DomainParser 2 and PDP) and that from the expert-annotated domain databases.
We also make a consensus prediction based on the predictions made by PDP, DomainParser 2, and DDOMAIN. The number of domains predicted by the consensus method is the number of domains predicted by the majority of the three methods (i.e., two of the three methods). If all three methods disagree in the number of domains, the result from DDOMAIN is used.
Results
To compare DDOMAIN's automatic domain annotations with the annotations made by human experts, DDOMAINs are trained and tested by AUTHORS, SCOP, and CATH annotations, respectively. Two criteria are used. One is based on the number of domains only and the other one is based on the number of domains and at least 85% overlap. The performance of DDOMAIN that is trained and tested for different expert annotations with both criteria is shown in Table 1. The success rate in which the number of expert-annotated domains agrees with the number of domains given by DDOMAIN in independent test sets is 89.7% between AUTHORS-trained DDOMAIN and AUTHORS, 82.6% between SCOP-trained DDOMAIN and SCOP, and 76.6% between CATH-trained DDOMAIN and CATH annotations. In all three cases, the difference between the success rates in training and testing is small (≤3%). This indicates the robustness of the success rates obtained.
Table 1.
Success rates for the agreement between DDOMAIN and expert annotations for the training and independent test sets

An additional requirement of at least 85% overlap in domain assignment of residues leads to small changes in success rates. Table 1 shows that the success rates become 88.3% between AUTHORS-trained DDOMAIN and AUTHORS, 81.1% between SCOP-trained DDOMAIN and SCOP, and 73.4% between CATH-trained DDOMAIN and CATH annotations. Thus, the requirement of at least 85% overlap leads to ≤3% changes in percent of agreement. The values of the three optimized parameters, however, change dramatically in AUTHORS, less so in CATH, and no change in SCOP when different criteria are used in training. We found that this is mostly because of the existence of multiple solutions to achieve a similar level of agreement with a given expert annotation. Because there is only minor change in success rates from the requirement of at least 85% overlap, we will report the results based on the agreement in number of domains only in the remaining paper, unless it is explicitly indicated otherwise.
It is of interest to know how success rates change as a function of adjustable parameters. Figure 2 shows how the success rate of predicting the number of domains varies as one of the three parameters changes. This figure is based on the SCOP set. As one can see, the change of success rate is relatively small across a wide range of values of three adjustable parameters around the optimized values (0.53, 0.36, and 34 for Elowcutoff, Eexcesscutoff and Lcut, respectively). The variation of the success rates is <1% for almost the entire range of the parameter values tested. The small variation of the success rates further demonstrates that the optimized parameters obtained for a given annotation are robust.
Figure 2.

The success rates for the SCOP set as a function of one of the three parameters (Elowcutoff, Eexcesscutoff, and Lcut) in DDOMAIN with two other parameters fixed. For Eexcesscutoff (dashed curve in the top figure), Elowcutoff and Lcut are fixed at 0.53 and 34, respectively. For Elowcutoff (solid curve in the top figure), Eexcesscutoff and Lcut are fixed at 0.36 and 34, respectively. For Lcut (solid curve at the bottom figure), Elowcutoff and Eexcesscutoff are fixed at 0.53 and 0.36, respectively. This figure explores the variation of the parameters around the optimized values (0.53, 0.36, and 34 for Elowcutoff, Eexcesscutoff, and Lcut, respectively).
In domain annotations, domain boundaries are clear for some proteins but are more subjective in others. Thus, we divide the SCOP-CATH set into easy and hard sets. In the easy set, SCOP and CATH annotations agree in number of domains while, in the hard set, they disagree. One interesting question is: If DDOMAIN is trained by the easy set, which expert annotation (SCOP or CATH) will DDOMAIN be more consistent with?
To address this question, DDOMAIN was trained by the SCOP-CATH easy-1 set of 941 proteins. The rate of agreement between the DDOMAIN prediction and the SCOP/CATH annotation for the training is 90.8%. The optimal values of Elowcutoff, Eexcesscutoff and Lcut are 0.66, 0.36, and 32, respectively. A similar success rate (89.7%) is obtained for an independent easy-2 test set of 912 proteins. Surprisingly, as Table 2 shows, for the hard set of 448 proteins (where SCOP and CATH disagree in the number of domains) DDOMAIN's annotations are significantly more consistent with SCOP annotations in number of domains. The agreement is 56.9% with SCOP but only 26.3% with CATH. This large 30% difference is surprising considering that DDOMAIN was not trained to favor either SCOP or CATH annotations. The overall success rate in agreeing with SCOP annotations for all training (easy-1) and test sets (easy-2 and hard sets) is 83.8%. This success rate is essentially the same as the success rate of 83.7% in agreeing with SCOP annotations for the whole SCOP-CATH set when DDOMAIN was trained by SCOP annotations (Table 1). Similarly, we found that the success rates in agreeing with CATH annotations for the whole SCOP-CATH set are 78.1% when DDOMAIN is trained by CATH annotations and 78.1% when DDOMAIN is trained with the easy-1 set. Thus, overall success rates are mostly independent of training sets (whether from the easy set or a mix of easy and hard sets) although trained parameters are somewhat dependent on training sets. Again, this indicates that there are multiple solutions to achieve a similar level of agreement with a given expert annotation. DDOMAIN is intrinsically biased toward SCOP annotation (compared to CATH annotation) no matter which subset of SCOP or CATH annotations is used. It should be mentioned that, when at least 85% overlap is used as an additional criterion to measure success rate, easy-set-trained DDOMAIN yields a success rate of 89.5% for the easy-1 set, 88.2% for the easy-2 set, and 52.0% for the hard set. The reduction with the additional criterion is the largest (5%) for the hard set.
Table 2.
Success rates in which the number of expert annotated domains agrees with the number of domains given by PDP, DomainParser 2, DDOMAIN, and the consensus prediction

The easy-set-trained DDOMAIN is further tested in the DomainParser 2 set annotated by SCOP (Table 2). The success rate is 80.9%. Considering the fact that most disagreement between DDOMAIN and SCOP annotations is in the hard set of proteins, a slightly lower success rate (∼81%) in the DomainParser 2 set than in the SCOP-CATH set (∼84%) is due to removal of proteins contained in the easy-1 set from the DomainParser 2 set.
Results on the AUTHORS set given by DDOMAIN trained by the easy-1 set are also shown in Table 2. The success rate is 81.5%. This success rate is comparable to the success rates of 83.7% in SCOP annotations and 78.1% in CATH annotations for the SCOP-CATH set but is a drastic reduction from 90% if trained by AUTHORS annotation. Similarly, Table 2 shows that DDOMAIN trained by AUTHORS annotation gives a significantly lower agreement (4.3%–6.4%) with the SCOP annotations in easy-2, hard, and DomainParser 2 sets. Again, this highlights the difference among different expert annotations.
We tested the effect of energy functions for domain–domain interactions on automatic domain annotation. This is done by using the more realistic, distance-dependent, residue-level DFIRE statistical potential (DDOMAIN-DFIRE) rather than the residue-independent contact interaction (DDOMAIN). The results of DDOMAIN-DFIRE trained by the easy-1 set are shown in Table 2. There is no essential difference between the success rates given by DDOMAIN-DFIRE and by DDOMAIN on the easy set or on the DomainParser 2 set. DDOMAIN-DFIRE gives a lower success rate in agreeing with SCOP but a higher success rate in agreeing with CATH than DDOMAIN in the hard set. DDOMAIN-DFIRE trained by the easy-1 set also gives a slightly higher success rate (82.8%) than DDOMAIN (81.5%) in agreeing with AUTHORS annotations. This is likely due to the fact that the former has a higher success rate in agreeing with CATH annotations which allow more cuts than SCOP for domain annotations (Veretnik et al. 2004). The overall similarity between the performance of DDOMAIN-DFIRE and that of DDOMAIN indicates that a better energy function for estimating the domain–domain interaction is not necessarily useful for generating more consistent domain annotations with other expert-based annotations.
DDOMAIN is compared to two recently developed methods, PDP and DomainParser 2, both of which were trained by SCOP annotations. We also developed a consensus method based on PDP, DomainParser 2, and DDOMAIN. We did not make any attempt to remove proteins used in training PDP and DomainParser 2. This allows us to compare the best performance of the two methods. DomainParser 2 makes a similar level of success (90%) as DDOMAIN in the easy-2 set whereas PDP is not too far behind (84%). The consensus prediction from PDP, DomainParser 2, and DDOMAIN makes a noticeable improvement with a success rate of 92.3%.
For the hard set (where SCOP and CATH disagree in the number of domains), success rates of various automatic programs obviously depend on which annotation is used. Based on the SCOP annotation, the success rates are 29.7%, 43.3%, and 56.9% for PDP, DomainParser 2, and DDOMAIN trained by the easy-1 set, respectively. On the other hand, if the CATH annotation is used, the corresponding success rates are 44.0%, 38.8%, and 26.3%, respectively. Thus, DDOMAIN's annotations are the closest to SCOP annotations. DDOMAIN also gives the highest success rate among single methods in the DomainParser 2 set based on the SCOP annotation. The consensus prediction, while making noticeable improvement in the easy-2 and the DomainParser 2 sets, reduces the agreement with the SCOP annotation and increases the agreement with the CATH annotation in the hard set.
Interestingly, PDP, although trained by the SCOP annotation (Alexandrov and Shindyalov 2003), gives a result that is more consistent with the CATH annotation. Moreover, DomainParser 2, also trained by the SCOP annotation, is only 4% more consistent with the SCOP annotation than with the CATH annotation. In contrast, DDOMAIN is 30% more consistent with SCOP than with the CATH annotation and 13% more consistent with SCOP than DomainParser 2.
Three automatic domain parsers are also tested in the AUTHORS set. In this case, the success rate of easy-set-trained DDOMAIN (or DDOMAIN-DFIRE) is similar to that of PDP and smaller than that of DomainParser 2. Consensus prediction makes a slight improvement over DomainPaser 2 in agreeing with AUTHORS annotations. The slightly worse performance of DDOMAIN than that of DomainParser 2 in this benchmark is likely due to different criteria used by different authors in dividing domains, as shown in Table 1.
It is of interest to know how the accuracy of the methods varies for proteins with different number of domains. Table 3 shows the number of proteins with correctly predicted number of domains along with the number of proteins whose number of domains are overpredicted or underpredicted. The results are based on the entire SCOP set of 2301 proteins. Here, DDOMAIN is trained by the easy set 1. It is clear that the overall success of DDOMAIN in the SCOP set is largely due to its highest success rate (1618/1751, 92%) in predicting single-domain proteins (comparing to 1498/1751, 86% by DomainParser 2 and 1328/1751, 76% by PDP). For proteins with more than one domain, the success rate by DDOMAIN is lower than that by either DomainParser 2 or PDP. In general, DDOMAIN tends to undercut, PDP tends to overcut, and DomainParser 2 is somewhat in between, according to the statistics in Table 3.
Table 3.
Number of proteins whose number of domains is correctly predicted, over-predicted, and under-predicted for the entire SCOP set of 2301 proteins

We can train DDOMAIN to “cut” more as illustrated by AUTHORS-trained DDOMAIN. Table 3 shows that, if DDOMAIN is trained by maximizing the success rate for two-domain and three-domain proteins, the number of correct predictions for single-domain proteins decreases from 1618 to 1516 while the number of correct predictions increases from 251 to 284 for two-domain proteins and from 47 to 56 for three-domain proteins. The overall success rate for 2301 proteins is 81.2%, which is only 2.5% lower than DDOMAIN trained by the full SCOP annotations. The number of correct predictions for single-domain and two-domain proteins is now higher than that of either DomainParser 2 or PDP. The overall performance of this multidomain-trained DDOMAIN decreases for the entire SCOP-CATH set (easy, hard, and DP2) but increases for the AUTHORS set, as expected (Table 2).
The performance of AUTHORS-trained DDOMAIN for one- to five-domain proteins for the AUTHORS set is shown in Table 4. DDOMAIN agrees with the AUTHORS set well for one- (96.8%), two- (82.0%), and three-domain (55.6%) proteins. As a reference, the results of DomainParser 2 and PDP are also shown.
Table 4.
Number of proteins whose number of domains is correctly predicted for the AUTHORS set

DDOMAIN is further tested by a new benchmark (Benchmark-2) (Holland et al. 2006). This new benchmark is an “easy set” in which CATH, SCOP, and AUTHORS all agree on the number of domains. Only one half of the set are available for download. The results are shown in Table 5. For this small set, the performance of DDOMAIN is worse than that of either DomainParser 2 or PDP. This highlights the strong dependence of method performance on benchmarks.
Table 5.
Number of proteins whose number of domains is correctly predicted for the Benchmark-2

Discussion
In this paper, we have proposed a simple method called DDOMAIN for automatic domain parsing of protein structures. The method is based on the principle that inter-domain interaction is weak under a correct domain assignment. The domain–domain interaction is calculated either by number of residue–residue contacts (DDOMAIN) or by a residue-based, distance-dependent statistical pair potential (DDOMAIN-DFIRE). DDOMAIN with an appropriate training yields a prediction that is most consistent with AUTHORS annotations, followed by SCOP and CATH annotations. DDOMAIN yields not only a 96.8% agreement with AUTHORS annotations in single-domain proteins, but also a high 82.0% in two-domain and 55.6% in three-domain proteins. For comparison, the highest agreements between SCOP-multidomain-trained DDMAIN and SCOP annotation are 86.6%, 69%, and 53% for one-, two-, and three-domain proteins, respectively.
It is somewhat surprising that DDOMAIN's annotations are most consistent with AUTHORS annotations in number of domains because AUTHORS assignment is supposed to be the least consistent data set as a result of involvement of many individuals with different opinions on domain definitions (Veretnik et al. 2004). The underlying difference in expert opinions (Veretnik et al. 2004) is that SCOP is based on evolutionary and structural relations whereas AUTHORS emphasizes more on small functional regions. The best use of DDOMAIN is to use the AUTHORS-trained parameter set. However, if one is interested in reproducing a SCOP-like annotation, a SCOP-trained parameter set can be used. More studies are needed to assess if functional regions are a more fundamental determinant than evolution in domain identification. This study is certainly not enough to support that AUTHORS should be the gold standard of protein domains. More studies are certainly needed in this area. For example, what happens if DomainParser 2 is also trained by AUTHORS annotations? Will DomainParser 2 be also more consistent with AUTHORS than with SCOP or CATH?
Veretnik et al. (2004) found that a contact-based energy is too simplistic to make an accurate domain assignment at least for some proteins. However, the use of more realistic distance-dependent knowledge-based DFIRE energy function did not improve the performance of domain assignment. This may indicate that the performance of a domain parser is less sensitive to the accuracy of an interaction energy function, as a result of the somewhat subjective nature of domain definition. However, further studies are certainly needed.
We also tested a simple consensus prediction based on the results of PDP, DomainParser 2, and DDOMAIN. The consensus prediction seems to improve the performance in the easy set but reduce the agreement with SCOP annotations in the hard set. The overall agreement between the consensus prediction and SCOP annotation for the whole SCOP-CATH set (81.7%) is even worse than from the use of DDOMAIN alone (83.8%). Consensus prediction improves over DDOMAIN from 78.1% to 79.2% in agreeing with CATH annotations largely because DomainParser 2 has a better agreement with CATH annotations (78.7%) than DDOMAIN. Similarly, consensus prediction improves over easy-set-trained DDOMAIN from 81.5% to 87.0%, agreeing with AUTHORS annotations largely because DomainParser 2 has a better agreement with AUTHORS annotations (86.1%) than the easy-set-trained DDOMAIN.
In this work, we only compare DDOMAIN with two recently developed methods, PDP and DomainParser 2. This is because the standalone programs for the two methods can be readily obtained and DomainParser 2 has been shown to be more accurate than many methods developed earlier (Guo et al. 2003). Here, we found that DDOMAIN's automatic annotation trained by either SCOP annotations or the easy set has the best consistency with SCOP annotations in number of domains among three SCOP-trained automatic methods (PDP, DomainParser 2, and DDOMAIN). This is true for both single-and two-domain proteins if trained appropriately (Table 3). However, its performance is worse than either PDP or DomainParser 2 when tested in a small benchmark in which SCOP, CATH, and AUTHORS all agree in number of domains (Table 5). This indicates that the performance on a small subset of proteins may vary. Both PDP and DDOMAIN belong to a category of domain parsers that locate domain boundaries based on an analysis of domain–domain interactions whereas DomainParser 2 is a more sophisticated method based on the Ford-Fulkerson algorithm for a contact-network flow problem and a neural network for recognizing overcut domains. The two main differences between PDP and DDOMAIN are that (1) PDP defines a contact based on Cα atoms and DDOMAIN based on side-chain center of mass and (2) DDOMAIN normalizes domain–domain interaction not only by domain sizes but also by the average energy of all possible domain–domain interactions. The latter, which is absent in PDP, may be important for making a method suitable for proteins of any sizes.
One of the major limitations in the current method is the assumption that each structural domain is a continuous segment of its amino acid sequence. However, expert-based annotations sometimes assign two different segments to one domain. A new version of DDOMAIN that divides structures without being restricted by sequence connectivity is in progress.
Acknowledgments
We thank Drs. J. Guo, Y. Xu, D. Xu, N. Alexandrov, and I. Shindyalov who made their programs and databases available for comparison. This work was supported by NIH (R01 GM 966049 and R01 GM 068530), a grant from HHMI to SUNY Buffalo and by the Center for Computational Research, and the Keck Center for Computational Biology at SUNY Buffalo. Y.Z. is also partially supported by a two-base grant (No. 20340420391) from the National Science Foundation of China.
Footnotes
Reprint requests to: Yaoqi Zhou, Indiana University School of Informatics, Indiana University-Purdue University, Indianapolis, IN 46202, USA; e-mail: yqzhou@iupui.edu; fax: (317) 278-9201.
Article and publication are at http://www.proteinscience.org/cgi/doi/10.1110/ps.062597307.
References
- Alexandrov N. and Shindyalov, I. 2003. PDP: Protein domain parser. Bioinformatics 19: 429–430. [DOI] [PubMed] [Google Scholar]
- Bateman A., Coin, L., Durbin, R., Finn, R.D., Hollich, V., Griffiths-Jones, S., Khanna, A., Marshall, M., Moxon, S., Sonnhammer, E.L.L., et al. 2004. The pfam protein families database. Nucleic Acids Res. 32: D138–D141. [DOI] [PMC free article] [PubMed] [Google Scholar]
- Chivian D., Kim, D.E., Malmstrom, L., Bradley, P., Robertson, T., Murphy, P., Strauss, C.E., Bonneau, R., Rohl, C.A., and Baker, D. 2003. Automated prediction of CASP-5 structures using the Robetta server. Proteins 53: 524–533. [DOI] [PubMed] [Google Scholar]
- Crippen G.M. 1978. The tree structural organization of proteins. J. Mol. Biol. 126: 315–332. [DOI] [PubMed] [Google Scholar]
- Guo J.T., Xu, D., Kim, D., and Xu, Y. 2003. Improving the performance of DomainParser for structural domain partition using neural network. Nucleic Acids Res. 31: 944–952. [DOI] [PMC free article] [PubMed] [Google Scholar]
- Heger A. and Holm, L. 2003. Exhaustive enumeration of protein domain families. J. Mol. Biol. 328: 749–767. [DOI] [PubMed] [Google Scholar]
- Holland T.A., Veretnik, S., Shindyalov, I.N., and Bourne, P.E. 2006. Partitioning protein structures into domains: Why is it so difficult? J. Mol. Biol. 361: 562–590. [DOI] [PubMed] [Google Scholar]
- Holm L. and Sander, C. 1994. Parser for protein folding units. Proteins 19: 256–268. [DOI] [PubMed] [Google Scholar]
- Holm L. and Sander, C. 1998. Dictionary of recurrent domains in protein structures. Proteins 33: 88–96. [DOI] [PubMed] [Google Scholar]
- Islam S.A., Luo, J., and Sternberg, M.J. 1995. Identification and analysis of domains in proteins. Protein Eng. 8: 513–525. [DOI] [PubMed] [Google Scholar]
- Jones S., Michie, A., Stewart, M., Swindells, M.B., Orengo, C., and Thornton, J.M. 1998. Domain assignment for protein structures using a consensus approach: Characterization and analysis. Protein Sci. 7: 233–242. [DOI] [PMC free article] [PubMed] [Google Scholar]
- Kundu S., Sorensen, D.C., and Phillips Jr, G.N. 2004. Automatic domain decomposition of proteins by a Gaussian network model. Proteins 57: 725–733. [DOI] [PubMed] [Google Scholar]
- Letunic I., Copley, R.R., Schmidt, S., Ciccarelli, F.D., Doerks, T., Schultz, J., Ponting, C.P., and Bork, P. 2004. SMART 4.0: Towards genomic data integration. Nucleic Acids Res. 32: D142–D144. [DOI] [PMC free article] [PubMed] [Google Scholar]
- Linding R., Russell, R.B., Neduva, V., and Gibson, T.J. 2003. GlobPlot: Exploring protein sequences for globularity and disorder. Nucleic Acids Res. 31: 3701–3708. [DOI] [PMC free article] [PubMed] [Google Scholar]
- Liu J. and Rost, B. 2004. Sequence-based prediction of protein domains. Nucleic Acids Res. 32: 3522–3530. [DOI] [PMC free article] [PubMed] [Google Scholar]
- Murzin A.G., Brenner, S.E., Hubbard, T., and Chothia, C. 1995. SCOP: A structural classification of proteins database for the investigation of sequences and structures. J. Mol. Biol. 247: 536–540. [DOI] [PubMed] [Google Scholar]
- Nagarajan N. and Yona, G. 2004. Automatic prediction of protein domains from sequence information using a hybrid learning system. Bioinformatics 20: 1335–1360. [DOI] [PubMed] [Google Scholar]
- Orengo C., Michie, A., Jones, S., Jones, D., Swindells, M., and Thornton, J. 1997. CATHY: A hierarchic classification of protein domain structures. Structure 5: 1093–1108. [DOI] [PubMed] [Google Scholar]
- Ponting C.P. and Russell, R.R. 2002. Natural history of protein domains. Annu. Rev. Biophys. Biomol. Struct. 31: 45–71. [DOI] [PubMed] [Google Scholar]
- Pugalenthi G., Archunan, G., and Sowdhamini, R. 2005. DIAL: A web-based server for the automatic identification of structural domains in proteins. Nucleic Acids Res. 33: W130–W132. [DOI] [PMC free article] [PubMed] [Google Scholar]
- Siddiqui A.S. and Barton, G.J. 1995. Continuous and discontinuous domains: An algorithm for the automatic generation of reliable protein domain definition. Protein Sci. 4: 233–242. [DOI] [PMC free article] [PubMed] [Google Scholar]
- Sim J., Kim, S.-Y., and Lee, J. 2005. PPRODO: Prediction of protein domain boundaries using neural networks. Proteins 59: 627–632. [DOI] [PubMed] [Google Scholar]
- Sowdhamini R. and Blundell, T.L. 1995. An automatic method involving cluster analysis of secondary structures for the identification of domains in proteins. Protein Sci. 4: 506–520. [DOI] [PMC free article] [PubMed] [Google Scholar]
- Swindells M.B. 1995. A procedure for detecting structural domains in proteins. Protein Sci. 4: 103–112. [DOI] [PMC free article] [PubMed] [Google Scholar]
- Taylor W.R. 1999. Protein structural domain identification. Protein Eng. 12: 203–216. [DOI] [PubMed] [Google Scholar]
- Veretnik S., Bourne, P.E., Alexandrov, N.N., and Shindyalov, I.N. 2004. Toward consistent assignment of structural domains in proteins. J. Mol. Biol. 339: 647–678. [DOI] [PubMed] [Google Scholar]
- von Ohsen N., Sommer, I., Zimmer, R., and Lengauer, T. 2004. Arby, automatic protein structure prediction using profile-profile alignment and confidence measures. Bioinformatics 20: 2228–2235. [DOI] [PubMed] [Google Scholar]
- Wang G. and Dunbrack Jr, R.L. 2003. PISCES: A protein sequence culling server. Bioinformatics 19: 1589–1591. [DOI] [PubMed] [Google Scholar]
- Wernisch L., Hunting, M., and Wodak, S.J. 1999. Identification of structural domains in proteins by a graphic heuristic. Proteins 35: 338–352. [PubMed] [Google Scholar]
- Wodak S.J. and Janin, J. 1981. Location of structural domains in proteins. Biochemistry 20: 6544–6552. [DOI] [PubMed] [Google Scholar]
- Xu Y., Xu, D., and Gabow, H.N. 2000. Protein domain decomposition using a graph-theoretic approach. Bioinformatics 16: 1091–1104. [DOI] [PubMed] [Google Scholar]
- Zhang C., Liu, S., Zhou, H., and Zhou, Y. 2004. An accurate residue-level pair potential of mean force for folding and binding based on the distance-scaled ideal-gas reference state. Protein Sci. 13: 400–411. [DOI] [PMC free article] [PubMed] [Google Scholar]
- Zhou H. and Zhou, Y. 2002. Distance-scaled, finite ideal-gas reference state improves structure-derived potentials of mean force for structure selection and stability prediction. Protein Sci. 11: 2714–2726. [DOI] [PMC free article] [PubMed] [Google Scholar]