

Abstract
Reconstituted cell-free (CF) protein expression systems hold the promise of overcoming the traditional barriers associated with in vivo systems. This is particularly true for membrane proteins, which are often cytotoxic and due to the nature of the membrane, difficult to work with. To evaluate the potential of cell-free expression, we cloned 120 membrane proteins from E. coli and compared their expression profiles in both an E. coli in vivo system and an E. coli-derived cell-free system. Our results indicate CF is a more robust system and we were able to express 63% of the targets in CF, compared to 44% in vivo. To benchmark the quality of CF produced protein, five target membrane proteins were purified and their homogeneity assayed by gel filtration chromatography. Finally, to demonstrate the ease of amino acid labeling with CF, a novel membrane protein was substituted with selenomethionine, purified, and shown to have 100% incorporation of the unnatural amino acid. We conclude that CF is a novel, robust expression system capable of expressing more proteins than an in vivo system and suitable for production of membrane proteins at the milligram level.
Keywords: cell-free protein expression, integral membrane proteins, structural genomics, high-throughput protein expression
Integral membrane proteins (MPs), despite their biological importance, currently account for <1% of all known high resolution protein structures. MPs are notoriously difficult to work with, and expression, detergent solubilization, purification, and crystallization all present unique challenges over their soluble counterparts (White 2004). MPs generally express at much lower levels than soluble proteins and, when in vivo overexpression is successful, the protein can be cytotoxic or incorporated into insoluble inclusion bodies. Following successful MP expression, a suitable detergent condition must also be found that simultaneously extracts the protein from the membrane while retaining the native fold and function. This protein–detergent complex (PDC) is often heterogeneous, creating numerous problems in purification and crystallization. Optimizing purification, assaying protein function, and crystallization all require milligram quantities of protein, and MP expression is therefore a limiting step in macromolecular structure determination (Dobrovetsky et al. 2005; Eshaghi et al. 2005; Korepanova et al. 2005; Columbus et al. 2006; Surade et al. 2006). One recognized alternative is cell-free (CF) expression (Klammt et al. 2004).
CF expression systems are reconstituted reactions based on cellular extracts that recapitulate the expression (i.e., transcription and translation) capabilities of a cell in vitro. CF has a lengthy history of small-scale studies (Zubay 1973), but there has only recently been a concerted effort to adapt these systems to larger (i.e., milligram) scales (Spirin et al. 1988). These adaptations include coupled transcription and translation, enzymatic subsystems to regenerate high-energy nucleotides, and continuous-exchange “feeding” systems via dialysis, all of which allow the reaction to proceed at higher levels for a longer amount of time. Successful CF systems, both prokaryotic (Kigawa et al. 1999; Klammt et al. 2004) and eukaryotic (Endo and Sawasaki 2003; Tyler et al. 2005), have been described. Furthermore, CF-expressed MPs have also recently been used in nuclear magnetic resonance (NMR) experiments (Koglin et al. 2006). Despite this potential, there are no in-depth studies comparing the use of CF and in vivo systems in expressing MPs.
Given the growing evidence for CF expression as a viable approach for producing MPs for structural studies, we decided to compare the in vitro and CF expression profiles of over 100 Escherichia coli MPs. We analyzed the solubility properties of the successfully expressing proteins in two commonly used detergents and purified five of these targets to homogeneity. Finally, to demonstrate the extensibility of our system and flexibility in easily labeling proteins, we successfully incorporate selenomethionine into one purified target. Here, we report the first large-scale attempt to compare the success rate of CF and in vivo systems in expressing MPs and demonstrate the value of CF as a robust complement to current in vivo methods.
Results
Target selection and cloning
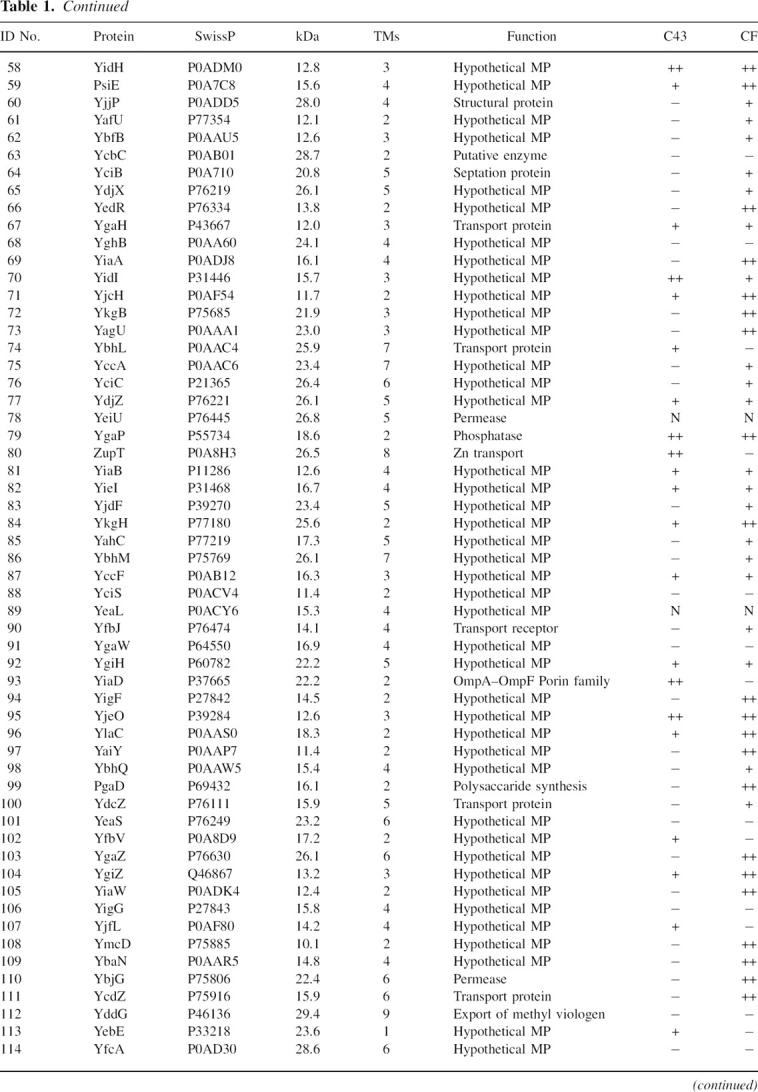
Table 1 shows the 120 E. coli MPs selected for cloning. These targets were selected based on potential for successful expression and structural impact. To achieve this, we selected E. coli MPs that are <30 kDa, possess at least two transmembrane (TM) spanning helices, and if functionally annotated, not part of complex. Sixty percent of the proteins are described as hypothetical membrane proteins. For a positive control, several proteins with known crystal structures and three with a single TM were included. Of the 120 genes targets, 117 and 116 were successfully cloned into the in vivo and CF expression vectors, respectively.
Table 1.
Target list and expression results


Cell-free and in vivo protein expression results
MP expression levels were determined using 2 mL E. coli C43 (Miroux and Walker 1996) growths or 30 μL CF reactions in batch. Several proteins on the list (AqpZ, GlpF, YidJ, and CcmG among others), which express at known levels, were used as positive controls to gauge the expression levels of the other proteins as noted in Table 1. By comparing band intensity on Western blots, we were able to qualitatively assign expression levels. A (−) indicates no protein expression detected on a Western blot. In vivo expressed proteins that had levels ∼<2 mg/L were assigned a (+), and all proteins higher were designated (++). Similar criteria were applied to CF-expressed proteins; the (+) limit was ∼200 μg/mL and those proteins expressing higher were designated (++).
Expression profiles of each target are shown in Table 1 along with each protein's SwissProt ID, molecular weight (MW), predicted number of TM helices, and function. The most striking result is the number of proteins successfully expressed in either system, summarized by a Venn diagram in Figure 1. Of the original 120 proteins, a total of 90 (75%) were expressed. Thirty-six (30%) could be expressed in both systems, 38 (32%) in CF only, and 16 (13%) in in vivo only. Overall, 63% of proteins expressed in CF, while only 44% of proteins expressed in vivo. Thus, we can express the majority of E. coli MPs selected for this study, and combined use of the two systems results in increased coverage of “expression space” (Surade et al. 2006). Given the large number of successful expressers, we next sought to characterize the detergent solubility of these proteins and their potential for purification.
Figure 1.

Venn diagram of expression results. This figure is a Venn diagram to scale showing the expression success for the 120 proteins. Cumulatively, 90 proteins (75%) are expressed; 74 are expressed by CF (38 only in CF) and 52 are expressed in vivo (16 only in in vivo). There is an overlap between the two systems of 36 proteins.
Solubility of in vivo and cell-free produced proteins in DDM and OG
In general, a detergent must stabilize the hydrophobic nature of a MP without disrupting its native state or function. Further biochemistry, including solubilization, purification, and crystallization, therefore requires identifying the optimal detergent conditions for a given MP. With structure determination as an end goal, we focused on two mild nonionic detergents, which have the best history of success in X-ray crystallography (summarized by Hartmut Michel's MP structure database, http://www.mpibp-frankfurt.mpg.de/michel/public/memprotstruct.html), n-Octyl-β-D-glucopyranoside (OG) and n-dodecyl-β-D-maltopyranoside (DDM).
Solubilization efficiency in 270 mM OG or 10 mM DDM was assessed by Western analysis of fractions from before and after a high-speed centrifugation step to pellet unsolubilized membrane material (see Materials and Methods). Two examples are illustrated in Figure 2, where YiaA solubility in DDM is high and YagU solubility in DDM is low, and for all 120 we assigned them as not soluble (−), low solubility (+), and high solubility (++). In our nomenclature, (++) is essentially quantitative extraction from the membrane fraction. Table 2A summarizes the results obtained for the in vivo subset of proteins. Surprisingly, all but one protein were soluble in either OG or DDM to some level and the majority could be quantitatively solubilized in either one or both detergents.
Figure 2.

Solubilization example. Two examples of detergent solubilization assigned as (++) (left panel) and (+) (right panel). Examples are for #69, YiaA and #73, YagU in DDM. Bs and as are the supernatants of before spin and after spin as described in Materials and Methods.
Table 2.
Detergent solubility screening

Table 2B shows several of the CF produced proteins and their solubility in DDM or OG. Eleven of the 15 proteins exhibited some level of solubility and roughly half could be quantitatively solubilized. In the CF reaction, the lesser result may be explained by improper membrane incorporation of the proteins. These reactions are not supplemented with the addition of exogenous lipids or detergents, and it is thought that expressed MPs form a nontraditional “precipitate” which can be solubilized after the reaction (Klammt et al. 2005). This hypothesis is supported by the fact that there is ∼100% agreement between DDM and OG in the CF trials—the well-behaved MPs in nontraditional precipitates can generally be solubilized. As this calls into question the nature of the PDC for a successfully solubilized MP from CF, we next purified a subset of targets to verify homogeneity.
Protein purification of cell-free produced proteins
Given that many MPs have an unknown function, and assays for those with a known function are often complex, one must employ other methods to benchmark the quality of our CF produced proteins (Columbus et al. 2006). One such indicator of purity, homogeneity, and stability is the gel filtration chromatography profile, which can give some estimation of size and monodispersity. It has been our experience that a protein which elutes as a single symmetric peak on a gel filtration column and is stable over time is correctly folded and functional. Furthermore, most of the MP targets in our laboratory, including colicin Ia, GlpF, AqpZ, AmtB, Aqp0, and AqpM among others, with this property were well behaved (i.e., crystallizable) in structural studies.
To verify the behavior of CF-expressed proteins we chose five proteins that expressed well in CF and were soluble in OG. We purified the proteins using Ni2+-based immobilized metal affinity chromatography (IMAC) to show that they bound IMAC resin and eluted as a single, pure sample. Figure 3A shows a Coomassie-stained gel of DgkA, YidG, YijD, PsiE, and YiaA all having a single band at the correct MW. Eluted samples were then run on a gel filtration column to verify homogeneity (Fig. 3B). Four of the five proteins display a well-resolved single peak, indicating a homogenous sample. Such a profile, in the absence of a more rigorous solution scattering analysis, is a good estimate of monodispersity, and thus the majority of targets in CF can be solubilized successfully. This, as demonstrated in other MP CF studies (Berrier et al. 2004; Elbaz et al. 2004), indicates that our expressed proteins (four of five) are well behaved and similar to their in vivo counterparts.
Figure 3.

Purification of CF products. To verify protein behavior, five proteins (IDs 7, 46, 47, 47, 59, and 69) were expressed at the milligram scale, purified, and homogeneity assayed by gel filtration profile. (A) Coomassie-stained gel of IMAC purified proteins. (B) Gel filtration profile showing that four of the five targets are homogeneous.
Selenomethionine labeling of CcmG with cell-free
One advantage of CF is its extensibility, which, for example, makes amino acid labeling trivial. Labeling, something very important for structural studies, can be done simply replacing the natural amino acid with the unnatural in the reaction mixture (Yokoyama 2003). This approach has shown promise in isotopically labeling proteins for NMR (Kigawa et al. 1995; Kainosho et al. 2006; Koglin et al. 2006) and in X-ray crystallography experiments (Kigawa et al. 2002), where the anomalous diffraction (AD) properties of selenomethionine (SeMet) can be used to solve the phase problem. To show the ease of labeling with CF, we set out to fully substitute a protein with SeMet.
CcmG is a thioredoxin protein with one TM helix involved in the maturation of cytochrome c (Thony-Meyer 2002). We have crystallized and collected native diffraction data on in vivo expressed CcmG but required unbiased experimental phases (D. Savage, Z. Newby, C. Anderson, Y. Robles-Colmenares, and R. Stroud, unpubl.), and so decided to try an AD approach via SeMet labeling. CcmG was expressed in a large-scale CF reaction in which methionine had been replaced with L-selenomethionine. Even though we previously found CcmG to be only a (+) expresser in the CF system, we were still able to obtain 5 mg of purified selenomethionine-labeled protein from a 22-mL reaction. In order to verify labeling, we used matrix-assisted laser desorption/ionization (MALDI) mass spectroscopy (MS) on the natural in vivo expressed protein and compared it with the labeled CF-expressed protein. Figure 4 shows an overlay of the two MS peaks from native and labeled CcmG, and a Coomassie-stained gel of the two proteins. Given that there are three methionines in CcmG, we expected to see a shift of 141 Da. The observed shift of 131 Da is well within the error expected for MALDI and indicates 100% incorporation. Thus, CF can be conveniently used to express labeled MPs in the amounts necessary for structural purposes.
Figure 4.

SeMet incorporation. CcmG was labeled by replacing methionine with L-selenomethionine in the CF reaction. Incorporation was assayed by MALDI-MS. Gray denotes native protein (MW 23066kDa) and black is the labeled (23197 kDa) showing a difference of 131 Da. A Coomassie-stained gel of the two products is shown in the inset.
Discussion
Cell-free complements in vivo expression
Our study examines the potential of CF expression as a method for producing MPs for structural analysis. We compared the expression profiles of targets expressed with CF and in vivo methods and show the two can express 63% and 44% of the targets, respectively (Fig. 1). Thus, CF is a more robust system for expressing proteins. This result is interesting given that the CF system is ostensibly identical to the cell—it uses the same transcriptional, translational, and presumably translocation machinery, although it is unclear what components of the latter exist in the reaction. However, the expression of MPs is often cytotoxic, and, since a living cell must balance protein expression with its own viability, CF benefits from its reconstituted nature. It is also striking that the two systems can cumulatively express 75% of all targets. Lack of expression is the first bottleneck in structural studies of MPs, and obtaining 75% of the desired targets is in line with the best current published reports (Eshaghi et al. 2005; Surade et al. 2006). Finally, 30% (36 out of 120) of the targets could be expressed in either system, suggesting there is significant overlap in the abilities of the two systems to express targets. Given the union and intersection of these two large expression profile sets, it is therefore important to evaluate the two expression systems.
When evaluating an expression system, many factors, such as cost, complexity, throughput, and protein quality, must be taken into account. In a structural biology setting, where the fundamental currency is high-resolution crystal diffraction data or well-resolved NMR spectra, the equation becomes pure, homogenous, and stabile protein for the least amount of input. In this respect in vivo expression has many advantages. The protocols, from cloning to purification, are well defined, and nearly all biology laboratories already have some system in place. It is relatively inexpensive, which allows for large-scale growths for milligram production of protein. Finally and most importantly, it has a long history of success. Albeit as seen in this study, this is often <50% of the time. CF, however, is nearly the exact opposite. CF protocols are under development, few laboratories have the expertise, and it is relatively expensive, all of which make obtaining milligram quantities of protein challenging. Nevertheless, our results indicate that CF is more successful than in vivo expression.
Size and TM complexity determines expression levels
From the expression profiles we have shown that CF complements in vivo expression. Due to the large number of proteins screened in this study, we can also categorize the proteins based on their physical properties. We have broken down the expression profiles for both CF and in vivo experiments by MW and number of TM helices, two related properties that have been hypothesized to affect expression levels. From these statistics, we can give some a priori estimation for the expression success of an unknown target.
MW is perhaps the single most important physical property when describing a protein, particularly for hypothetical ones. In essence, MW describes the “complexity” of a MP and thereby also affects the solublization, purification, and biophysical characterization. In a closed system, such as CF, with limited energy and reactants, target protein size can drastically affect expression. Also, larger mRNA transcripts introduce losses from poor transcription efficiency and increased nuclease susceptibility. In Table 3A,B we tabulate the results for CF and in vivo, respectively. Since in this analysis we targeted proteins of a limited size (roughly 10 kDa–30 kDa) we clustered them into small (10–20 kDa) and large (20–30 kDa). The CF results in Table 3A clearly show that smaller proteins (74% success) express significantly better than larger proteins (51% success). Table 3B shows that the E. coli in vivo expression system, for the reasons cited above, is less dependent on MW.
Table 3.
Expression profiles vs. MW

The number of TM helices of an α-helical MP, due to the two-dimensional constraints of a membrane bilayer, also determines its structural complexity. In Table 4A,B we have organized the expression profiles for the CF and in vivo systems versus number of TM helices. Most strikingly, expression success decreases with TM number (most apparent where number of TMs is two to six). This is expected in light of the dependence on MW and the fact that the number of TMs also correlates with MW. What is surprising though is that CF, although clearly more robust, is much more sensitive on TM number than the in vivo system and shows a progressive decrease in success versus number of TMs. We can also conclude that the targets most likely to express well are of lower MW with fewer TM helices. For structural genomics initiatives, where information content of a structure is important, these results suggest MPs with four to six TMs may be good targets to pursue. This is particularly significant for MPs, which often form homo-oligomers from low MW (<30 kDa) monomers. Finally, we conclude that, although CF is more robust than in vivo expression and shows a higher level of success across the board, it is more sensitive to increased MP size and complexity.
Table 4.
Expression profiles vs. number of TM helices

Cell-free proteins behave like their in vivo counterparts
Given CF's increasing prevalence and its complementation of in vivo expression outlined here, it is important to verify that CF produced proteins behave similarly to their in vivo counterparts. Certainly, this has been shown for soluble proteins (Yokoyama 2003; Tyler et al. 2005), but, with the importance of translocation and proper folding within the membrane, this is not so obvious for MPs. Much of the initial CF work on MPs, however, was showing activity for channels and transporters (Berrier et al. 2004; Elbaz et al. 2004). Furthermore, the NMR and functional studies of Dötsch and colleagues on isotopically labeled CF produced MPs in a variety of detergent conditions have shown them to be well behaved and properly folded (Klammt et al. 2005; Koglin et al. 2006). We show here that MPs can be expressed in the absence of any exogenous lipid or detergent and can be solubilized post-reaction, a technique still being explored. The S30 E. coli extract (see Materials and Methods) is a concentrated mixture containing membranes and translocation machinery, but for some proteins it may be useful to include additives (e.g., natural or synthetic lipids) to assist the translocation process. Addressing questions of foldedness and characterization, especially since many are presumed MPs without a known function or assay, will require the use of other biophysical methods (Columbus et al. 2006). We propose here that gel filtration chromatography, which gives a rough measure of size and monodispersity, can be used as a simple benchmark to validate purity, homogeneity, and stability. It is quick, reliable, and useful for both purification and as a quality-check before structural studies.
Cell-free is an extensible system
The addition of exogenous lipids or detergents highlights one of the most powerful features of the CF system. CF is reconstituted and can be viewed as modular, where subsystems can be added, deleted, and modified. One such example is the energy subsystem responsible for regenerating nucleoside triphosphates (NTPs) from high-energy compounds. A coupled transcription-translation CF system requires a highly concentrated pool of NTPs, so CF systems often use an additional enzymatic (i.e., kinase) system to recycle NTPs via other phosphate compounds such as phosphoenolpyruvate or phosphocreatine that are added to the reaction. In our hands such systems are interchangeable (data not shown) and, furthermore, this modularity can be extended to other parts of the reaction. One can imagine the use of chaperones to aid in processes such as folding or disulfide bond formation, both of which can be important for proper membrane incorporation. Finally, as demonstrated by the SeMet substitution of CcmG, extensibility is an easy way to label proteins. The reconstituted nature of the system allows for replacement of any of the 20 natural amino acids with an unnatural (provided they can be loaded by the appropriate aminoacyl tRNA synthetase) amino acid resulting in 100% substitution. With respect to in vivo systems, it is more efficient and requires significantly less unnatural amino acid.
Conclusion and perspectives
Given these successful expression results, we therefore suggest (Fig. 5) a general strategy for the production of MPs for structural studies in both systems. Following target selection, constructs can be generated via ligation-independent cloning (LIC), which allows for simultaneous cloning into multiple destination vectors from a single polymerase chain reaction (PCR) product without the need for proprietary enzyme mixtures (Aslanidis and de Jong 1990). Small-scale growths and reactions cull expressers from nonexpressers, followed by larger-scale experiments with solubility screens to identify well-behaved PDCs. For those targets that can only be expressed/solubilized in one system or the other, the choice is clear and the target can be transitioned to scaling up, characterization, and crystallization. For those expressed in both (30% in our case), however, the choice is more complex. Based on the relative ease outlined above, the most prudent decision is to transition the in vivo expressed target through the pipeline. Then, due to the importance of labeling in both NMR and X-ray experiments, CF expression should be used as necessary in the pipeline once characterization and purification are well defined. Thus, from our results showing CF is a more robust expression system yet requiring more input, we believe CF complements in vivo expression.
Figure 5.

Membrane protein structure determination pipeline. This figure details our proposed pipeline for the expression, solubilization, purification, and structural study of MPs. Black arrows and boxes indicate the traditional in vivo pathway, while gray arrows indicate the most gainful and complementary use of cell-free expression.
Materials and Methods
Cloning of genes
Coding sequences for 120 genes were obtained from Ecocyc using the E. coli K-12 data set (Keseler et al. 2005). The predicted number of TM helices and function (Table 1) are from the Swiss-Prot annotation. For cloning, we used a ligation-independent cloning strategy that allows for PCR products containing LIC overhangs to be directly cloned into any of our LIC expression vectors (Aslanidis and de Jong 1990). For in vivo expression of proteins, genes were cloned into pET3a-based LIC vectors, which contained an N-terminal TEV protease cleavable 6× His tag either with or without a Maltose Binding Protein (MBP) tag. For CF expression of proteins, a high-copy number plasmid was desired so the LIC site of the pET3a-based expression vector was subcloned into pcDNA3.1 (Fig. 6). Primers were designed using the Express Primer Tool for High-Throughput Gene Cloning and Expression (http://tools.bio.anl.gov/bioJAVA/jsp/ExpressPrimerTool/) containing the appropriate LIC overhangs. PCR reactions were done using Phusion polymerase (New England Biolabs) with E. coli genomic DNA and LIC cloned into our expression vectors.
Figure 6.

Sequence of N-terminal tags for LIC vectors. Modified pet3a and pcDNA3.1 (−) vectors were used for in vivo and cell-free expression, respectively.
S30 extract
S30 extract was made based on the method of Kigawa et al. (1995), as modified by Liu et al. (2005). Briefly, a starter culture picked from a single colony of BL21 (DE3) cells (Invitrogen) transformed with the Rosetta II plasmid (Novagen) was used to inoculate at least 6 L of 2× YT media. Cells were grown to an OD600 of 2.0 and then harvested. Cells were then washed with S30A buffer (10 mM Tris-acetate, pH 8.2, 14 mM Mg[OAc]2, 60 mM KOAc, 1 mM dithiothreitol [DTT], 7 mM β-mercaptoethanol [BME]) and then pelleted. The washed cells were then frozen in liquid N2 and stored at −80°C for no more than 3 d. Cells were thawed in S30B buffer (10 mM Tris-acetate, pH 8.2, 14 mM Mg[Oac]2, 60 mM KOAc, 1 mM DTT) and lysed with a C5 EmulsiFlex (Avestin). Lysed cells were centrifuged at 30,000g for 30 min and the supernatant was centrifuged again at 30,000g for 30 min. The supernatant was then concentrated to ∼10–15 mL in a 10 kDa MWCO Amicon Ultra Centrifugal Filter. The concentrate was incubated for 80 min at 37°C and then dialyzed with 2 L of S30B buffer using a 14-kDa dialysis bag (Spectrum) for 1 h. The dialyzed extract was then centrifuged at 30,000g for 30 min with the supernatant being the final S30 extract used in CF. Extract was frozen in liquid N2 and stored for up to 6 mo at −80°C.
The activity of each S30 extract was tested by expressing green fluorescent protein (GFP) using various concentrations of magnesium chloride. The GFP levels were quantified by measuring the fluorescence intensity with a Fluoromax-3 Spectrofluorometer (HORIBA-Yobin Yvon) and compared to a pure sample of known concentration.
T7 RNA polymerase purification
A starter culture from a single colony of BL21 (DE3) cells (Invitrogen) transformed with pT7–911Q plasmid (Ichetovkin et al. 1997) containing a 6× His-tagged T7 polymerase was used to grow 12 L of cells. Once cells reached an OD600 of 0.4–0.6, they were induced for 4 h with 1 mM isopropyl-D-thiogalactoside. Cells were then pelleted and washed in 50 mM Tris-HCl, pH 7.4, 150 mM NaCl buffer. Washed cells were then resuspended in lysis buffer (50 mM Tris-HCl pH 7.4, 150 mM NaCl, 5 mM BME, 5% glycerol, 1 mM imidazole, 100 μM phenylmethylsulfonyl fluoride [PMSF]) and lysed with a C5 EmulsiFlex. Cellular debris was pelleted at 20,000g for 30 min and the supernatant was incubated with IMAC Ni-NTA resin (Qiagen) for 30 min. Ni-bound protein was then washed with lysis buffer and washed again with lysis buffer containing 10 mM imidazole. Ni bound protein was then eluted with lysis buffer containing 100 mM imidazole. Eluted protein was dialyzed overnight in storage buffer (50 mM Tris-HCl, pH 7.7, 100 mM NaCl, 1 mM EDTA, 50% glycerol, 10 mM DTT) in a 14-kDa dialysis bag. All procedures were carried out at 4°C or on ice. The T7 was stored at −20°C for up to 1 yr.
In vivo protein expression and solubility
For small-scale in vivo protein expression, BL21 (DE3) C43 cells (Avidis) (Miroux and Walker 1996) were transformed with the in vivo expression constructs. Single colonies were used to grow 2 mL of cells overnight at 37°C in auto induction media (0.5% glycerol, 0.5% glucose, 0.2% a-lactose, 25 mM Na2HPO4, 25 mM M KH2PO4, 50 mM NH4Cl, 5 mM Na2SO4, and 2 mM MgSO4) (Studier 2005). Cells were harvested and resuspended in 100 mL lysis buffer (20 mM Tris-HCl, pH 7.4, 150 mM NaCl, 1 mg/mL lysozyme [EMD Biosciences]), complete protease inhibitor cocktail EDTA-free (Roche), and 10 U/mL Benzonase (Novagen) for 1 h at 4°C. Sodium dodecyl sulfate (SDS) was added to a final concentration of 2% and incubated for an additional hour at 4°C. Cellular debris was pelleted at 16,000g, and supernatant containing SDS soluble protein was diluted with an equal volume of 2× SDS loading buffer (125 mM Tris-HCl pH 6.8, 4% SDS, 20% glycerol, 5 mM BME, and 0.005% Bromophenol Blue) and detected by Western blot analysis using an anti-6× His horseradish peroxidase conjugated antibody (Santa Cruz Biotech).
For large-scale protein expression, 250 mL–12 L of auto-induction media growth from a single BL21(DE3) C43 colony was harvested and resuspended in lysis buffer (20 mM Tris-HCl, pH 7.4, 100 mM NaCl, 100 μM PMSF, and 4 mM BME). Cells were lysed with the EmulsiFlex, and undisturbed cells were pelleted at 10,000g for 30 min. The supernatant was pelleted at 200,000g for 1 h to collect membranes. Membranes were solubilized in OG or DDM solubilization buffer (20 mM Tris pH 7.4, 150 mM NaCl, 10% glycerol, 4 mM BME, 100 μM PMSF, and 270 mM OG or 10 mM DDM) at 4°C overnight, which we call the before spin. Soluble protein was collected from the supernatant of a 200,000g spin for 30 min, which we call the after spin. A qualitative analysis of protein solubility in DDM and OG was done by comparing the intensity of the before-spin and after-spin band on a Western blot.
Cell-free protein expression and solubility
Small-scale 30-μL test reactions were carried out on all targets for 3 h at 37°C in parallel (see column one of Table 5 for reaction ingredients). An equal amount of 2× SDS loading buffer was added and run on a SDS-polyacrylamide electrophoresis gel (SDS-PAGE). Expression levels were qualitatively determined by Western blot analysis.
Table 5.
Cell-free reaction components

Large-scale reactions were done in 25 kDa dialyzers (Spectrum) bathed in feeder solution of 10–20 times the reaction volume (Table 5; Klammt et al. 2004). Reactions ranging from 2 to 22 mL were run overnight at 37°C with gentle shaking. Solubility of the reaction products was tested either by first pelleting at 100,000g for 20 min and then washing with 20 mM Tris-HCl pH 7.4, 150 mM NaCl before solubilizing in DDM or OG buffer or by diluting the reaction 5× in DDM or OG solubilization buffer. Solubility of each protein in DDM or OG was done in the same before-spin/after-spin manner as described above.
Protein purification
Proteins soluble in OG were incubated at 4°C with IMAC Ni-NTA resin for 30 min. Protein bound beads were washed with OG size exclusion buffer (SEC) (20 mM Tris-HCl pH 7.4, 100 mM NaCl, 10% glycerol, 2 mM DTT, 40 mM OG) containing 15–25 mM imidazole and eluted with OG SEC buffer containing 300 mM imidazole. The elution was then desalted into OG SEC buffer using a 10DG disposable desalting column (Biorad) and concentrated to 1 mL in a 10 kDa MWCO Ultra Centrifugal Filter (Amicon). The concentrated protein was injected on a Superdex 200 gel filtration column at 0.33 mL/min running the SEC mobile phase. Peak fractions were collected and assayed by SDS-PAGE. The single peak fraction containing purified protein was collected and concentrated to 10 mg/mL for crystal screens.
Selenomethionine labeling and mass spectrometry
Cell-free synthesized protein was purified as described above with the exception of using L-selenomethionine (Avanti) in the reaction mixture. For MS, an aliquot of 10 mg/mL selenomethione-labeled CcmG was diluted 10:1 in water to lower salt concentration and then mixed 1:1 with a solution of saturated cinnamic acid, 50% acetonitrile, and 0.1% trifluoroacetic acid for matrix formation. The sample was analyzed with a MALDI-MS (Applied Biosystems).
Acknowledgments
We thank Christian Klammt and the Dötsch laboratory for their generosity and expertise in cell-free expression. We also appreciate stimulating discussions with Shimon Schuldiner and helpful manuscript suggestions from Pascal Egea. LIC plasmids were kindly provided by James Berger. D.F.S. was supported by a Burroughs Wellcome Trainee Fellowship. The Center for Structures of Membrane Proteins is supported by NIH grant GM074929.
Footnotes
Reprint requests to: Robert M. Stroud, Department of Biochemistry and Biophysics, University of California at San Francisco, 600 16th Street, San Francisco, CA 94158-2517, USA; e-mail: stroud@msg.ucsf.edu; fax: (415) 476-1902.
Abbreviations: CF, cell-free; MP, membrane protein; NMR, nuclear magnetic resonance; PDC, protein–detergent complex; TM, transmembrane; MW, molecular weight; OG, n-Octyl-β-D-glucopyranoside; DDM, n-dodecyl-β-D-maltopyranoside; IMAC, immobilized metal affinity chromatography; NTP, nucleoside triphosphates; PCR, polymerase chain reaction; LIC, ligation-independent cloning.
Article and publication are at http://www.proteinscience.org/cgi/doi/10.1110/ps.062696307.
References
- Aslanidis C. and de Jong, P.J. 1990. Ligation-independent cloning of PCR products (LIC-PCR). Nucleic Acids Res. 18: 6069–6074. [DOI] [PMC free article] [PubMed] [Google Scholar]
- Berrier C., Park, K.H., Abes, S., Bibonne, A., Betton, J.M., and Ghazi, A. 2004. Cell-free synthesis of a functional ion channel in the absence of a membrane and in the presence of detergent. Biochemistry 43: 12585–12591. [DOI] [PubMed] [Google Scholar]
- Columbus L., Lipfert, J., Klock, H., Millett, I., Doniach, S., and Lesley, S.A. 2006. Expression, purification, and characterization of Thermotoga maritima membrane proteins for structure determination. Protein Sci. 15: 961–975. [DOI] [PMC free article] [PubMed] [Google Scholar]
- Dobrovetsky E., Lu, M.L., Andorn-Broza, R., Khutoreskaya, G., Bray, J.E., Savchenko, A., Arrowsmith, C.H., Edwards, A.M., and Koth, C.M. 2005. High-throughput production of prokaryotic membrane proteins. J. Struct. Funct. Genomics 6: 33–50. [DOI] [PubMed] [Google Scholar]
- Elbaz Y., Steiner-Mordoch, S., Danieli, T., and Schuldiner, S. 2004. In vitro synthesis of fully functional EmrE, a multidrug transporter, and study of its oligomeric state. Proc. Natl. Acad. Sci. 101: 1519–1524. [DOI] [PMC free article] [PubMed] [Google Scholar]
- Endo Y. and Sawasaki, T. 2003. High-throughput, genome-scale protein production method based on the wheat germ cell-free expression system. Biotechnol. Adv. 21: 695–713. [DOI] [PubMed] [Google Scholar]
- Eshaghi S., Hedren, M., Nasser, M.I., Hammarberg, T., Thornell, A., and Nordlund, P. 2005. An efficient strategy for high-throughput expression screening of recombinant integral membrane proteins. Protein Sci. 14: 676–683. [DOI] [PMC free article] [PubMed] [Google Scholar]
- Ichetovkin I.E., Abramochkin, G., and Shrader, T.E. 1997. Substrate recognition by the leucyl/phenylalanyl-tRNA-protein transferase. Conservation within the enzyme family and localization to the trypsin-resistant domain. J. Biol. Chem. 272: 33009–33014. [DOI] [PubMed] [Google Scholar]
- Kainosho M., Torizawa, T., Iwashita, Y., Terauchi, T., Mei Ono, A., and Guntert, P. 2006. Optimal isotope labelling for NMR protein structure determinations. Nature 440: 52–57. [DOI] [PubMed] [Google Scholar]
- Keseler I.M., Collado-Vides, J., Gama-Castro, S., Ingraham, J., Paley, S., Paulsen, I.T., Peralta-Gil, M., and Karp, P.D. 2005. EcoCyc: A comprehensive database resource for Escherichia coli. Nucleic Acids Res. 33: D334–D337. [DOI] [PMC free article] [PubMed] [Google Scholar]
- Kigawa T., Muto, Y., and Yokoyama, S. 1995. Cell-free synthesis and amino acid-selective stable isotope labeling of proteins for NMR analysis. J. Biomol. NMR 6: 129–134. [DOI] [PubMed] [Google Scholar]
- Kigawa T., Yabuki, T., Yoshida, Y., Tsutsui, M., Ito, Y., Shibata, T., and Yokoyama, S. 1999. Cell-free production and stable-isotope labeling of milligram quantities of proteins. FEBS Lett. 442: 15–19. [DOI] [PubMed] [Google Scholar]
- Kigawa T., Yamaguchi-Nunokawa, E., Kodama, K., Matsuda, T., Yabuki, T., Matsuda, N., Ishitani, R., Nureki, O., and Yokoyama, S. 2002. Selenomethionine incorporation into a protein by cell-free synthesis. J. Struct. Funct. Genomics 2: 29–35. [DOI] [PubMed] [Google Scholar]
- Klammt C., Lohr, F., Schafer, B., Haase, W., Dotsch, V., Ruterjans, H., Glaubitz, C., and Bernhard, F. 2004. High level cell-free expression and specific labeling of integral membrane proteins. Eur. J. Biochem. 271: 568–580. [DOI] [PubMed] [Google Scholar]
- Klammt C., Schwarz, D., Fendler, K., Haase, W., Dotsch, V., and Bernhard, F. 2005. Evaluation of detergents for the soluble expression of α-helical and β-barrel-type integral membrane proteins by a preparative scale individual cell-free expression system. FEBS J. 272: 6024–6038. [DOI] [PubMed] [Google Scholar]
- Koglin A., Klammt, C., Trbovic, N., Schwarz, D., Schneider, B., Schafer, B., Lohr, F., Bernhard, F., and Dotsch, V. 2006. Combination of cell-free expression and NMR spectroscopy as a new approach for structural investigation of membrane proteins. Magn. Reson. Chem. 44: S17–S23. [DOI] [PubMed] [Google Scholar]
- Korepanova A., Gao, F.P., Hua, Y., Qin, H., Nakamoto, R.K., and Cross, T.A. 2005. Cloning and expression of multiple integral membrane proteins from Mycobacterium tuberculosis in Escherichia coli. Protein Sci. 14: 148–158. [DOI] [PMC free article] [PubMed] [Google Scholar]
- Liu D.V., Zawada, J.F., and Swartz, J.R. 2005. Streamlining Escherichia coli S 30 extract preparation for economical cell-free protein synthesis. Biotechnol. Prog. 21: 460–465. [DOI] [PubMed] [Google Scholar]
- Miroux B. and Walker, J.E. 1996. Over-production of proteins in Escherichia coli: Mutant hosts that allow synthesis of some membrane proteins and globular proteins at high levels. J. Mol. Biol. 260: 289–298. [DOI] [PubMed] [Google Scholar]
- Spirin A.S., Baranov, V.I., Ryabova, L.A., Ovodov, S.Y., and Alakhov, Y.B. 1988. A continuous cell-free translation system capable of producing polypeptides in high yield. Science 242: 1162–1164. [DOI] [PubMed] [Google Scholar]
- Studier F.W. 2005. Protein production by auto-induction in high density shaking cultures. Protein Expr. Purif. 41: 207–234. [DOI] [PubMed] [Google Scholar]
- Surade S., Klein, M., Stolt-Bergner, P.C., Muenke, C., Roy, A., and Michel, H. 2006. Comparative analysis and “expression space” coverage of the production of prokaryotic membrane proteins for structural genomics. Protein Sci. 15: 2178–2189. [DOI] [PMC free article] [PubMed] [Google Scholar]
- Thony-Meyer L. 2002. Cytochrome c maturation: A complex pathway for a simple task? Biochem. Soc. Trans. 30: 633–638. [DOI] [PubMed] [Google Scholar]
- Tyler R.C., Aceti, D.J., Bingman, C.A., Cornilescu, C.C., Fox, B.G., Frederick, R.O., Jeon, W.B., Lee, M.S., Newman, C.S., Peterson, F.C., et al. 2005. Comparison of cell-based and cell-free protocols for producing target proteins from the Arabidopsis thaliana genome for structural studies. Proteins 59: 633–643. [DOI] [PubMed] [Google Scholar]
- White S.H. 2004. The progress of membrane protein structure determination. Protein Sci. 13: 1948–1949. [DOI] [PMC free article] [PubMed] [Google Scholar]
- Yokoyama S. 2003. Protein expression systems for structural genomics and proteomics. Curr. Opin. Chem. Biol. 7: 39–43. [DOI] [PubMed] [Google Scholar]
- Zubay G. 1973. In vitro synthesis of protein in microbial systems. Annu. Rev. Genet. 7: 267–287. [DOI] [PubMed] [Google Scholar]