

Abstract
Amyloid fibril depositions are associated with many neurodegenerative diseases as well as amyloidosis. The detailed molecular mechanism of fibrillation is still far from complete understanding. In our previous study of in vitro fibrillation of hen egg white lysozyme, an irreversible partially unfolded intermediate was characterized. A similarity of unfolding kinetics found for the secondary and tertiary structure of lysozyme using deep UV resonance Raman (DUVRR) and tryptophan fluorescence spectroscopy leads to a hypothesis that the unfolding might be a two-state transition. In this study, chemometric analysis, including abstract factor analysis (AFA), target factor analysis (TFA), evolving factor analysis (EFA), multivariate curve resolution–alternating least squares (ALS), and genetic algorithm, was employed to verify that only two principal components contribute to the DUVRR and fluorescence spectra of soluble fraction of lysozyme during the fibrillation process. However, a definite conclusion on the number of conformers cannot be made based solely on the above spectroscopic data although chemometric analysis suggested the existence of two principal components. Therefore, electrospray ionization mass spectrometry (ESI-MS) was also utilized to address the hypothesis. The protein ion charge state distribution (CSD) envelopes of the incubated lysozyme were well fitted with two principal components. Based on the above analysis, the partial unfolding of lysozyme during in vitro fibrillation was characterized quantitatively and proven to be a two-state transition. The combination of ESI-MS and Raman and fluorescence spectroscopies with advanced statistical analysis was demonstrated to be a powerful methodology for studying protein structural transformations.
Keywords: two-state transition, amyloid fibrils, chemometric analysis, deep UV resonance Raman spectroscopy, electrospray ionization mass spectrometry
Newly synthesized peptide chain folds into specific three-dimensional structure based on the information encoded in amino acid sequence and biological environment where it resides (Anfinsen 1973; Kelly 1998b). It is therefore not surprising that, under certain conditions, even physiologically functional proteins can misfold and assemble into alternative conformations that may have adverse effects (Kelly 1997; Dobson 2003; Uversky and Fink 2004). Among them are amyloid fibril depositions that are associated with many neurodegenerative diseases, such as Alzheimer's disease, Parkinson's diseases, amyotrophic lateral sclerosis, prion diseases, etc. (Bossy-Wetzel et al. 2004; Ross and Poirier 2004). Amyloid fibril depositions in peripheral organs are also found in autosomal dominant hereditary amyloidosis (Pepys et al. 1993), type II diabetes (Westermark et al. 1987), and immunoglobulin light chain associated amyloidosis (Glenner et al. 1976). The molecular mechanism of fibrillation involving protein misfolding and further assembling into insoluble deposits with highly ordered cross-β structure is undergoing extensive study (Kelly 1998a; Dobson 2003; Tycko 2004; Uversky and Fink 2004; Ban et al. 2006; Daggett 2006). The cross-β structure consists of extended parallel/antiparallel β-strands with 0.47-nm spacing arranged perpendicular to the long axis of the fibrils by the mating of side chains, which is termed steric zipper (Sunde and Blake 1998; Serpell 2000; Nelson et al. 2005). The β-strands are hydrogen-bonded into sheets that are running parallel to the axis of the fibrils in a twisted manner with 1.0-nm spacing, which is called protofilament (Tycko 2004; Eisenberg et al. 2006). Several protofilaments arrange laterally around a “hollow” center to form unbranched and straight fibrils, which are usually ∼10 nm in diameter with length ranging from hundreds of nanometers to tens of micrometers (Sunde and Blake 1998; Serpell 2000; Wetzel 2002).
Although amyloid depositions are usually the major histological character for the neurodegenerative diseases, it has been postulated that a misfolded/partially unfolded intermediate of fibril formation might be the major culprit responsible for the adverse physiological effects (Bellotti et al. 2000; Blanch et al. 2000; Hardy and Selkoe 2002; Lashuel et al. 2002; Bucciantini et al. 2004). It is thought that an intermediate, which is devoid of well-characterized tertiary structure while retaining a certain level of secondary structure, is essential for the conformational changes that lead to the fibril formation (Bellotti et al. 2000; Goers et al. 2002; Cao et al. 2004; Uversky and Fink 2004; Surewicz et al. 2006). This partially unfolded intermediate shares many conformational properties with an early intermediate of protein folding, a premolten globule state. The intrinsic flexibility of the partially unfolded conformation is essential for the protein to initiate the structural rearrangement that leads to the fibril formation (Uversky and Fink 2004). Consequently, characterizing protein structural evolution at the early stages of fibrillation is important for understanding the overall biochemical mechanism of fibril formation as well as for developing new therapeutic strategies against the devastating diseases.
Many biophysical methods such as solution NMR (Chamberlain et al. 2001; Khurana et al. 2001; Canet et al. 2002), FT-IR (Khurana et al. 2001; Adams et al. 2002), CD (Goda et al. 2000; Khurana et al. 2001; McLaughlin et al. 2006), small-angle X-ray/neutron scattering (Hirai et al. 1999; Yonezawa et al. 2002), etc., have been utilized for studying the molecular mechanism of amyloid fibril formation. However, the insolubility of amyloid fibrils poses serious limitations to the application of these conventional techniques because of the light scattering nature of the samples. Raman spectroscopy is able to characterize such system because, by its nature, Raman effect is a light scattering phenomenon. Utilization of UV irradiation at ∼200 nm enables selective resonance enhancement of vibrational modes from amide chromophore (i.e., peptide bond), the building block of a polypeptide backbone. The technique, deep UV resonance Raman (DUVRR) spectroscopy, has been shown to be a powerful tool for structural characterization of proteins and polypeptides (Chi et al. 1998; Asher 2001; Lednev et al. 2005; Xu et al. 2005; JiJi et al. 2006). We have recently demonstrated that DUVRR spectroscopy can be used for probing structural evolution of an amyloidogenic protein at all stages of fibril formation (Xu et al. 2005).
Electrospray ionization mass spectrometry (ESI-MS) is a well established method for characterizing protein structural transition (Hooke et al. 1995; Konermann 2004; Kaltashov and Eyles 2005; Craig et al. 2006). The technique has also been applied in studying the amyloid fibrillation of amyloidogenic proteins, lysozyme in particular (Nettleton and Robinson, 2000; Caddy and Robinson 2006). The analysis of different ion charge state distribution (CSD) envelopes derived from different protein conformations is one of the methods for monitoring protein structural transition by ESI-MS (Chowdhury et al. 1990; Loo et al. 1991). ESI-MS has proven particularly useful for detection and characterization of folding/unfolding intermediates (Grandori 2002; Haq et al. 2005; Wintrode et al. 2005) and for kinetic studies of protein structural transitions (Konermann 2004; Furdui et al. 2006; Pan et al. 2006). It has been well documented that an unfolded protein molecule can accommodate more protons upon desolvation than can a compact native protein molecule because of the increased solvent-exposed surface area (Mohimen et al. 2003). In particular, various forms of disulphide-intact and disulphide-reduced lysozyme produced by electrospray ionization have been discriminated based on their CSD signatures (Valentine et al. 1997).
There are numerous studies on lysozyme structural changes using ESI-MS in conjunction with other techniques. For instance, ESI-MS combined with stop-flow fluorescence and circular dichroism was used in characterizing lysozyme refolding intermediates and determining the mechanism of refolding (Matagne et al. 1998; Canet et al. 1999; Kulkarni et al. 1999). Also, the role of native-like α-domain intermediate in controlling the kinetics of lysozyme refolding was demonstrated by using ESI-MS (Matagne et al. 2000). Further, the structure of the partially unfolded intermediate that is responsible for amyloid fibril formation has also been proposed based on NMR and mass spectroscopic studies of two variants of human lysozyme (Dumoulin et al. 2005).
Many proteins have been demonstrated to be able to form amyloid fibrils under certain destabilizing conditions (Uversky and Fink 2004). In the case of hen egg white lysozyme (herein refer to as lysozyme), conditions such as heating (Krebs et al. 2000; Arnaudov and De Vries 2005; Xu et al. 2005), chemical denaturation (Vernaglia et al. 2004), chemical denaturation and reduction (Cao et al. 2004; Gu et al. 2004), addition of alcohols (Hoshino et al. 1997; Goda et al. 2000; Cao et al. 2004), etc., have been reported to facilitate the formation of fibrils. Using DUVRR spectroscopy, we have recently shown that an irreversible unfolding of hen egg white lysozyme at 65°C and low pH is the first step of fibrillation (Xu et al. 2005). The partially unfolded intermediate has been concluded to retain certain level of α-helix structure (M. Xu, V.V. Ermolenkov, W. He, V.N. Uversky, L. Fredriksen, and I.K. Lednev, in prep.) However, the molecular mechanism of this irreversible transition is yet to be understood.
The lysozyme DUVRR spectroscopic signature comprises amide vibrational modes (Amide I, Amide II, Amide III, and Cα-H bending) and bands arising from aromatic amino acid side chains. The amide vibrational modes provide information on the protein secondary structure, while phenylalanine, a natural DUVRR spectroscopic biomarker (Xu et al. 2005), reports on the tertiary structural evolution. Both secondary and tertiary structures have been found to evolve in a mono-exponential fashion with the same characteristic time of 28 ± 2 h during the irreversible partial unfolding of hen egg white lysozyme (Xu et al. 2005). The latter allowed us to postulate that the irreversible unfolding of lysozyme during fibril formation could be a two-state transition. Testing this hypothesis is the major goal of the study reported here.
Thermal melting of small globular protein can often be described as a two-state transition, i.e., a two-state, intramolecular, first-order reaction (Privalov 1979; Pfeil 1981; Jackson 1998; Dantas et al. 2003). Microcalorimetry study showed that the temperature induced melting of lysozyme is a two-state transition (Privalov and Khechinashvili 1974). Thermal unfolding of lysozyme has been well documented to be a reversible process (Velicelebi and Sturtevant 1979). Even the enzymatic activity of lysozyme is partially restored after consecutive heating and cooling (Velicelebi and Sturtevant 1979). Oliva and Muňoz (2004) have recently developed a simple thermodynamic approach for discriminating between two-state and downhill folding (Yang and Gruebele 2004). Their approach is based on the combination of a structural probe of the local backbone conformation and two different denaturing procedures, such as chemical and thermal denaturation. It is not clear at the moment whether the chemical denaturation of lysozyme might result in the formation of the same intermediate product that formed during the prolonged incubation at elevated temperature and low pH. Therefore, we utilized a different approach that combines three spectroscopic/spectrometric techniques: DUVRR spectroscopy, intrinsic tryptophan fluorescence spectroscopy, and ESI-MS. In addition, chemometric analysis was used to retrieve quantitative statistical information from Raman, fluorescence spectroscopic, and mass spectrometric data. Although each of the three techniques was found to have certain limitations, their combined application allowed us to conclude definitively that the irreversible partial unfolding of lysozyme proceeds via a two-state transition.
Results and Discussion
Lysozyme fibrils were prepared following a well-documented procedure (Krebs et al. 2000). Lysozyme samples (14 mg/mL at pH 2.0) were incubated at 65°C for various times and cooled to room temperature, at which all further treatment and analysis were done. This approach allowed us to focus on the irreversible transformations of the protein caused by the incubation (Xu et al. 2005). In fact, based on DUVRR spectra of lysozyme incubated for 24 h, no noticeable changes in protein structure were observed when a 65°C sample (after the incubation) was cooled to room temperature (M. Xu, V.V. Ermolenkov, W. He, V.N. Uversky, L. Fredriksen, and I.K. Lednev, in prep.). The latter indicated that the irreversible transformations dominated structural changes of lysozyme caused by a prolonged incubation. Even after a prolonged incubation, lysozyme was not completely unfolded since there was still ∼6% of α-helical contribution as estimated from the lysozyme DUVRR (Xu et al. 2005) and far-UV CD data (M. Xu, V.V. Ermolenkov, W. He, V.N. Uversky, L. Fredriksen, and I.K. Lednev, in prep.). A gelatinous phase consisting of fibrils started to appear after a lag time of ∼2 d (Krebs et al. 2000). The solution and gelatinous parts of the samples were separated by centrifugation and characterized separately (Xu et al. 2005). Fluorescence, DUVRR spectroscopy, and ESI-MS were utilized for characterizing the structural composition of the soluble fractions of lysozyme samples incubated for various times. DUVRR spectra were measured from the soluble fractions as obtained, while the soluble fractions were diluted appropriately for tryptophan fluorescence and ESI-MS measurements (for details, see Materials and Methods).
A comprehensive statistical analysis of ESI-MS, fluorescence, and DUVRR spectra was utilized for determining the evolution of lysozyme structural composition during the early stages of fibrillation. In particular, the number of significant (principal) components was established for all three experimental data sets using the chemometric approach. An unambiguous conclusion about the number of principal components in a data set is often difficult, if not impossible, because of random and systematic experimental errors (Malinowski 2002). The determination of the true number of significant factors for data with uncertainty is not a trivial task. No criterion for determining the number of factors is completely satisfactory when used alone (Malinowski 2002). Therefore, both empirical methods and methods requiring the knowledge of experimental error are normally utilized to draw a more reliable conclusion. The estimation of the experimental error in ESI mass spectra was not straightforward because of relatively large error of the CSD envelopes (see below). This significantly complicated the application of chemometric analysis for the ESI-MS data and therefore required additional experiments for estimating the experimental uncertainty. As opposed to ESI-MS, the experimental error estimated from the average noise amplitude in fluorescence and DUVRR spectra can be used easily as a criterion for the goodness of proposed models. Empirical chemometric methods such as Malinowski factor indicator function (IND), autocorrelation, cross-validation, etc. (see below), were appropriate for all three types of experimental data and showed consistent results for all three data sets. The combined application of various statistical criteria allowed us to make a solid conclusion about the validity of the two-component model from DUVRR, fluorescence, and ESI-MS data.
Lysozyme unfolding characterized by ESI-MS
The ESI mass spectra for the soluble fraction of lysozyme samples incubated for various times were recorded in the positively charged ion mode using an Agilent 1100 series LC/MSD-SL ion trap system. All the samples were measured under the same optimized instrumental condition in order to minimize the effect of mass discrimination from ion trap mass spectrometer. Three characteristic spectra of lysozyme obtained after the incubation for 0, 14, and 96 h are shown in Figure 1. The CSD envelope obtained for nonincubated lysozyme in pH 2.0 solution was very narrow (Fig. 1A) that indicated a compact conformation of the protein under acidic conditions, which was stabilized presumably by four disulfide bonds. The fraction of compact lysozyme in the 96-h incubated sample was estimated to be ∼4% according to the 30-h characteristic time of unfolding (Xu et al. 2005). In our experiments, the sensitivity of the ESI-MS detector to compact protein was about half of the sensitivity to the unordered lysozyme. Corrected for this difference in sensitivity, the spectral contribution of compact lysozyme to the ESI mass spectrum of 96-h incubated sample was ∼2%. This allowed us to treat the ESI mass spectrum of 96-h incubated lysozyme as the pure spectrum of the partially unfolded protein.
Figure 1.

ESI mass spectra of pH 2.0 lysozyme solution (14 mg/mL) incubated at 65°C for 5 min (A), 14 h (B), and 96 h (C). The inset of B shows the magnified view of the dotted rectangular where the charge state “9+” includes peaks corresponding to different water adducts and dehydration products. The fittings of the charge state distribution (CSD) envelopes for 5-min (D); 14-h (E), and 96-h (F) incubated lysozyme are shown on the right panel. The solid curves are the experimental CSD envelopes, while the dashed curves are the two-component fittings. Major ion peaks that are derived from the fragments are drawn in dashed lines. The ion peaks labeled with the underlined charge state are derived from a fragment of 8644 Da.
The compact conformer bears fewer positive charges. As a result, the ion peaks corresponding to the compact conformation appeared in the high mass-to-charge (m/z) region with the peak of [M+9H]9+ ions being the most abundant in the series under the experimental conditions (Fig. 1A).
The unfolded conformer, on the other hand, is capable of accepting a larger number of protons (Miranker et al. 1996) forming peaks corresponding to [M+nH]n+ ions with n ranging from eight to 16. [M+13H]13+ ions produced the most abundant peak in the series (Fig. 1B,C). In addition to [M+nH]n+ ions, the ESI mass spectrum of the unfolded protein displayed peaks due to [M+nH−xH2O]n+ (x = 1∼2) and [M+nH+yH2O]n+ ions (Fig. 1B, inset). These peaks could come from the formation of water adducts. This process is thermodynamically favorable since the water molecules could efficiently solvate protein surface with an excessive charge (Hoaglund-Hyzer et al. 1999). However, other processes such as hydrolysis could also account for these peaks (see below). In our study, the most intense peaks of [M+nH+yH2O]n+ ions corresponded to mono-and di-solvates (Fig. 1B, inset). We attempted to suppress the formation of the solvates and reduce the dehydration process by varying the instrumental parameters, such as increasing nebulizing gas pressure, dry gas temperature, dry gas flow rate, or fragmentation voltage or changing the solvent flow. No change in peak intensities within a specific charge state group was found.
Also, a variety of factors may affect the results of the ESI-MS in studying protein conformational changes (Rockwood et al. 1991; Mirza and Chait 1997; Hearn et al. 2002; Samalikova et al. 2004). We tested the effect of spray voltage and other ion source settings (nebulizer gas pressure, dry gas pressure and temperature, cap exit voltage, spray voltage, etc.) on the mass spectra of both compact and the partially unfolded lysozyme. None of the experimental parameters were shown to induce either unfolding of the compact conformation or refolding of the partially unfolded conformation (data not shown).
Processes associated with lysozyme incubation at low pH and elevated temperature could be far more complicated than just protein unfolding. Chemical reactions such as deamination, acid hydrolysis, oxidation, disulfide bond scrambling, etc., could also take place. For instance, the [M+nH-xH2O]n+ ions could be the product of dehydrolysis or deamination (Kim et al. 2002). On the other hand, intact disulfide bridges can hold together the progeny chains formed due to the cleavage of peptide bonds. The latter would result in the formation of [M+nH+yH2O]n+ ions, where lysozyme underwent hydrolysis while the progeny chains were still connected by disulfide bonds. These “nicks” may hinder the ability of lysozyme to properly refold when the thermal stress was removed and thus could also account for the discovered irreversibility.
ESI mass spectra of incubated lysozyme showed the presence of a small amount of protein hydrolysis products starting from ∼4 h of incubation (data not shown). A fragment with molecular weight of 8644 Da was the major fragment in the early stage of the incubation. At longer incubation, 96 h in particular, other fragments also appeared (Fig. 1 B,C, the ion peaks derived from the fragments are in dashed lines, with underlined charge labels). The formation of protein fragments of ∼10 kDa and <6.5 kDa have been detected by using the nonreducing SDS-PAGE after prolonged incubation of hen egg white lysozyme at pH 2 and 57°C (Arnaudov and De Vries 2005). Nevertheless, Arnaudov and De Vries (2005) have concluded that lysozyme hydrolysis is not a prerequisite for fibril formation since no protein fragments were found in the case of prolonged incubation of lysozyme at pH 3 when fibrillar aggregates were also formed as detected by atomic force microscopy (AFM). At the same time, Frare et al. (2004) have recently reported that amyloid fibrils obtained after the incubation of hen egg white lysozyme at pH 2 and 65°C consist predominantly of fragments corresponding to residues 49–100, 49–101, 53–100, and 53–101. The fragments were formed due to the partial acid hydrolysis of Asp-X peptide bonds (Frare et al. 2004). The size of the fragments that we found in the soluble fraction of the incubated lysozyme was in good agreement with the findings of Frare et al. (2004). Hen egg white lysozyme is a globular protein consisting of 129 amino acid residues with a molecular weight of 14,305 Da. It contains four disulfide bonds: 6–127, 64–80, 76–94, and 30–115. The molecular weight of the fragment 49–101 is 5699 Da (Frare et al. 2004). Therefore, the 8644-Da fragment could be assigned to segments 1–48 and 102–129, which are bound by two disulfide bonds 6–127 and 30–115.
Pretreatment of ESI mass spectra
Two data sets of ESI mass spectra were acquired for the kinetics of lysozyme irreversible unfolding. The primary data set consisted of 21 ESI mass spectra corresponding to various incubation times (0, 5 min, 15 min, 30 min, 1 h, 2.0–20.0 h at 2-h intervals, 24 h, 30 h, 36 h, 48 h, 72 h, and 96 h). The selected incubation times covered all stages of lysozyme structural transformations from the compact conformation to the partially unfolded conformation according to the 30-h characteristic time of the unfolding (Xu et al. 2005). In order to study the early events of lysozyme unfolding, an additional 23 mass spectra (secondary data set) of lysozyme incubated for various durations (0, 5 min, 10 min, 15 min, 30 min, 45 min, 1 h, 1.5–4 h at 15-min intervals, 4.5 h, 5 h, 6 h, 12 h, and 24 h) were recorded. Both data sets were found to be in good agreement with each other. Since the first ESI-MS experiment covered a longer duration of the incubation, detailed data analysis was performed mainly on this data set.
The raw ESI mass spectra were deconvoluted using DataAnalysis software (version 5.2) supplied with the Agilent 1100 series LC/MSD-SL ion trap system. The ESI mass spectra of unfolded lysozyme revealed charged clusters of several evenly spaced peaks in the region of each expected charge state. (e.g., Fig. 1B, inset). The spacing of the peaks corresponded to ∼18 atomic weight units. Consequently, individual peaks in each cluster were assigned to the lysozyme bearing various numbers of water molecules (Rodriguez-Cruz et al. 1997) and to lysozyme with different degree of dehydration. Interestingly, the charged clusters were virtually absent in the ESI mass spectra of compact lysozyme but dominated the spectra of unfolded protein (Fig. 1A,C). This is reasonable because an unfolded protein is more likely to bind extra water molecules more tightly than a compact conformer would.
Two alternative approaches for calculating ESI-MS intensities of the charge states (from +8 to +17) were utilized: (1) The height of the most abundant peak in the cluster was used for representing the intensity of a particular charge state, and (2) all peaks in a cluster were integrated to find the intensity of the charge state (see Matlab code in Supporting Material). Obviously, the latter (hereinafter referred to as integrating approach) is more accurate unless charged clusters of lysozyme overlap with ion peaks originating from lysozyme fragments, which was the case in our study. The former approach (maximum peak approach) introduces systematic error by disregarding all minor peaks in each cluster, but at the same time, it is less affected by overlapping with extraneous peaks. All spectra were normalized to the maximum charge state intensities.
Chemometric analysis of ESI-MS data
Chemometric analysis of ESI-MS data has been shown to be a powerful tool for distinguishing conformers that evolve during protein structural transition (Mohimen et al. 2003; Navea et al. 2006). We utilized several chemometric approaches to analyze the ESI-MS data for characterizing the evolution of lysozyme structural composition during the early stages of fibrillation.
Abstract factor analysis
The data matrix comprising 21 ESI mass spectra of the incubated lysozyme (primary data set) was constructed for chemometric analysis. In addition, seven ESI mass spectra obtained for both compact and unfolded protein were averaged to obtain high-quality spectra of pure components. The ion peaks corresponding to the whole protein were used to construct the data matrix using the integrating approach described above, while the ion peaks derived from the fragments were ignored.
The result of abstract factor analysis (AFA) on the primary ESI-MS data set is shown in Table 1. The first two eigenvalues (EV) were appreciably larger than the EVs for other components. The EV for n = 3 is two orders of magnitude smaller than that for n = 2, whereas the EVs for n = 3, 4, 5 … are about of the same order. This indicated that the principal components starting from n = 3 were error factors (Wise et al. 2005).
Table 1.
Results of abstract factor analysis (AFA) for the primary ESI-MS data set

IND normally has a minimum where the number of components (n) corresponds to the number of significant factors present in the data set (Malinowski 2002). The IND showed a minimum at n = 2 (Table 1, underlined), which indicates the presence of two significant components. Reduced eigenvalues (REV) associated with error EVs should be statistically equal (Malinowski 2002). As evident from Table 1, REVs became significantly smaller and attained close values, starting from n = 3. Such behavior of REV additionally proved the presence of only two significant components in the data set. The significance level (%SL) of the F-test shows the probability for a particular EV to belong to an error factor (Malinowski 2002). As seen from Table 1, %SLs for F-test were ∼0.1% for the first two EVs and >10% for the rest ones, which was also indicative of two significant components. Autocorrelation coefficients (AUTOs) are normally close to one for smooth principal components and < 0.5 for noise factors (Malinowski 2002). In accordance with the proposed two-component model, only AUTOs for the two largest EVs turned out to be >0.5.
Cross-validation
The cross-validation method was utilized to double-check the two-component model suggested by AFA. Leave-one-out, Venetian blind, random subset, and contiguous block cross-validation methods were performed on both nonscaled and mean-centered data (Wise et al. 2005; Shashilov et al. 2006a). The curve of root mean square error of cross-validation (RMSECV) versus the number of principal component normally has a break or minimum against the true number of significant factors (Malinowski 2002; Wise et al. 2005). Factors that decrease RMSECV by <2% of the maximum RMSECV are usually rejected as error factors (Wise et al. 2005). Figure 2 shows the dependence of RMSECV versus the number of principal components for the nonscaled covariance matrix. The RMSECV curve had a break at n = 2, indicating that there were two principal components that contributed to the ESI mass spectra. Other methods of cross-validation on both nonscaled and mean-centered covariance matrices gave similar results (data not shown).
Figure 2.

Result of the contiguous-block cross-validation method performed on the nonscaled covariance matrix constructed from the CSD envelopes of 21 ESI mass spectra. RMSECV curve normally has a break or minimum against the true number of significant factors (Malinowski 2002; Wise et al. 2005). Factors which decrease RMSECV by <2% of the maximum RMSECV are usually rejected as error factors (Wise et al. 2005).
Target factor analysis and alternating least squares
Target factor analysis (TFA) (Malinowski 2002) was employed to obtain physically meaningful ESI-MS CSD envelopes and fractions of compact and partially unfolded protein in each lysozyme sample based on the abstract principal components obtained by AFA. The CSD envelopes of 5-min and 96-h incubated lysozyme in the primary data set were proven to be true factors using the target test algorithm described by Malinowski (2002). Alternating least squares (ALS) fitting (Wise et al. 2005) was performed in order to determine the contribution of compact and partially unfolded protein in each sample. The contributions of compact and partially unfolded species were constrained to non-negative values, and pure CSD envelopes were softly constrained (Shashilov et al. 2006a) to the CSD envelopes of 5-min and 96-h incubated lysozyme. Results of two-component fitting for the CSD envelopes of the soluble fraction of the incubated lysozyme are shown in Figure 1, D–F.
Estimating the relative sensitivity of ESI-MS to compact and partially unfolded protein
Higher sensitivity of ESI-MS toward unfolded protein was observed in our experiment. There are several factors, such as the averaged charge carried by the protein molecules (Pan and McLuckey 2003), and the settings of the instrument may influence the relative strength of ESI-MS signals from different conformers. It was essential to estimate the sensitivity ratio (α) in order to properly reconstruct the kinetics of lysozyme structural transition.
However, estimating the relative sensitivity of ESI-MS toward compact and unfolded protein was difficult because of some intrinsic limitations of the technique. As reviewed by Kaltashov and Eyles (2005), the relative conformer's ionic signal cannot be equated to its fractional concentration in solution. As a consequence, the spectral contributions of compact and unfolded protein obtained by the fitting of the data set with two basis spectra may not be appropriate in reconstructing the real kinetics of protein structural changes. Therefore, a calibration experiment is necessary to relate the spectral contributions of compact and unfolded proteins to their concentration fractions.
A priori two-component model
The set of samples with a priori two-component composition was prepared by mixing partially unfolded and compact lysozyme in different proportions for estimating the sensitivity of ESI-MS to the two conformers. This set of data was also used for evaluating the error of chemometric analysis on the ESI-MS data.
Given the ESI mass spectra of compact and partially unfolded lysozyme and the fractions of compact and unfolded lysozyme in each sample, all CSD envelopes of the a priori two-component model data set were fitted with the ESI mass spectra of compact and partially unfolded lysozyme using the simplex method (Press 2002). The simplex algorithm searched for the sensitivity ratio α that ensured both the best fitting of all spectra and the best agreement between the calculated and actual fractions of compact and unfolded protein used for sample preparation. Such approach allowed for extracting the relative sensitivity ratio α from the spectra constructed using the maximum peak approach (see The Pretreatment of ESI Mass Spectra). The treatment of ESI-MS data obtained by integrating over the charged clusters resulted in more accurate prediction of compact/unfolded proportions in each sample. However, using the experimental ESI mass spectra of unfolded lysozyme as a basis spectrum for the optimization procedure resulted in degraded fitting quality of ESI mass spectra for samples with larger fractions of compact conformations. This might be because the extraneous peaks of lysozyme fragments overlapping with the ionic peaks of the whole protein were not completely eliminated when integrating over the charged clusters of partially unfolded protein. As a result, the basis spectrum of partially unfolded lysozyme was determined with some uncertainty using the integration approach (Fig. 1F).
The real-coded genetic algorithm (Michalewicz 1996) was utilized to tackle this difficulty (see Matlab code in Supporting Material). During the genetic search, both sensitivity ratio (α) and the refined mass spectrum of partially unfolded lysozyme were determined. The program attempted to reach the best fit for all spectra in a two-component data set, providing that the fractions of compact and unfolded lysozyme found for each spectrum are close to actual proportions used for sample preparation. Using the refined ESI mass spectrum of partially unfolded lysozyme extracted by the genetic algorithm, the quality of the fitting was improved and thus allowed a more accurate estimation of the sensitivity ratio. The sensitivity ratio was estimated to be 0.52, i.e., ESI-MS was approximately two times more sensitive to the partially unfolded lysozyme than to the compact one in the primary data set for the instrumental settings/parameters used in the present work.
ESI-MS sensitivity estimated from kinetic profile
The kinetic profile of the compact protein resolved by the ALS analysis of the ESI-MS data set was used for estimating the relative sensitivity. The apparent fractions of the compact protein at each incubation time were calculated based on the fitting of the ESI mass spectra with two basis spectra, i.e., spectra of compact and partially unfolded lysozyme. The time dependence of the apparent fraction of the compact protein was then fitted with Equation 1:
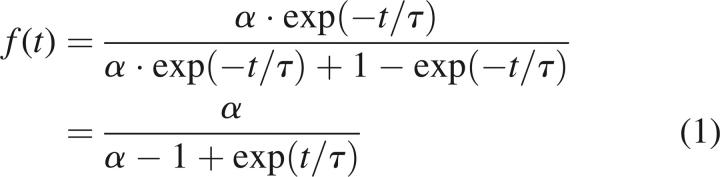 |
where f is the apparent fraction of compact conformation; t, time of incubation; τ, characteristic time (∼30 h); and α, sensitivity of ESI-MS to the compact conformation. Assuming that the characteristic time (τ) equals to 30 h, a value of α = 0.45 was obtained. This calculated relative sensitivity of ESI-MS for compact protein was consistent with the result obtained based on the analysis of the a priori two-component model (see above). Figure 3 shows the apparent fractions of the compact lysozyme calculated by chemometrics and the fitting curve based on Equation 1 for the primary data set.
Figure 3.

Estimation of the sensitivity of ESI-MS for the compact and partially unfolded lysozyme. Dots show the apparent fraction of the compact lysozyme conformation calculated from the primary ESI-MS data set using genetic algorithm. Solid curve represents the fitting based on Equation 1. Dashed curve shows the real fraction of compact lysozyme versus incubation time calculated based on the characteristic time of 30 h. Horizontal dotted line shows the sensitivity threshold for detecting compact lysozyme using ESI-MS, i.e., compact lysozyme will not be detected when the apparent fraction drops <0.077.
Genetic algorithm (Michalewicz 1996) was employed for a more accurate estimation of the relative sensitivity α. The algorithm searched for the refined spectrum of partially unfolded lysozyme, the sensitivity ratio (α), and the characteristic time (τ) of lysozyme unfolding. The results of the fitting for the primary data set are shown in Figure 4. The characteristic time of lysozyme structural rearrangement was calculated to be 29.6 h; the sensitivity ratio, 0.46. The spectrum of partially unfolded lysozyme retrieved from the ESI-MS data set of the incubated lysozyme was close to that obtained by the fitting of the a priori two component data set.
Figure 4.

Kinetics of lysozyme unfolding calculated from ESI-MS data using the genetic algorithm and taking into account different sensitivity of ESI-MS toward different lysozyme conformations. Circles represent the fraction of the unfolded conformer. Stars represent the fraction of compact conformer.
As evident from Figure 3, the unfolding kinetics of lysozyme obtained from ESI-MS data is different from the expected 30-h mono-exponential. The discrepancy was attributed to the different sensitivity of ESI-MS toward compact and unfolded proteins. One important issue, whether the desolvation of protein in the ESI-MS experiment could result in its conformation change and, as a consequence, in a different observed kinetics of unfolding, has been addressed in several studies and reviewed by Ruotolo and Robinson (2006). It has been suggested that many features of protein structure, including compact structure, elements of secondary structure, and hydrogen bonding interactions, are retained in the absence of solvent (Ruotolo and Robinson 2006). Although columbic forces of highly charged protein ions formed by the electrospray process have been shown to induce unfolding of protein secondary structure (Oomens et al. 2005), it is unlikely to affect our results since this charge-induced unfolding occurs only after the compact protein molecule gains a certain number of protons.
Estimating the sensitivity threshold
Since the distribution of protein molecules bearing a certain charge has a statistical nature, the CSD envelopes obtained for the same sample from different acquisitions may not be identical. Consequently, any difference between two ESI mass spectra that do not exceed the estimated intrinsic error may not be regarded as relevant. This provides the method for estimating the sensitivity threshold for a particular ESI-MS experiment.
Seven ESI mass spectra recorded for the same sample of partially unfolded lysozyme were averaged. The average spectrum was subtracted from each spectrum of partially unfolded lysozyme to produce difference spectra. The fraction of experimental error was calculated as following:
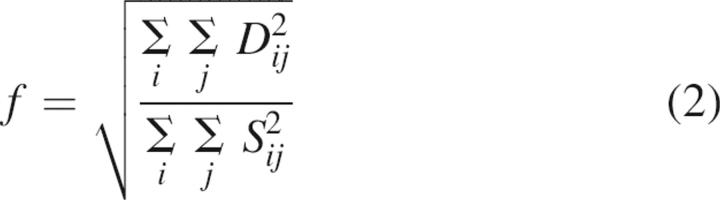 |
where Dij and Sij are experimental and calculated intensity of the ith charge state in the jth CSD envelope, respectively. The fraction of experimental error defined by Equation 2 does not depend on normalization of CSD envelopes.
The calculated fraction f was regarded as the threshold value. In other words, if the contribution of a species to the ESI mass spectrum becomes lower than the threshold value, then the species can no longer be confidently detected by the technique. The horizontal dashed line in Figure 3 shows the threshold sensitivity, which was estimated to be ∼0.077 for the primary data set. As evident from the figure, the fraction of the compact sample became lower that the threshold value for the samples incubated for >60 h.
As seen from Figures 3 and 4, the data points corresponding to 48 and 72 h of incubation have the largest deviation from the modeling curves. This can be explained by both the intrinsic uncertainty of CSD envelopes and the larger spectral contribution from lysozyme fragments that have not been accounted for or assigned to either compact or partially unfolded conformation. Both the 48- and 72-h data points were calculated based on single experimental spectrum. On the contrary, the last (96-h) data point in Figures 3 and 4 was from the averaged spectrum based on seven independent acquisitions. This resulted in the statistically more reliable ESI mass spectrum and more accurate fitting of 96-h data point to the modeled kinetics curve.
Estimating experimental error for the ESI-MS data set
One of the major challenges associated with the fitting of mass spectra is a relatively large experimental error of the method. Discrepancy in relative abundances in spectra obtained from different acquisitions for the very same sample can be observed despite the fact experimental conditions were kept the same, especially for the unfolded samples (data not shown). The standard deviation in the set of ESI mass spectra obtained for the same sample can be used for estimating the standard error of the experiment. The root-mean-square-errors (RMSEs) were calculated according to Equation 3:
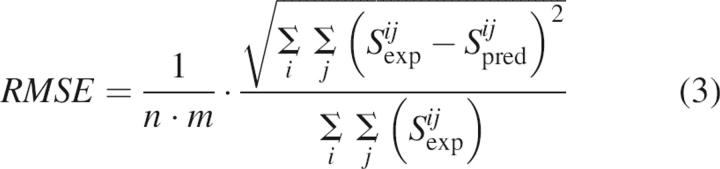 |
where Sijexp and Sijpred are experimental and calculated intensities of the ith charge state in the jth CSD envelope, respectively; n is the number of CSD envelopes; and m is the number of charge states in each envelope. The RMSE defined by Equation 3 does not depend on the normalization of CSD envelopes. The RMSEs were found to be 2.5 × 10⁻⁴ for the set of spectra from compact lysozyme, 1.2 × 10⁻⁴ for the set of spectra from partially unfolded lysozyme, and 5.8 × 10⁻³ for the fitting of the data matrix of mass spectra for incubated lysozyme. The calculated standard error of fitting was found to be of the same order as the experimental error.
The RMSE for the a priori two-component model (2.4 × 10⁻⁵) was similar to that of the incubated samples (2.9 × 10⁻⁵). If the residual error of the two-component fitting for the a priori two-component set can be accepted as experimental error (it should be since the spectra do represent the mixture of two species), the comparable error for the fitting of the data set from incubated samples should also be considered as experimental error. This conclusion verified additionally the validity of the two-state transition model. The RMSE of the fitting of the data set for the incubated samples is slightly larger than that for the a priori two-component data set (2.9 × 10⁻⁵ vs. 2.5 × 10⁻⁵). Additional error in the data set of the incubated samples might arise from lysozyme fragmentation (see above). In fact, lysozyme fragments that were not accounted for by the two-component model were present in both incubated and mixed samples. However, the fraction of fragments in the mixed samples was proportional to the fraction of partially unfolded protein since all samples were prepared using the same solution of partially unfolded protein. This means that the ESI mass spectra of partially unfolded lysozyme and its fragments were treated as a single principal component because of 100% correlation of the concentrations. This might not be the case for the incubated lysozyme since the fragmentation and the unfolding can occur at different rates, which introduces small additional error to the data set for the incubated lysozyme.
Analysis of the ESI-MS data on the early stage of lysozyme structural changes
All the steps of the quantitative analysis described above were repeated for the ESI-MS data set, reflecting the early stage of lysozyme unfolding (secondary data set). The data sets of 23 ESI mass spectra of the incubated lysozyme (within 24 h) and 23 ESI mass spectra of a priori mixtures of compact/unfolded lysozyme were analyzed using the chemometric approach. The results confirmed the proposed two-component model in the very early stage of the unfolding and suggested the mono-exponential kinetics for lysozyme structural changes with the characteristic time ∼30 h.
Factor analysis of charged clusters in ESI mass spectra of lysozyme
As evident from the ESI mass spectra (Fig. 1B,C), charged clusters are absent in the spectra of compact lysozyme but grow with incubation time. This observation suggests the correlation between the intensities of peaks in the charged clusters and the fraction of the unfolded protein in the sample. We performed AFA on the charged clusters corresponding to 8+, 9+, and 10+ charge states in both a priori two-component and incubated lysozyme data sets. The results revealed the presence of two significant components in both data sets (data not shown). However, the determination of the fractions of compact and unfolded protein in each sample by the fitting of the charged clusters was difficult since the shapes of the clusters are different even for the spectra recorded from the very same sample. We plan to elaborate a model that would best describe the cluster shapes and fit the clusters using the Bayesian statistical approach.
The results of ESI-MS experiments proved the two-state mechanism of lysozyme unfolding. Nevertheless, the quantitative characterization of the reaction kinetic based on ESI-MS data might not be accurate for several reasons. First, the fractions of compact and partially unfolded protein in the samples were determined by the indirect method using sensitivity ratio α that was also estimated with some uncertainty. Second, the characteristic time of lysozyme structural changes was evaluated by fitting the two-parameter function (Equation 1). Fitting of such types of functions is referred to as an ill-posed problem (Johnson 2000); i.e., small errors in experimental data can significantly affect the estimated parameters especially when they are correlated. To verify the obtained kinetic law of thermally induced lysozyme unfolding, we utilized the intrinsic tryptophan fluorescence and deep UV Raman spectroscopy.
Intrinsic tryptophan fluorescence spectra of incubated lysozyme: Chemometric analysis
Ten fluorescence spectra for nonincubated lysozyme and the soluble fraction of lysozyme samples incubated at 65°C for 5 min, 1 h, 4 h, 8 h, 16 h, 24 h, 2 d, 4 d, and 8 d were measured and used for chemometric analysis. Figure 5A shows selected fluorescence spectra of lysozyme (soluble fractions) incubated for various times. The spectra are dominated by the tryptophan fluorescence. Hen egg white lysozyme has six tryptophan residues: Trp 28, 62, 63, 108, 111, and 123. A bathochromic shift of the tryptophan fluorescence peak caused by the incubation can be assigned to the exposure of tryptophan side-chain(s) to a more hydrophilic environment due to the unfolding of lysozyme (Demchenko 1986; Chi and Asher 1998).
Figure 5.

(A) Tryptophan fluorescence spectra of lysozyme: Nonincubated (solid line), soluble fractions of 24-h incubated (dotted line), 8-d incubated (dashed line). Spectra were normalized to unity height. The fittings as well as fitting residues of the fluorescence spectra of nonincubated lysozyme (B), soluble fractions of 24-h incubated (C), and 8-d incubated lysozyme (D) using basis spectra calculated by alternating least squares (ALS) analysis are also shown (solid line indicates experimental spectra; dotted line, fitted spectra.). All spectra were measured at room temperature, which indicates the irreversibility of the changes observed.
To perform chemometric analysis, a data matrix was constructed using 10 fluorescence spectra obtained for lysozyme samples incubated for various times. Covariance about the origin was used to scale the data prior to the AFA. The results of AFA are shown in Table 2.
Table 2.
Results of AFA for the fluorescence spectroscopic data set

The first two EVs were appreciably larger than the EVs for the other components. The EV for the third component (n = 3) was three orders of magnitude smaller than that for n = 2. Consequently, the principal components starting from n = 3 were assigned to error factors (Wise et al. 2005). EVs for n = 4–6 were approximately the same and should also account for experimental errors. IND function showed a minimum at n = 2, and REV became significantly smaller starting from n = 3. Such behavior of IND and REV additionally proved the presence of only two significant components in the data set. Further, %SL for F-test (Malinowski 2002) was close to zero for the two highest eigenvectors and >20% for the rest, which also indicated the presence of two significant components.
Figure 6 shows the dependence of RMSECV versus the number of principal components for the mean-centered covariance matrix (Wise et al. 2005). The RMSECV curve shows a break against two significant factors. Leave-one-out, Venetian blind, and random subset cross-validation algorithms all showed very similar dependence of RMSECV on the number of factors (data not shown). The application of the cross-validation methods for the fluorescence spectroscopic data set indicated the presence of only two significant components, which is consistent with the result of AFA analysis.
Figure 6.

Result for the contiguous-block, cross-validation method performed on the covariance matrix constructed of 10 fluorescence spectra. RMSECV curve normally has a break or minimum against the true number of significant factors (Malinowski 2002; Wise et al. 2005). Factors which decrease RMSECV by <2% of the maximum RMSECV are usually rejected as error factors (Wise et al. 2005).
EFA also suggested the presence of two sources of variance in the fluorescence spectroscopic data set (Fig. 7, dotted and dashed curves projected above the backgrounds). The components can be associated with compact (dotted curve) and partially unfolded (dashed curve) lysozyme. The forward analysis (Fig. 7A) showed that the contribution of partially unfolded lysozyme started to appear from the sample incubated for 1 h. The reverse analysis (Fig. 7B) showed that the contribution of compact lysozyme disappeared at 4-d incubation. The results of the evolving factor analysis (EFA) are in line with the observed kinetics of the lysozyme unfolding (Xu et al. 2005).
Figure 7.

Results of the evolving forward (A) and reverse (B) factor analysis: Singular values versus the order number of fluorescence spectrum. Each curve on the graph shows the relative contribution (eigenvalue) of each factor in the subsets of first two, first three, etc., samples for forward (A) factor analysis and the eigenvalues for last two, last three, etc., samples for reverse (B) factor analysis. Dotted curves represent the eigenvalues for the folded conformer; dashed curves represent the eigenvalues for the unfolded conformer. The other curves (solid lines) on the background level signify error factors.
Two principal components, the fluorescence spectra of folded (compact) and partially unfolded lysozyme, were calculated using ALS analysis. Fluorescence spectrum of nonincubated lysozyme was considered as a spectrum of the folded protein, while the spectrum of 8-d incubated lysozyme was set as an initial approximation for the basis spectrum of partially unfolded protein. The principal components were close to the spectra of nonincubated and 8-d incubated samples. Figure 5, B–D, shows the experimental and calculated fluorescence spectra together with fitting residues.
The fluorescence spectra in Figure 5A were normalized in order to show the bathochromic shift as lysozyme unfolded during the incubation. The normalization does not affect the result of factor analysis since the relative magnitude of the EVs remains the same as long as the fluorescence spectra of the two principal components are of comparable intensity (within the same order of magnitude).
DUVRR spectra of lsozyme: Changes with the incubation time and chemometric analysis
Ten 197-nm excited DUVRR spectra of the soluble fraction of lysozyme samples incubated for various times (nonincubated, 15 min, 45 min, 2 h, 6 h, 12 h, 24 h, 2 d, 4 d, and 8 d) were used for chemometric analysis. The Raman spectra (data not shown) of the gelatinous part of the samples separated by centrifugation were dominated by the DUVRR signature of β-sheet (Xu et al. 2005). Figure 8A shows selected DUVRR spectra of the soluble fraction of lysozyme samples. The major spectroscopic changes were evident for the Cα-H bending mode and the 1000-cm−1 phenylalanine band (ν12 ring breathing vibrational mode [Matsuda et al. 2003], in which alternating carbon atoms move toward and away from the center of the benzene ring) (Ziegler and Albrecht 1979; Asher et al. 1986; Fodor et al. 1989). The increase in the intensity of Cα-H band indicated the melting of α-helix and the formation of an unordered structure. A dramatic decrease in the intensity of 1000-cm−1 phenylalanine band indicated the exposure of phenylalanine side-chains to water in the partially unfolded lysozyme (Xu et al. 2005).
Figure 8.

DUVRR spectra of compact lysozyme (nonincubated, blue), soluble fractions of 24-h incubated (green) and 8-d incubated (red) lysozyme (A). Spectra were normalized by using internal standard sodium trifluoroacetate. The fittings of the DUVRR spectra of nonincubated lysozyme (B), soluble fractions of 24-h incubated (C), and 8-d incubated lysozyme (D) using basis spectra calculated from alternating least squares analysis are shown (blue indicates experimental spectra; green, fitted spectra; red, residue spectra). All spectra were measured at room temperature. Amide I band (AM I) consists of carbonyl C=O stretching, with a small contribution from C−N stretching and N-H bending; Amide II (AM II) and Amide III (AM III) bands involve significant C−N stretching, N–H bending, and C−C stretching; The Ca−H bending vibrational mode involves Ca−H symmetric bending and C−Ca stretching (Chi et al. 1998). Phe indicates phenylalanine; Tyr, tyrosine.
Ten DUVRR spectra of the soluble fraction of incubated lysozyme were used to construct a covariance matrix for chemometric analysis. Initially, AFA was applied to the nonscaled DUVRR spectroscopic data set to find the number of principal components (Table 3).
Table 3.
Results of AFA for the nonscaled DUVRR spectroscopic data

EVs calculated for the Raman spectroscopic data set were dominated by the first two largest EVs. The next four EVs of close value should be assigned to either significant or error eigenvectors altogether. The minimum of IND function at n = 2 shows the presence of two significant factors. The reduced EVs are significantly smaller starting from n = 3. The AUTOs were close to unity for n = 1 and n = 2 but then abruptly decreased for the rest of the eigenvectors. The %SL for F-test was <10% for the first two eigenvectors, which additionally confirmed the two-component model. Cross-validation tests for the mean-centered covariance matrix from the DUVRR data set showed that eigenvectors corresponding to factor number larger than two did not improve RMSECV appreciably (data not shown).
EFA suggested that the contribution of partially unfolded lysozyme appeared in DUVRR spectra as early as 2 h after incubation, while the spectral contribution from the compact lysozyme disappears after 4-d incubation (Fig. 9). There was only one significant component remaining after 8-d incubation. It was therefore reasonable to assign this component to the spectral contribution of the partially unfolded lysozyme.
Figure 9.

Results of evolving forward (A) and reverse (B) factor analysis of DUVRR spectra. Each curve shows the relative contribution (eigenvalue) of each factor in the subsets of first two, first three, etc., samples for forward (A) factor analysis and the eigenvalues for last two, last three, etc., samples for reverse (B) factor analysis. Dotted curves represent the eigenvalues for the folded conformer; dashed curves represent the eigenvalues for the unfolded conformer. The other curves (solid lines) on the background level signify error factors.
“Pure” DUVRR spectra for the folded and unfolded lysozyme (principal components of the DUVRR spectroscopic data set) were calculated by ALS analysis assuming the presence of two significant factors. The principal components were then used to fit the experimental spectra. Experimental spectra were readily presented as a linear combination of two principal component spectra corresponding to the compact and partially unfolded lysozyme (Fig. 8B,D). It was noteworthy that calculated principal components were remarkably less noisy in comparison with the raw experimental spectra (Fig. 8B,D, green spectra) because the error eigenvectors were separated and eliminated from the real eigenvectors.
The evolution of the contribution from spectra of compact and partially unfolded lysozyme to both fluorescence and DUVRR spectra allowed for establishing the kinetics of protein unfolding based on these two data sets. The fraction of the compact conformer decreased mono-exponentially with the incubation time with the characteristic time of 30.7 ± 3.3 h for fluorescence spectroscopic data and 32.1 ± 2.9 h for DUVRR spectroscopic data, respectively. These characteristic times are in agreement with our previous estimation (Xu et al. 2005).
Strictly speaking, monitoring “pure” secondary structure changes and extracting the characteristic time of secondary structure evolution would require the elimination of aromatic bands from DUVRR spectra (see Fig. 8) since they normally report on the tertiary structure changes. The ability to fit both aromatic and amide regions of DUVRR spectra with two pure component spectra further confirmed a 100% correlation in secondary and tertiary structural changes.
It is important to note here that a small amount of a newly formed β-sheet has been observed in the soluble fraction of the incubated samples of lysozyme (Xu et al. 2005). Chemometric analysis of the Raman spectral data reported here did not identify a β-sheet-reach spectrum as a separate principal component. Instead, the β-sheet contribution was incorporated into the spectrum of the partially unfolded lysozyme. This means that the formations of β-sheet and unordered structures might be correlated. The development of statistical methods of analysis, which would allow for distinguishing species with a partially correlated behavior, is currently underway in our laboratory (Shashilov et al. 2006b).
Two-state transition
Two-state transition means that any other protein conformations, except the initial and final, exhibit a very short lifetime and do not contribute significantly to the composition of the system at any time. The proposed two-state reaction mechanism would be rejected if at least one set of spectra, DUVRR, fluorescence, or mass spectra obtained at various incubation times could not be represented as a linear combination of two basis spectra correspond to the initial and final species. In terms of chemometric analysis, the evidence of a third principal component would be inconsistent with the two-state mechanism. However, a good two-component fitting of the fluorescence or Raman spectra is not sufficient to ultimately prove the two-state mechanism. In fact, a mixture of the compact and partially unfolded protein molecules may result in the same Raman and fluorescence spectra as an ensemble of protein molecules that are unfolded in different degree in between the two terminal conformational states (the compact and partially unfolded conformations). Protein/polypeptide DUVRR spectra can be approximated as a linear combination of the “pure secondary structure spectra” (Chi et al. 1998). For example, DUVRR spectra of 21-amino-acid residue, mainly alanine peptide (AP) measured at various temperatures have been fit well with a liner combination of α-helix spectrum and a temperature-dependent random coil spectrum (Lednev et al. 1999). However, the DUVRR spectroscopic study of α-helix melting of the isotope labeled analog of AP revealed a gradual melting mechanism (Ianoul et al. 2002).
Unlike Raman and fluorescence spectroscopy, ESI-MS can definitively distinguish intermediate states with a different degree of unfolding from the mixture of compact and the partially unfolded conformation. This is because every intermediate state should result in a specific CSD envelope, which cannot be fitted with a sum of CSD envelopes obtained for two terminal conformations, i.e., the compact and the partially unfolded conformation (Dobo and Kaltashov 2001; Kaltashov and Eyles 2005). In other words, the CSD envelope of a partially folded protein cannot be fitted with a linear combination of CSD envelopes of completely folded and unfolded proteins. Therefore, if chemometric analysis of MS spectra reveals two principal components only, it should be a sufficient evidence for the two-state transition mechanism, although the difference in sensitivity for different conformations should be taken into account if the kinetics parameters were derived from ESI-MS data.
Compared with the timescale of the overall fibrillation process, the partially unfolded conformation forms rather quickly once the molecule overcomes a barrier associated with a certain bottleneck transformation (transition state). The contribution of the lysozyme molecules in the transition conformation(s), if any, is negligible. Therefore, the possibility of characterizing the transition state directly using the spectroscopic techniques utilized here is limited. Other methods, such as Φ-value approach (Fersht and Sato 2004; Raleigh and Plaxco 2005) could be used to probe the transition state, while multidimensional NMR could be used for the structural characterization of the partially unfolded lysozyme.
Conclusions
It has been postulated that a misfolded/partially unfolded intermediate is a prerequisite for the formation of fibrils (Bellotti et al. 2000; Goers et al. 2002; Cao et al. 2004; Uversky and Fink 2004; Surewicz et al. 2006). Irreversible partial unfolding of hen egg white lysozyme has been recently reported (Xu et al. 2005) to occur at the early stages of fibrillation at elevated temperature and low pH. This irreversible process differs significantly from a reversible thermal unfolding of lysozyme, resulting in relatively small changes at 65°C and pH 2. Earlier experiments (Xu et al. 2005) allowed us to hypothesize that this irreversible unfolding is a two-state transition. This hypothesis was tested here by a combination of three spectroscopic/spectrometric techniques: intrinsic tryptophan fluorescence, DUVRR spectroscopy, and ESI-MS, along with comprehensive chemometric analysis on the experimental data. Principal component analysis (PCA) on all data sets unanimously suggested the existence of only two principal components during the irreversible unfolding. ALS allowed determining the spectra of compact and partially unfolded lysozyme for each of the three spectroscopic/spectrometric methods. The relative contributions of compact and partially unfolded protein in each sample were also evaluated by ALS and genetic fitting. The evolution profiles for both conformers were determined by plotting the contributions versus the incubation times. The characteristic time of the irreversible unfolding was estimated to be ∼30 h, which is in good agreement with our previous report (Xu et al. 2005).
Two significant components dominating fluorescence and DUVRR spectra cannot be considered as sufficient evidence proving the proposed two-state transition, while two factors in the ESI-MS data set can give the definitive proof for the presence of only two conformers. However, because of the oblique relation between the charge state intensities and concentration fractions of protein conformers, caution should be taken when interpreting the kinetics parameters extracted from ESI-MS data. Other spectroscopic techniques, such as DUVRR and fluorescence spectroscopy, were shown to be able to extract kinetics parameters more accurately.
The unfolding process discussed herein is a relatively slow process (characteristic time of ∼30 h). All the spectroscopic measurements were carried out at room temperature. Therefore, the two-state model does not rule out the existence of short-lived structural intermediates formed in-between the compact and final partially unfolded conformations. The approach utilized here, i.e., the combination of several spectroscopic/spectrometric techniques with chemometric analysis, could also be used in protein folding studies to determine the number of folding intermediates.
Materials and Methods
Sample preparation
Hen egg white lysozyme and sodium trifluoroacetate were purchased from Sigma and used as received. The preparation of lysozyme fibrils was described elsewhere (Xu et al. 2005). Briefly, ∼14 mg/mL of lysozyme solution with pH 2.0 was prepared and incubated at 65°C for various durations (Krebs et al. 2000; Xu et al. 2005). The incubated solutions were centrifuged at 16,000 g for 30 min to separate the soluble fraction from the gelatinous fraction that is dominated by fibrils. The soluble fraction was directly used for Raman spectroscopic measurements and, with proper dilution, used for the tryptophan fluorescence spectroscopic (∼0.01 mg/mL) and ESI-MS (1 mg/mL) measurements. All spectroscopic/spectrometric measurements were conducted at room temperature. Protein concentrations were determined by diluting the samples into 6 M guanidine solution and measuring the UV absorbance at 280 nm. A280nm(1 mg/mL) = 2.37 was used for calculating the concentration of lysozyme (Cao et al. 2004).
Fluorescence and absorption spectroscopy
Tryptophan fluorescence spectra were measured using a PerkinElmer LS 55 Luminescence Spectrometer. The excitation wavelength was 280 nm. Slits for both excitation and emission were 5.0 nm. UV absorption spectra were measured on a Hewlett-Packard 8452A diode array spectrophotometer. The standard error of the fluorescence spectra was calculated based on the average noise amplitude on the background level.
DUVRR spectroscopy
A home-built DUVRR spectroscopic apparatus was described in detail elsewhere (Lednev et al. 2005). The 197-nm fourth-harmonic generation of Indigo S laser system (Coherent, Inc.) was used for excitation. Raman scattering was dispersed and recorded using a homebuilt double monochromator coupled with a liquid-nitrogen-cooled CCD camera (Roper Scientific, Inc.). A rotating Suprasil NMR tube with a magnetic stirrer inside was used as a sample holder. The acquired Raman spectra were analyzed using GRAMS/AI software (Thermo Electron Corp.). Spectral contribution of water and quartz were numerically subtracted. Sodium trifluoroacetate was used as the internal standard for intensity normalization.
Electrospray ionization mass spectrometry
ESI mass spectra were obtained on an Agilent 1100 series LC/MSD-SL ion trap system. Samples were introduced into the ion source using the autosampler (solvent flow rate, 200 μL/min). The mobile phase consisted of 0.2% formic acid water solution. The data were collected in positively charged ion mode in a mass range from m/z 800 to m/z 2100. The ion trap parameters were optimized for detection of ions with m/z 1100. This provided the best separation of the charge envelopes corresponding to the folded and unfolded lysozyme. The ESI conditions were as follows: Drying gas temperature, 350°C; nebulizer gas pressure, 25 psi; and drying gas flow, 10 L/min. Instrument control, data acquisition, and data processing were performed using Agilent ChemStation 10.02 and IonTrap 5.2 software. All experimental parameters were kept constant to minimize the inconsistency in ion desorption and transmission conditions. The soluble fraction of 5-min and 96-h incubated lysozyme were diluted to the same concentration (1 mg/mL) and then mixed in different ratios to serve as an a priori two-component model.
Chemometric analysis
Data matrices consisting of at least 21 ESI mass spectra were constructed for chemometric analysis. In addition, ESI mass spectra of the mixtures prepared from compact and partially unfolded lysozyme, with various concentration ratios that correspond to the calculated concentration ratios between compact and partially unfolded lysozyme in the incubated samples, were used to construct a data matrix as an a priori two-component model. Fluorescence and DUVRR spectra of the soluble fraction from the incubated lysozyme (up to 8 d) were used to construct the covariance matrices for chemometric analysis.
PLS_ToolBox 4.0 for Matlab (Eigenvector Research, Inc.) and home-made Matlab programs were used for chemometric analysis. PCA (Svensson et al. 1999; Shenton et al. 2000; Malinowski 2002) was used to determine the number of principal components in each set of spectra. AFA for all data matrices was performed using algorithms described by Malinowski (2002) and Wise et al. (2005). Singular value decomposition was employed to determine the EVs and eigenvectors of the covariance matrices. Various scaling methods such as covariance about the origin, covariance about the mean, and auto-scaling were attempted. EVs, EV ratios, logarithmic EVs, cumulative variances. and variances captured by individual components were used to deduce the number of principal components contributing to each data set. EVs corresponding to significant factors should be considerably larger than EVs that account for errors (Malinowski 2002). Furthermore, EVs with close magnitudes are recommended to be either included or rejected from the model altogether (Wise et al. 2005). Irregularities in the curves of EV ratios and logarithmic EVs plotted against the principal component number served as criteria to distinguish the principal components from error factors.
IND, REVs, %SL, and AUTOs were further utilized as additional criteria for determining the number of principal components. Minimum of IND function usually corresponds to the number of significance factors in a data set. REVs for the significant factors should be greater than that for the error factors. %SLs corresponding to F-test values of <10% are indicative of real factors.
Cross-validation is a common method for estimating the number of factors when the estimation of experimental error is not straightforward (Malinowski 2002; Naveaa et al. 2005). Leave-one-out method (Rencher 1998; Naveaa et al. 2005) is routinely used in the case of limited number of spectra. Contiguous block and random subset techniques are known to work well in treating spectroscopic data. (Wise et al. 2005) The number of factors that corresponds to the minimum of RMSECV are usually equal to the number of true factors. In addition, the factors that improve RMSECV by <2% are usually assigned to the errors.
TFA was used to transfer the abstract loadings and scores obtained using AFA to the physically meaningful spectra and concentrations. The spectra of nonincubated and 8-d incubated lysozyme were tested as possible true factors. EFA allows verifying the number of significant components in the data sets and estimating the ranges of existence for each component.
ALS analysis was applied to reconstruct the experimental spectra with extracted pure component spectra and the corresponding concentration profiles. The original data were fitted with the linear combination of the principal components identified by TFA. Genetic algorithm was employed to refine the ESI mass spectra of partially unfolded lysozyme and calculate the relative sensitivity ratio and characteristic time for lysozyme structural rearrangements during the fibril formation.
Electronic supplemental material
The Matlab code for calculating ESI-MS charge state intensities by integrating over the charged clusters and Matlab code of the floating point genetic algorithm are included in Supplemental Material.
Acknowledgment
We thank Dr. Igor Kaltashov for creative discussions and valuable advice.
Footnotes
Reprint requests to: Igor K. Lednev, Department of Chemistry, University at Albany, SUNY, 1400 Washington Ave., Albany, NY 12222, USA. e-mail: lednev@albany.edu; fax: (518) 442-3462.
Abbreviations: DUVRR, deep UV resonance Raman; ESI-MS, electrospray ionization mass spectrometry; CSD, charge state distribution; m/z, mass-to-charge; AFA, abstract factor analysis; EV, eigenvalue; RE, real error; IND, Malinowski factor indicator function; REV, reduced eigenvalue; ALS, alternating least squares; TFA, target factor analysis; EFA, evolving factor analysis; AUTO, autocorrelation coefficient; %SL, significance level for F-test; RMSECV, root mean square error of cross-validation; RMSE, root-mean-square error.
Article published online ahead of print. Article and publication date are at http://www.proteinscience.org/cgi/doi/10.1110/ps.062639307.
References
- Adams S., Higgins, A.M., and Jones, R.A.L. 2002. Surface-mediated folding and misfolding of proteins at lipid/water interfaces. Langmuir 18: 4854–4861. [Google Scholar]
- Anfinsen C.B. 1973. Principles that govern the folding of protein chains. Science 181: 223–230. [DOI] [PubMed] [Google Scholar]
- Arnaudov L.N. and De Vries, R. 2005. Thermally induced fibrillar aggregation of hen egg white lysozyme. Biophys. J. 88: 515–526. [DOI] [PMC free article] [PubMed] [Google Scholar]
- Asher S.A. 2001. Ultraviolet raman spectrometry. In Handbook of vibrational spectroscopy, pp. 557–571. John Wiley & Sons, New York.
- Asher S.A., Ludwig, M., and Johnson, C.R. 1986. UV resonance Raman excitation profiles of the aromatic amino acids. J. Am. Chem. Soc. 108: 3186–3197. [Google Scholar]
- Ban T., Yamaguchi, K., and Goto, Y. 2006. Direct observation of amyloid fibril growth, propagation, and adaptation. Acc. Chem. Res. 39: 663–670. [DOI] [PubMed] [Google Scholar]
- Bellotti V., Mangione, P., and Merlini, G. 2000. Review: Immunoglobulin light chain amyloidosis—the archetype of structural and pathogenic variability. J. Struct. Biol. 130: 280–289. [DOI] [PubMed] [Google Scholar]
- Blanch E.W., Morozova-Roche, L.A., Cochran, D.A.E., Doig, A.J., Hecht, L., and Barron, L.D. 2000. Is Polyproline II helix the killer conformation? A Raman optical activity study of the amyloidogenic prefibrillar intermediate of human lysozyme. J. Mol. Biol. 301: 553–563. [DOI] [PubMed] [Google Scholar]
- Bossy-Wetzel E., Schwarzenbacher, R., and Lipton, S.A. 2004. Molecular pathways to neurodegeneration. Nat. Med. Suppl, S2–S9. [DOI] [PubMed]
- Bucciantini M., Calloni, G., Chiti, F., Formigli, L., Nosi, D., Dobson, C.M., and Stefani, M. 2004. Prefibrillar amyloid protein aggregates share common features of cytotoxicity. J. Biol. Chem. 279: 31374–31382. [DOI] [PubMed] [Google Scholar]
- Caddy G.L. and Robinson, C.V. 2006. Insights into amyloid fibril formation from mass spectrometry. Protein Pept. Lett. 13: 255–260. [DOI] [PubMed] [Google Scholar]
- Canet D., Sunde, M., Last, A.M., Miranker, A., Spencer, A., Robinson, C.V., and Dobson, C.M. 1999. Mechanistic studies of the folding of human lysozyme and the origin of amyloidogenic behavior in its disease-related variants. Biochemistry 38: 6419–6427. [DOI] [PubMed] [Google Scholar]
- Canet D., Last, A.M., Tito, P., Sunde, M., Spencer, A., Archer, D.B., Redfield, C., Robinson, C.V., and Dobson, C.M. 2002. Local cooperativity in the unfolding of an amyloidogenic variant of human lysozyme. Nat. Struct. Biol. 9: 308–315. [DOI] [PubMed] [Google Scholar]
- Cao A., Hu, D., and Lai, L. 2004. Formation of amyloid fibrils from fully reduced hen egg white lysozyme. Protein Sci. 13: 319–324. [DOI] [PMC free article] [PubMed] [Google Scholar]
- Chamberlain A.K., Receveur, V., Spencer, A., Redfield, C., and Dobson, C.M. 2001. Characterization of the structure and dynamics of amyloidogenic variants of human lysozyme by NMR spectroscopy. Protein Sci. 10: 2525–2530. [DOI] [PMC free article] [PubMed] [Google Scholar]
- Chi Z. and Asher, S.A. 1998. UV Raman determination of the environment and solvent exposure of Tyr and Trp residues. J. Phys. Chem. B 102: 9595–9602. [Google Scholar]
- Chi Z., Chen, X.G., Holtz, J.S., and Asher, S.A. 1998. UV resonance Raman-selective amide vibrational enhancement: Quantitative methodology for determining protein secondary structure. Biochemistry 37: 2854–2864. [DOI] [PubMed] [Google Scholar]
- Chowdhury S.K., Katta, V., and Chait, B.T. 1990. Probing conformational changes in proteins by mass spectrometry. J. Am. Chem. Soc. 112: 9012–9013. [Google Scholar]
- Craig T.A., Benson, L.M., Bergen, H.R., Venyaminov, S.Y., Salisbury, J.L., Ryan, Z.C., Thompson, J.R., Sperry, J., Gross, M.L., and Kumar, R. 2006. Metal-binding properties of human centrin-2 determined by micro-electrospray ionization mass spectrometry and UV spectroscopy. J. Am. Soc. Mass Spectrom. 17: 1158–1171. [DOI] [PubMed] [Google Scholar]
- Daggett V. 2006. α-Sheet: The toxic conformer in amyloid diseases? Acc. Chem. Res. 39: 594–602. [DOI] [PubMed] [Google Scholar]
- Dantas G., Kuhlman, B., Callender, D., Wong, M., and Baker, D. 2003. A large scale test of computational protein design: Folding and stability of nine completely redesigned globular proteins. J. Mol. Biol. 332: 449–460. [DOI] [PubMed] [Google Scholar]
- Demchenko A.P. 1986. Ultraviolet spectroscopy of proteins. Springer-Verlag, Berlin.
- Dobo A. and Kaltashov, I.A. 2001. Detection of multiple protein conformational ensembles in solution via deconvolution of charge-state distributions in ESI MS. Anal. Chem. 73: 4763–4773. [DOI] [PubMed] [Google Scholar]
- Dobson C.M. 2003. Protein folding and misfolding. Nature 426: 884–890. [DOI] [PubMed] [Google Scholar]
- Dumoulin M., Canet, D., Last, A.M., Pardon, E., Archer, D.B., Muyldermans, S., Wyns, L., Matagne, A., Robinson, C.V., Redfield, C., et al. 2005. Reduced global cooperativity is a common feature underlying the amyloidogenicity of pathogenic lysozyme mutations. J. Mol. Biol. 346: 773–788. [DOI] [PubMed] [Google Scholar]
- Eisenberg D., Nelson, R., Sawaya, M.R., Balbirnie, M., Sambashivan, S., Ivanova, M.I., Madsen, A.O., and Riekel, C. 2006. The structural biology of protein aggregation diseases: Fundamental questions and some answers. Acc. Chem. Res. 39: 568–575. [DOI] [PMC free article] [PubMed] [Google Scholar]
- Fersht A.R. and Sato, S. 2004. Φ-Value analysis and the nature of protein-folding transition states. Proc. Natl. Acad. Sci. 101: 7976–7981. [DOI] [PMC free article] [PubMed] [Google Scholar]
- Fodor S.P.A., Copeland, R.A., Grygon, C.A., and Spiro, T.G. 1989. Deep-ultraviolet Raman excitation profiles and vibronic scattering mechanisms of phenylalanine, tyrosine, and tryptophan. J. Am. Chem. Soc. 111: 5509–5518. [Google Scholar]
- Frare E., Polverino de Laureto, P., Zurdo, J., Dobson, C.M., and Fontana, A. 2004. A highly amyloidogenic region of hen lysozyme. J. Mol. Biol. 340: 1153–1165. [DOI] [PubMed] [Google Scholar]
- Furdui C.M., Lew, E.D., Schlessinger, J., and Anderson, K.S. 2006. Autophosphorylation of FGFR1 kinase is mediated by a sequential and precisely ordered reaction. Mol. Cell 21: 711–717. [DOI] [PubMed] [Google Scholar]
- Glenner G.G., Linke, R.P., and Pollock, P.S. 1976. Systemic amyloidosis and immunoglobulins. Amyloidosis, Proc. Sigrid Juselius Found. Symp. 5th: 233–246. [Google Scholar]
- Goda S., Takano, K., Yamagata, Y., Nagata, R., Akutsu, H., Maki, S., Namba, K., and Yutani, K. 2000. Amyloid protofilament formation of hen egg lysozyme in highly concentrated ethanol solution. Protein Sci. 9: 369–375. [DOI] [PMC free article] [PubMed] [Google Scholar]
- Goers J., Permyakov, S.E., Permyakov, E.A., Uversky, V.N., and Fink, A.L. 2002. Conformational prerequisites for α-lactalbumin fibrillation. Biochemistry 41: 12546–12551. [DOI] [PubMed] [Google Scholar]
- Grandori R. 2002. Detecting equilibrium cytochrome c folding intermediates by electrospray ionisation mass spectrometry: Two partially folded forms populate the molten-globule state. Protein Sci. 11: 453–458. [DOI] [PMC free article] [PubMed] [Google Scholar]
- Gu Z., Zhu, X., Ni, S., Su, Z., and Zhou, H.-M. 2004. Conformational changes of lysozyme refolding intermediates and implications for aggregation and renaturation. Int. J. Biochem. Cell Biol. 36: 795–805. [DOI] [PubMed] [Google Scholar]
- Haq S.K., Rasheedi, S., Sharma, P., Ahmad, B., and Khan, R.H. 2005. Influence of salts and alcohols on the conformation of partially folded intermediate of stem bromelain at low pH. Int. J. Biochem. Cell Biol. 37: 361–374. [DOI] [PubMed] [Google Scholar]
- Hardy J. and Selkoe, D.J. 2002. The amyloid hypothesis of Alzheimer's disease: Progress and problems on the road to therapeutics. Science 297: 353–356. [DOI] [PubMed] [Google Scholar]
- Hearn M.T.W., Quirino, J.P., Whisstock, J., and Terabe, S. 2002. Thermal unfolding of proteins studied by coupled reversed-phase HPLC-electrospray ionization mass spectrometry techniques based on isotope exchange effects. Anal. Chem. 74: 1467–1475. [DOI] [PubMed] [Google Scholar]
- Hirai M., Arai, S., and Iwase, H. 1999. Complementary analysis of thermal transition multiplicity of hen egg-white lysozyme at low pH using X-ray scattering and scanning calorimetry. J. Phys. Chem. B 103: 549–556. [Google Scholar]
- Hoaglund-Hyzer C.S., Counterman, A.E., and Clemmer, D.E. 1999. Anhydrous protein ions. Chem. Rev. 99: 3037–3079. [DOI] [PubMed] [Google Scholar]
- Hooke S.D., Eyles, S.J., Miranker, A., Radford, S.E., Robinson, C.V., and Dobson, C.M. 1995. Cooperative elements in protein folding monitored by electrospray ionization mass spectrometry. J. Am. Chem. Soc. 117: 7548–7549. [Google Scholar]
- Hoshino M., Hagihara, Y., Hamada, D., Kataoka, M., and Goto, Y. 1997. Trifluoroethanol-induced conformational transition of hen egg white lysozyme studied by small-angle X-ray scattering. FEBS Lett. 416: 72–76. [DOI] [PubMed] [Google Scholar]
- Ianoul A., Mikhonin, A., Lednev, I.K., and Asher, S.A. 2002. UV resonance Raman study of the spatial dependence of α-helix unfolding. J. Phys. Chem. A 106: 3621–3624. [Google Scholar]
- Jackson S.E. 1998. How do small single-domain proteins fold? Fold. Des. 3: R81–R91. [DOI] [PubMed] [Google Scholar]
- Jiji R.D., Balakrishnan, G., Hu, Y., and Spiro, T.G. 2006. Intermediacy of poly(L-proline) II and β-strand conformations in poly(L-lysine) β-sheet formation probed by temperature-jump/UV resonance Raman spectroscopy. Biochemistry 45: 34–41. [DOI] [PMC free article] [PubMed] [Google Scholar]
- Johnson M.L. 2000. Parameter correlations while curve fitting. Methods Enzymol. 321: 424–446. [DOI] [PubMed] [Google Scholar]
- Kaltashov I.A. and Eyles, S.J. 2005. Mass spectrometry in biophysics: Conformation and dynamics of biomolecules. John Wiley & Sons, New York.
- Kelly J.W. 1997. Amyloid fibril formation and protein misassembly: A structural quest for insights into amyloid and prion diseases. Structure 5: 595–600. [DOI] [PubMed] [Google Scholar]
- Kelly J.W. 1998a. The alternative conformations of amyloidogenic proteins and their multi-step assembly pathways. Curr. Opin. Struct. Biol. 8: 101–106. [DOI] [PubMed] [Google Scholar]
- Kelly J.W. 1998b. The environmental dependency of protein folding best explains prion and amyloid diseases. Proc. Natl. Acad. Sci. 95: 930–932. [DOI] [PMC free article] [PubMed] [Google Scholar]
- Khurana R., Gillespie, J.R., Talapatra, A., Minert, L.J., Ionescu-Zanetti, C., Millett, I., and Fink, A.L. 2001. Partially folded intermediates as critical precursors of light chain amyloid fibrils and amorphous aggregates. Biochemistry 40: 3525–3535. [DOI] [PubMed] [Google Scholar]
- Kim J.Y., Kim, K.W., Kwon, H.J., Lee, D.W., and Yoo, J.S. 2002. Probing lysine acetylation with a modification-specific marker ion using high-performance liquid chromatography electrospray-mass spectrometry with collision-induced dissociation. Anal. Chem. 74: 5443–5449. [DOI] [PubMed] [Google Scholar]
- Konermann L. 2004. Fred Beamish award lecture—Exploring the dynamics of biological systems by mass spectrometry. Can. J. Chem. 82: 1565–1580. [Google Scholar]
- Krebs M.R.H., Wilkins, D.K., Chung, E.W., Pitkeathly, M.C., Chamberlain, A.K., Zurdo, J., Robinson, C.V., and Dobson, C.M. 2000. Formation and seeding of amyloid fibrils from wild-type hen lysozyme and a peptide fragment from the β-domain. J. Mol. Biol. 300: 541–549. [DOI] [PubMed] [Google Scholar]
- Kulkarni S.K., Ashcroft, A.E., Carey, M., Masselos, D., Robinson, C.V., and Radford, S.E. 1999. A near-native state on the slow refolding pathway of hen lysozyme. Protein Sci. 8: 35–44. [DOI] [PMC free article] [PubMed] [Google Scholar]
- Lashuel H.A., Petre, B.M., Wall, J., Simon, M., Nowak, R.J., Walz, T., and Lansbury Jr, P.T. 2002. α-Synuclein, especially the Parkinson's disease-associated mutants, forms pore-like annular and tubular protofibrils. J. Mol. Biol. 322: 1089–1102. [DOI] [PubMed] [Google Scholar]
- Lednev I.K., Karnoup, A.S., Sparrow, M.C., and Asher, S.A. 1999. α-Helix peptide folding and unfolding activation barriers: A nanosecond UV resonance Raman study. J. Am. Chem. Soc. 121: 8074–8086. [Google Scholar]
- Lednev I.K., Ermolenkov, V.V., He, W., and Xu, M. 2005. Deep-UV Raman spectrometer tunable between 193 and 205 nm for structural characterization of proteins. Anal. Bioanal. Chem. 381: 431–437. [DOI] [PubMed] [Google Scholar]
- Loo J.A., Loo, R.R., Udseth, H.R., Edmonds, C.G., and Smith, R.D. 1991. Solvent-induced conformational changes of polypeptides probed by electrospray-ionization mass spectrometry. Rapid Commun. Mass Spectrom. 5: 101–105. [DOI] [PubMed] [Google Scholar]
- Malinowski E.R. 2002. Factor analysis in chemistry, 3d ed. John Wiley & Sons, New York.
- Matagne A., Chung, E.W., Ball, L.J., Radford, S.E., Robinson, C.V., and Dobson, C.M. 1998. The origin of the α-domain intermediate in the folding of hen lysozyme. J. Mol. Biol. 277: 997–1005. [DOI] [PubMed] [Google Scholar]
- Matagne A., Marc, J., Chung, E.W., Robinson, C.V., Radford, S.E., and Dobson, C.M. 2000. Thermal unfolding of an intermediate is associated with non-Arrhenius kinetics in the folding of hen lysozyme. J. Mol. Biol. 297: 193–210. [DOI] [PubMed] [Google Scholar]
- Matsuda A., Nagao, H., Nakamura, K.G., and Kondo, K. 2003. Time-resolved Raman spectra of ring-stretching modes of benzene derivatives under laser-driven shock compression at 1 GPa. Chem. Phys. Lett. 372: 911–914. [Google Scholar]
- McLaughlin R.W., De Stigter, J.K., Sikkink, L.A., Baden, E.M., and Ramirez-Alvarado, M. 2006. The effects of sodium sulfate, glycosaminoglycans, and Congo red on the structure, stability, and amyloid formation of an immunoglobulin light-chain protein. Protein Sci. 15: 1710–1722. [DOI] [PMC free article] [PubMed] [Google Scholar]
- Michalewicz Z. 1996. Genetic algorithms + data structures = evolution programs, 3d ed. Springer-Verlag, New York.
- Miranker A., Robinson, C.V., Radford, S.E., and Dobson, C.M. 1996. Investigation of protein folding by mass spectroscopy. FASEB J. 10: 93–101. [DOI] [PubMed] [Google Scholar]
- Mirza U.A. and Chait, B.T. 1997. Do proteins denature during droplet evolution in electrospray ionization? Int. J. Mass Spectrom. Ion Process. 162: 173–181. [Google Scholar]
- Mohimen A., Dobo, A., Hoerner, J.K., and Kaltashov, I.A. 2003. A chemometric approach to detection and characterization of multiple protein conformers in solution using electrospray ionization mass spectrometry. Anal. Chem. 75: 4139–4147. [DOI] [PubMed] [Google Scholar]
- Navea S., Tauler, R., and Juan, A.D. 2006. Monitoring and modeling of protein processes using mass spectrometry, circular dichroism, and multivariate curve resolution methods. Anal. Chem. 78: 4768–4778. [DOI] [PubMed] [Google Scholar]
- Navea S., Taulerb, R., and Juan, A.D. 2005. Application of the local regression method interval partial least-squares to the elucidation of protein secondary structure. Anal. Biochem. 336: 231–242. [DOI] [PubMed] [Google Scholar]
- Nelson R., Sawaya, M.R., Balbirnie, M., Madsen, A.O., Riekel, C., Grothe, R., and Eisenberg, D. 2005. Structure of the cross-β spine of amyloid-like fibrils. Nature 435: 773–778. [DOI] [PMC free article] [PubMed] [Google Scholar]
- Nettleton E.J. and Robinson, C.V. 2000. Probing the nature of amyloidogenic proteins by mass spectrometry. In Mass spectrometry in biology and medicine (eds. A.L. Burlingame et al.), pp. 53–72. Humana Press, Totowa, NJ.
- Oliva F.Y. and Muňoz, V. 2004. A simple thermodynamic test to discriminate between two-state and downhill folding. J. Am. Chem. Soc. 126: 8596–8597. [DOI] [PubMed] [Google Scholar]
- Oomens J., Polfer, N., Moore, D.T., van der Meer, L., Marshall, A.G., Eyler, J.R., Meijere, G., and von Helden, G. 2005. Charge-state resolved mid-infrared spectroscopy of a gas-phase protein. Phys. Chem. Chem. Phys. 7: 1345–1348. [DOI] [PubMed] [Google Scholar]
- Pan P. and McLuckey, S.A. 2003. Electrospray ionization of protein mixtures at low pH. Anal. Chem. 75: 1491–1499. [DOI] [PubMed] [Google Scholar]
- Pan J., Rintala-Dempsey, A.C., Li, Y., Shaw, G.S., and Konermann, L. 2006. Folding kinetics of the S100A11 protein dimer studied by time-resolved electrospray mass spectrometry and pulsed hydrogen-deuterium exchange. Biochemistry 45: 3005–3013. [DOI] [PubMed] [Google Scholar]
- Pepys M.B., Hawkins, P.N., Booth, D.R., Vigushin, D.M., Tennent, G.A., Soutar, A.K., Totty, N., Nguyen, O., Blake, C.C.F., Terry, C.J., et al. 1993. Human lysozyme gene mutations cause hereditary systemic amyloidosis. Nature 362: 553–557. [DOI] [PubMed] [Google Scholar]
- Pfeil W. 1981. Thermodynamics of α-lactalbumin unfolding. Biophys. Chem. 13: 181–186. [DOI] [PubMed] [Google Scholar]
- Press W.H. 2002. Numerical recipes in C++: the art of scientific computing, 2d ed. Cambridge University Press, Cambridge, UK.
- Privalov P.L. 1979. Stability of proteins: Small globular proteins. Adv. Protein Chem. 33: 167–241. [DOI] [PubMed] [Google Scholar]
- Privalov P.L. and Khechinashvili, N.N. 1974. A thermodynamic approach to the problem of stabilization of globular protein structure: A calorimetric study. J. Mol. Biol. 86: 684–685. [DOI] [PubMed] [Google Scholar]
- Raleigh D.P. and Plaxco, K.W. 2005. The protein folding transition state: What are ϕ-values really telling us? Protein Pept. Lett. 12: 117–122. [DOI] [PubMed] [Google Scholar]
- Rencher A.C. 1998. Multivariate statistical inference and applications. Wiley, New York.
- Rockwood A.L., Busman, M., Udseth, H.R., and Smith, R.D. 1991. Thermally induced dissociation of ions from electrospray mass spectrometry. Rapid Commun. Mass Spectrom. 5: 582–585. [Google Scholar]
- Rodriguez-Cruz S.E., Klassen, J.S., and Williams, E.R. 1997. Hydration of gas-phase gramicidin S (M + 2H)2+ ions formed by electrospray: The transition from solution to gas-phase structure. J. Am. Soc. Mass Spectrom. 8: 565–568. [DOI] [PMC free article] [PubMed] [Google Scholar]
- Ross C.A. and Poirier, M.A. 2004. Protein aggregation and neurodegenerative disease. Nat. Med. 10: S10–S17. [DOI] [PubMed] [Google Scholar]
- Ruotolo B.T. and Robinson, C.V. 2006. Aspects of native proteins are retained in vacuum. Curr. Opin. Chem. Biol. 10: 402–408. [DOI] [PubMed] [Google Scholar]
- Samalikova M., Matecko, I., Mueller, N., and Grandori, R. 2004. Interpreting conformational effects in protein nano-ESI-MS spectra. Anal. Bioanal. Chem. 378: 1112–1123. [DOI] [PubMed] [Google Scholar]
- Serpell L.C. 2000. Alzheimer's amyloid fibrils: Structure and assembly. Biochim. Biophys. Acta 1502: 16–30. [DOI] [PubMed] [Google Scholar]
- Shashilov V.A., Ermolenkov, V.V., and Lednev, I.K. 2006a. Multiple bicyclic diamide-lutetium complexes in solution: Chemometric analysis of deep-UV Raman spectroscopic data. Inorg. Chem. 45: 3606–3612. [DOI] [PubMed] [Google Scholar]
- Shashilov V.A., Xu, M., Ermolenkov, V.V., and Lednev, I.K. 2006b. Latent variable analysis of Raman spectra for structural characterization of proteins. J. Quant. Spectrosc. Radiat. Transf. 102: 46–61. [Google Scholar]
- Shenton M.J., Herman, H., and Stevens, G.C. 2000. Using spectroscopy with chemometrics to measure polymer molar mass. Polym. Int. 49: 1007–1013. [Google Scholar]
- Sunde M. and Blake, C.C.F. 1998. From the globular to the fibrous state: Protein structure and structural conversion in amyloid formation. Q. Rev. Biophys. 31: 1–39. [DOI] [PubMed] [Google Scholar]
- Surewicz W.K., Jones, E.M., and Apetri, A.C. 2006. The emerging principles of mammalian prion propagation and transmissibility barriers: Insight from studies in vitro. Acc. Chem. Res. 39: 654–662. [DOI] [PubMed] [Google Scholar]
- Svensson O., Josefson, M., and Langkilde, F.W. 1999. Reaction monitoring using Raman spectroscopy and chemometrics. Chemometr. Intell. Lab. Syst. 49: 49–66. [Google Scholar]
- Tycko R. 2004. Progress towards a molecular-level structural understanding of amyloid fibrils. Curr. Opin. Struct. Biol. 14: 96–103. [DOI] [PubMed] [Google Scholar]
- Uversky V.N. and Fink, A.L. 2004. Conformational constraints for amyloid fibrillation: The importance of being unfolded. Biochim. Biophys. Acta 1698: 131–153. [DOI] [PubMed] [Google Scholar]
- Valentine S.J., Anderson, J.G., Ellington, A.D., and Clemmer, D.E. 1997. Disulfide-intact and -reduced lysozyme in the gas phase: Conformations and pathways of folding and unfolding. J. Phys. Chem. B 101: 3891–3900. [Google Scholar]
- Velicelebi G. and Sturtevant, J.M. 1979. Thermodynamics of the denaturation of lysozyme in alcohol-water mixtures. Biochemistry 18: 1180–1186. [DOI] [PubMed] [Google Scholar]
- Vernaglia B.A., Huang, J., and Clark, E.D. 2004. Guanidine hydrochloride can induce amyloid fibril formation from hen egg-white lysozyme. Biomacromolecules 5: 1362–1370. [DOI] [PubMed] [Google Scholar]
- Westermark P., Wernstedt, C., Wilander, E., Hayden, D.W., O'Brien, T.D., and Johnson, K.H. 1987. Amyloid fibrils in human insulinoma and islets of Langerhans of the diabetic cat are derived from a neuropeptide-like protein also present in normal islet cells. Proc. Natl. Acad. Sci. 84: 3881–3885. [DOI] [PMC free article] [PubMed] [Google Scholar]
- Wetzel R. 2002. Ideas of order for amyloid fibril structure. Structure 10: 1031–1036. [DOI] [PubMed] [Google Scholar]
- Wintrode P.L., Rojsajjakul, T., Vadrevu, R., Matthews, C.R., and Smith, D.L. 2005. An obligatory intermediate controls the folding of the α-subunit of tryptophan synthase, a TIM barrel protein. J. Mol. Biol. 347: 911–919. [DOI] [PubMed] [Google Scholar]
- Wise B.M., Gallagher, N.B., Bro, R., Shaver, J.M., Windig, W., and Koch, R.S. 2005. PLS_Toolbox 3.5 for use with Matlab. Eigenvector Research Inc, Wenatchee, WA.
- Xu M., Ermolenkov, V.V., He, W., Uversky, V.N., Fredriksen, L., and Lednev, I.K. 2005. Lysozyme fibrillation: Deep UV Raman spectroscopic characterization of protein structural transformation. Biopolymers 79: 58–61. [DOI] [PubMed] [Google Scholar]
- Yang W.Y. and Gruebele, M. 2004. Detection-dependent kinetics as a probe of folding landscape microstructure. J. Am. Chem. Soc. 126: 7758–7759. [DOI] [PubMed] [Google Scholar]
- Yonezawa Y., Tanaka, S., Kubota, T., Wakabayashi, K., Yutani, K., and Fujiwara, S. 2002. An insight into the pathway of the amyloid fibril formation of hen egg white lysozyme obtained from a small-angle X-ray and neutron scattering study. J. Mol. Biol. 323: 237–251. [DOI] [PubMed] [Google Scholar]
- Ziegler L.D. and Albrecht, A.C. 1979. Ultraviolet preresonance Raman scattering of benzene derivatives. I. Excitation profiles for fundamentals. J. Chem. Phys. 70: 2634–2643. [Google Scholar]