

Abstract
Wild-type thymidylate synthase (WT-TS) from Escherichia coli and several of its mutants showed varying degrees of susceptibility to trypsin. While WT-TS was resistant to trypsin as were the mutants C146S, K48E, and R126K, others such as Y94A, Y94F, C146W, and R126E were digested but at different rates from one another. The peptides released from the mutants were identified by mass spectrometry and Edman sequence analysis. The known crystal structures for WT-TS, Y94F, and R126E, surprisingly, showed no structural differences that could explain the difference in their susceptibility to trypsin. One explanation is that the mutations could perturb the dynamic equilibrium of the dimeric state of the mutants as to increase their dissociation to monomers, which being less structured than the dimer, would be hydrolyzed more readily by trypsin. Earlier studies appear to support this proposal since conditions that promote subunit dissociation in solutions of R126E with other inactive mutants, such as dilution, low concentrations of urea, and elevated pH, greatly enhance the rate of restoration of TS activity. Analytic ultracentrifuge studies with various TSs in urea, or at pH 9.0, or that have been highly diluted are, for the most part, in agreement with this thesis, since these conditions are associated with an increase in dissociation to monomers, particularly with the mutant TSs. However, these studies do not rule out the possibility that conformation differences among the various TS dimers are responsible for the differences in susceptibility to trypsin, particularly at high concentrations of protein where the WT-TS and mutants are mainly dimers.
Keywords: mutations, thymidylate synthase, subunit dissociation, proteolysis, mass spectrometry, peptide identification
Proteins are presented diagrammatically in books and journals as rigid structures although they are more likely dynamic in solution. This is a consequence of the nature of the data sets used to capture their predominant equilibrium conformations as determined by X-ray and NMR analyses, wherein the multiple conformations of a protein are presented as a static snapshot of its average structure. Evidence for the dynamic nature of proteins comes from the striking conformational changes that occur on ligand binding or during formation of functional complexes with other proteins or DNA (Palmer 2004; Gutteridge and Thornton 2005; Boehr et al. 2006; Volkov et al. 2006). Thymidylate synthase (TS) for example undergoes a large change in conformation on binding its substrates or related ligands (Montfort et al. 1990), and such changes lead to increased rates of catalysis by many orders of magnitude. More difficult to study are the dynamic fluctuations that propagate local changes over large distances and can affect the intrinsic plasticity of a protein (Eisenmesser et al. 2005). Subunit exchange in multimeric proteins is one such example, where proteins exist predominantly as oligomers, which are in equilibrium with their monomeric subunits. This condition can be altered by mutations in the linear sequence, as well as by large dilutions (Maley et al. 1995; Saxl et al. 2001). Proteins in the latter state when present at microgram per milliliter levels are particularly difficult to manipulate by means of crystallography and NMR, where high concentrations of protein are required (milligrams per milliliter), a condition which favors the dimeric form of TS. However, at low concentrations of protein these species, although difficult to detect, can be assessed indirectly through the use of trypsin, SDS-PAGE, and ultracentrifuge analysis, as will be described in this article.
The first indication we had that the TS dimer was not as rigid in solution as would be expected from its observed crystal structure (Montfort et al. 1990) came from the finding that specific inactive mutant TS homodimers, such as C146W and R126E, when mixed together at room temperature yielded an active heterodimer with an activity equivalent to that of the native enzyme (Maley et al. 1995; Saxl et al. 2001). Since only one of the two subunits appears to be active under these conditions, the enzyme possesses the characteristics described for a half-the-sites-of-activity enzyme (Maley et al. 1995). As a consequence of this property we hypothesized that the subunits of the mutant homodimers dissociate in dilute solution and then reform as a more stable heterodimer to restore one of the enzyme's two active sites as described by Saxl et al. (2001) and West et al. (2004). The magnitude of this change is quite striking since the R126E mutation reduces the TS activity of the wild-type enzyme by about 2000-fold (Strop et al. 1997), while the TS activity of C146W mutant is not measurable. The exchange of the R126E mutant subunits with other TS mutant subunits implies that this process is facilitated by subtle differences in conformation, which alter the dynamics of exchange between the subunits of WT-TS and its inactive mutants favoring dissociation to monomers in the latter case. In this article we will present evidence that the dynamics of monomer–dimer exchange in dilute solutions of specific TS mutants could make them more susceptible to trypsin digestion relative to WT-TS. However, it cannot be ruled out that some if not most of the mutants are conformationally less compact than WT-TS, which, as a result, are more susceptible to trypsin. These differences are not apparent in the protein of WT-TS crystals, which, at the concentration of protein present, are mainly dimer, an effect that is particularly true in the case of Y94F, whose X-ray structure is almost identical to WT-TS (Roberts et al. 2006). As discussed recently by Volkov et al. (2006) since protein complexes in solution consist of multiple species, the crystal structure might represent only a subpopulation of protein orientations, one that is not the most active form. Such may be the case in the studies to be described in this article.
Results
Differential response of WT-TS and several of its mutants to trypsin
As described in earlier publications (Maley et al. 1995; Saxl et al. 2001), when R126E, an inactive mutant homodimer of TS, is mixed with other inactive mutants of TS in solution, a relatively rapid restoration of enzyme activity occurs. In fact, activity was completely restored to the resulting heterodimer even though only one of the two subunits is functionally active, confirming the half-the-sites-of-activity properties of this enzyme proposed much earlier (Galivan et al. 1977b). Other investigators have since come to a similar conclusion using a variety of TSs from different species (Chen et al. 1996; Spencer et al. 1997; Anderson et al. 1999; Johnson et al. 2002). In order for heterodimer formation to occur, it was logical to assume that the mutant homodimers had to dissociate somewhat to their respective monomers and then reassemble to the active heterodimeric state. However, WT-TS showed no apparent inclination to dissociate and, based on the apparent differences in their ability to dissociate, we reasoned that it should be possible to distinguish between the various TS mutant homodimers by their susceptibility to trypsin. The validity of this assumption is clearly seen in Figure 1, where it is shown that under conditions where WT-TS shows no apparent susceptibility to trypsin when subjected to SDS-PAGE, the TS mutants C146W, Y94F, Y94A, and R126E and the DM (R126E–C146W) are clearly susceptible. Other mutants such as C146S and K48E are apparently much more resistant. Of significance is the fact that the latter two mutants, when mixed with R126E, restore TS activity much more slowly than C146W and Y94F (Maley et al. 1995), which is consistent with the greater susceptibility of C146W and Y94F to trypsin digestion. This result could be rationalized if there were relatively greater concentrations of monomers in solution in the case of C146W, Y94F, Y94A, and (R126E–C146W) due to their greater tendency to dissociate relative to WT-TS, C146S, and K48E, which are resistant to proteolysis because of their more structured dimeric composition. It would appear then that the inability of WT-TS to dissociate or to dissociate at least to a minimal degree relative to (R126E–C146W) is reflected in the rather large difference in susceptibility of these proteins to trypsin (Fig. 1). Alternatively, the response to trypsin could be the result of conformational differences between the two proteins or a combination of both effects.
Figure 1.
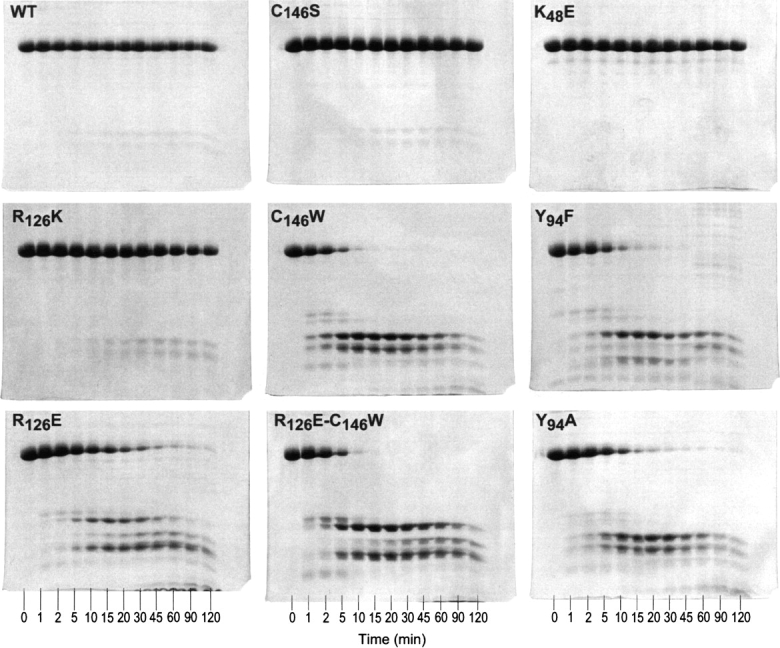
Time course of tryptic proteolysis of WT and mutant TSs. The protein was digested with TPCK treated trypsin (100/1). Aliquots of the reactions were taken at 0, 1, 2, 5, 10, 15, 20, 30, 45, 60, 90, and 120 min. These aliquots were quenched in SDS-PAGE loading buffer and boiled for 5 min. Samples of each protein were loaded and run out on a 15% SDS-PAGE as described in Materials and Methods.
Identifying the peptides released from the TS mutants by trypsin
To determine the identity of the peptides released from the various TS mutants (Fig. 1), some apparently being released more rapidly than others, we found that much sharper peptide bands could be obtained with 4%–20% gradient gels (Fig. 2) than with the 15% gels used in Figure 1. Of the four mutants examined in Figure 2, it is clear that the rates of proteolysis by trypsin followed the order of C146W > Y94F > Y94F > R126E. The susceptibility to proteolytic breakdown of each mutant can also be followed by the rate of hydrolysis of band A (TS monomer at 31 kDa) with time. Mass spectrometry was used to identify each peptide and was confirmed by transblotting the peptide onto PVDF membranes followed by Edman sequence analysis of each. The mass and location of each peptide in the TS sequence is presented in Table 1 and Supplemental Table S1, respectively, with the latter table presenting the most likely sites where hydrolysis occurred relative to all of the sites that could be affected, if they were accessible to trypsin. These sites are indicated by the slashes in the Escherichia coli TS sequence presented in Supplemental Table S1. R126E may be more resistant compared to the other mutants because the substitution of an E for the R at position 12 could make this site less susceptible to trypsin. In this case only peptide D′ (128–264) was detected whereas in the case of C146W and Y94A or Y94F, larger amounts of peptide were observed in this region (Fig. 2) due to hydrolysis at both R126 and R127. Peptides smaller than 10 kDa were also detected, and those that could be seen on the gel in Figure 2 are presented in Table 1. Even smaller peptides were detected by mass spectrometry, as would be expected once the hydrolysis cascade was initiated, but are not presented since they had run off the gel and could not be detected. It is of interest to note that on comparing the peptides released from Y94F relative to the other mutants, peptide F is missing (Fig. 2), and appears to be associated with the presence of a higher concentration of peptide G. The substitution of F for Y at position 94 appears to increase the cleavage at the R99 site of the sequence but not when A is substituted for Y (see the hydrolysis products from R126E or C146W in Fig. 2). Another possibility is that R99 in the Y94F peptide is resistant to cleavage in this mutant, or that the conformation of Y94F in solution is somewhat different from the other mutants, resulting in the K140 site in this peptide being more resistant to trypsin (Supplemental Table S1).
Figure 2.

Comparison of tryptic peptide release from various TS mutants over time. TS mutants Y94F, Y94A, R126E, and C146W (200 μg each in 200 μL of 50 mM Tris at pH 8.0) were digested with TPCK trypsin (100/1). Aliquots of 20 μL were taken at 0, 5, 30, and 60 min, quenched with SDS-PAGE buffer, boiled, and loaded on to a 4%–20% gradient SDS-PAGE as described in Materials and Methods. (M) Molecular weight markers.
Table 1.
Limited trypsin digest of TS-mutants R126E, C146W, Y94A, and Y94F

Comparison of the hydrolysis of (R126E–C146W) by trypsin with its respective single mutants
As implied already, subtle conformational or structural differences appear to exist among the mutants or differences in their dynamic properties that enable them to be hydrolyzed at different rates (see Figs. 1, 2). (R126E–C146W) is hydrolyzed at a rate comparable to C146W (Fig. 3), and once the larger peptides are released (Table 1, peptides B and C) these appear to be hydrolyzed in turn to smaller peptides with time (peptides D, E, G, and H) and then to even smaller ones, such as peptide I (5 kDa; Fig. 2). One can clearly see distinct differences in the rates of peptide release at 5 min in Figures 2 and 3 (and even at 1–2 min in Fig. 1), indicating that trypsin can recognize subtle conformational or dynamic differences among these mutants. It is clearly seen in Figure 3 that (R126E–C146W) is hydrolyzed more readily at specific sites than the single mutants R126E and C146W. Thus, peptides C (108–24) and F (141–264) predominate in the case of (R126E–C146W) but are relatively minor peptides in the case of R126E and C146W. However, with C146W, peptide D (127–264) is a major peptide relative to the case of R126E and (R126E–C146W) and appears to be derived from peptide C (100–264), which again emphasizes the difference in susceptibility of these mutants to trypsin (see Supplemental Table S1 for the location of those peptides released from the E. coli TS sequence by trypsin). Conducting the hydrolyzes in the presence of 0.5–1.5 M urea (data not shown) emphasized the much greater susceptibility of C146W to trypsin relative to the other mutants in Figures 1 and 2.
Figure 3.

Comparison of tryptic peptide release from the DM (R126E–C146W) with its single mutant counterparts (R126E and C146W). Mutants R126E, R126E–C146W, and C146W (200 μg each) were digested with TPCK trypsin (100/1). Aliquots (20 μL) were taken at 1, 5, 30, and 60 min, quenched in SDS-PAGE loading buffer and boiled, and 20 μL were loaded on to a 4%–20% gradient SDS-PAGE as described in Materials and Methods.
Effect of ligands on protection of mutants against proteolysis
Despite these differences among the mutants with respect to their hydrolysis by trypsin, they become less apparent when the mutants are exposed to specific ligands. In earlier studies we demonstrated that dUMP and the folylpolyglutamates, both TS binding ligands, were very effective in protecting Lactobacillus casei TS from proteolysis by trypsin and chymotrypsin (Galivan et al. 1977a). Similar results have now been obtained with the E. coli TS mutants, Y94F and C146W both being very susceptible to hydrolysis by trypsin (Figs. 1–3). In the earlier study, the endpoint of these measurements was the loss in enzyme activity (Galivan et al. 1977b). In the present studies we measured protection of the mutants by the indicated ligands against proteolysis and, similar to the earlier studies, dUMP and the folate analog inhibitor of TS, PDDF, markedly protected C146W and Y94F from trypsin, particularly when the two compounds were present at the same time (Supplemental Fig. S1) as noted by the stability of the 31-kDa TS subunit. Both compounds, when present together, have been shown to affect a large conformational change in WT-TS, particularly at the C-terminal end and the active site (Montfort et al. 1990; Kamb et al. 1992), in addition to a smaller ligand-induced segmental accommodation of specific regions, which could result in the enzyme protein being less accessible to trypsin. This change apparently also occurs in the case of the mutants, which still bind dUMP and PDDF (Supplemental Fig. S1). The effect of dUMP and PDDF on the structure of complexed E. coli TS (gray) is obvious in Figure 4, when compared with the uncomplexed enzyme (black). An alternative possibility is that the binding ligands limit the dissociation of the homodimers to monomers, and since the former state would be less susceptible to trypsin than the latter, the hydrolysis would appear to be restricted. Somewhat similar findings on the protection of the L. casei WT-TS from trypsin by dUMP were reported earlier by Mohsen et al. (1995), but their studies were concerned only with the wild-type enzyme. It is obvious from our studies that the mutants, although much more susceptible to trypsin than WT-TS, can still be protected by dUMP and other substrate analogs, indicating that these ligands can still bind to the TS mutants and influence their dissociation and (or) degree of compactness.
Figure 4.

Effect of ligand binding on the E. coli thymidylate synthase (TS) conformation. The superposition of the structures of uncomplexed TS (Protein Data Bank entry 2FTQ, light gray) and its dUMP/CB3717 complex (2TSC, black) reveals a narrowing of the substrate-binding site (top) upon substrate binding. The largest shift (∼4.0 Å) is observed at the C terminus as described in detail by Montfort et al. (1990).
Sensitivity of the TS-dimer state to dissociation as determined by analytic ultracentrifuge analysis
As shown earlier, the conditions of low urea (1.0–1.5 M) or a pH of ∼9.0 greatly enhance the rate of reactivation of TS on mixing the minimally active mutants R126E and Y94A (Saxl et al. 2001). Under the above conditions the restoration of activity was almost instantaneous, particularly at pH 9.0. These findings suggested that the rapid appearance of activity was in part due to a greater concentration of mutant subunits at pH 9.0 than at pH 7.5, which, as a consequence of mass action, interacted to form the active heterodimer. The above proteolysis experiments implied that the subunits are in equilibrium with their respective homodimers or, alternatively, that a conformational difference in the proteins resulting from a specific mutation in the homodimer enabled trypsin to have greater access to specific susceptible regions relative to WT-TS. It is possible that both phenomena are occurring at the same time. To determine if this is the case, we examined the oligomeric state of WT-TS and three of its mutants (R126E, Y94A, and C146W) when exposed to 0.5 M, 1.0 M, and 1.5 M urea, to verify whether monomeric forms of these proteins could be detected by sedimentation velocity in the analytic ultracentrifuge. At a concentration of 0.5 M urea, the peaks showed some broadening relative to those in the absence of urea (Fig. 5), but at 1.0 M urea, a peak corresponding to a monomeric subunit was evident in the sedimentation patterns in addition to the dimer. On increasing the concentration of urea to 1.5 M the peaks for R126E, Y94A, and C146W became quite diffuse, showing both high molecular weight bands and monomer. In contrast it should be noted that the WT-TS dimeric structure was unaffected by 1.5 M urea, as anticipated from its greater stability relative to these mutants, when exposed to trypsin (Fig. 1). The broadness of the bands in 1.5 M urea over a range of high S20,W values is probably due to the aggregation of the monomers to oligomers. These results are consistent with the finding that low urea concentrations enhance the dissociation of the inactive mutants, which then interact with R126E subunits to yield an active heterodimer (Maley et al. 1995; Saxl et al. 2001). For this to occur, the heterodimer must be more stable than the mutant homodimers. It is not obvious how the dissociation enables subunits of one homodimer to associate with another to yield active enzyme, but it is clear that a perturbation of the dimeric state is involved in this process and is supported by the finding that the mutants are hydrolyzed more rapidly by trypsin in the presence of 0.5–1.5 M urea. Thus, R126E showed less breakdown in the TS region (31 kDa) than Y94F and C146W, but the latter was completely digested by trypsin in 0.5 M urea when measured by SDS-PAGE (data not shown), which again emphasizes the difference in structural stability of these mutants. As expected, WT-TS was hardly affected by trypsin even at 1.5 M urea, where it still retains its dimeric state in contrast to the mutants. It would be fair to state therefore that those mutants that are most affected by urea are the ones most susceptible to trypsin digestion, as expected from the results in Figure 5.
Figure 5.

Effect of urea on the sedimentation of WT and mutant TSs. Individual samples of WT-TS, R126E, Y94A, and C146W were dialyzed against 2 × 250 mL solutions of 50 mM potassium phosphate (pH 7.5) and 1 mM DTT overnight. The concentration of each protein was determined by UV absorption at 280 nm (Strop et al. 1997) and then diluted with dialysate to a concentration of 100 μg/ mL. This sample was loaded in an aluminum two-sector centerpiece cell with quartz windows. Absorption optics set at 230 nm were used to follow the sedimentation of the sample spinning at 50,000 rpm. The centrifuge was accelerated directly to the speed of the experiment. The data were analyzed by the c(s) and c(M) methods described in Sedfit (Schuck 2000). The peaks at about 4S represent the dimeric form of TS and its mutant while those at about 2S represent the monomer. The shoulders in the 1 M urea panel probably represent the equilibrium between monomeric and dimeric forms of the TS mutants.
Since the mutants interact with R126E at pH 9.0 to yield active TS almost instantaneously (Saxl et al. 2001), it was of interest to determine the nature of their oligomeric state at this pH by analytic ultracentrifugation. As shown in Figure 6 all of the mutants, as well as WT-TS, dissociate in part to distinct monomers (2.1s) from their normal dimeric states (4.1s), with the mutants being more dissociated than WT-TS. While R126E and Y94A are predominantly monomers, C146W appears to consist of multiple states, including dimer and possibly hexamer. The distinctness of the peaks in Figure 6 is in contrast to those in 1.5 M urea (Fig. 5), but is also consistent with the more rapid restoration of activity at pH 9.0 (Saxl et al. 2001). It is interesting to note that mixing R126E and Y94A in equal amounts yields more apparent dimer than occurs with R126E and Y94A alone, as determined by measuring the area under the peaks. Based on what is known about the rapid rate of restoration of activity at this pH (Saxl et al. 2001), it is most likely that the dimer peak consists mainly of active heterodimer in addition to some inactive homodimer. Although R126E no doubt influences the rate and extent to which the heterodimer forms, it is not possible to explain at this time how the subunits interact to restore enzyme activity. This process is probably more complex than just the formation of subunits, but in both cases it must involve a rapid interaction of monomeric subunits. To further verify that the dimeric state of TS is in equilibrium with its monomeric subunits, we followed the course of this relationship on diluting and measuring their status by sedimentation velocity analysis. It is clear from Supplemental Figures S2 (WT-TS) and S3 (C146W) that these proteins increasingly dissociate to monomers, as evidenced by the presence of both monomers and dimers on diluting them below concentrations of 2 μg/mL. This dissociation is even more prominent at concentrations <1 μg/mL where the monomeric state prevails. It was surprising that C146W and WT-TS dissociated to about the same degree at these low concentration (>1 μg/mL). Whether distinct differences in the Kd between the TS mutants and WT-TS exist are being investigated presently using sedimentation equilibrium analysis.
Figure 6.
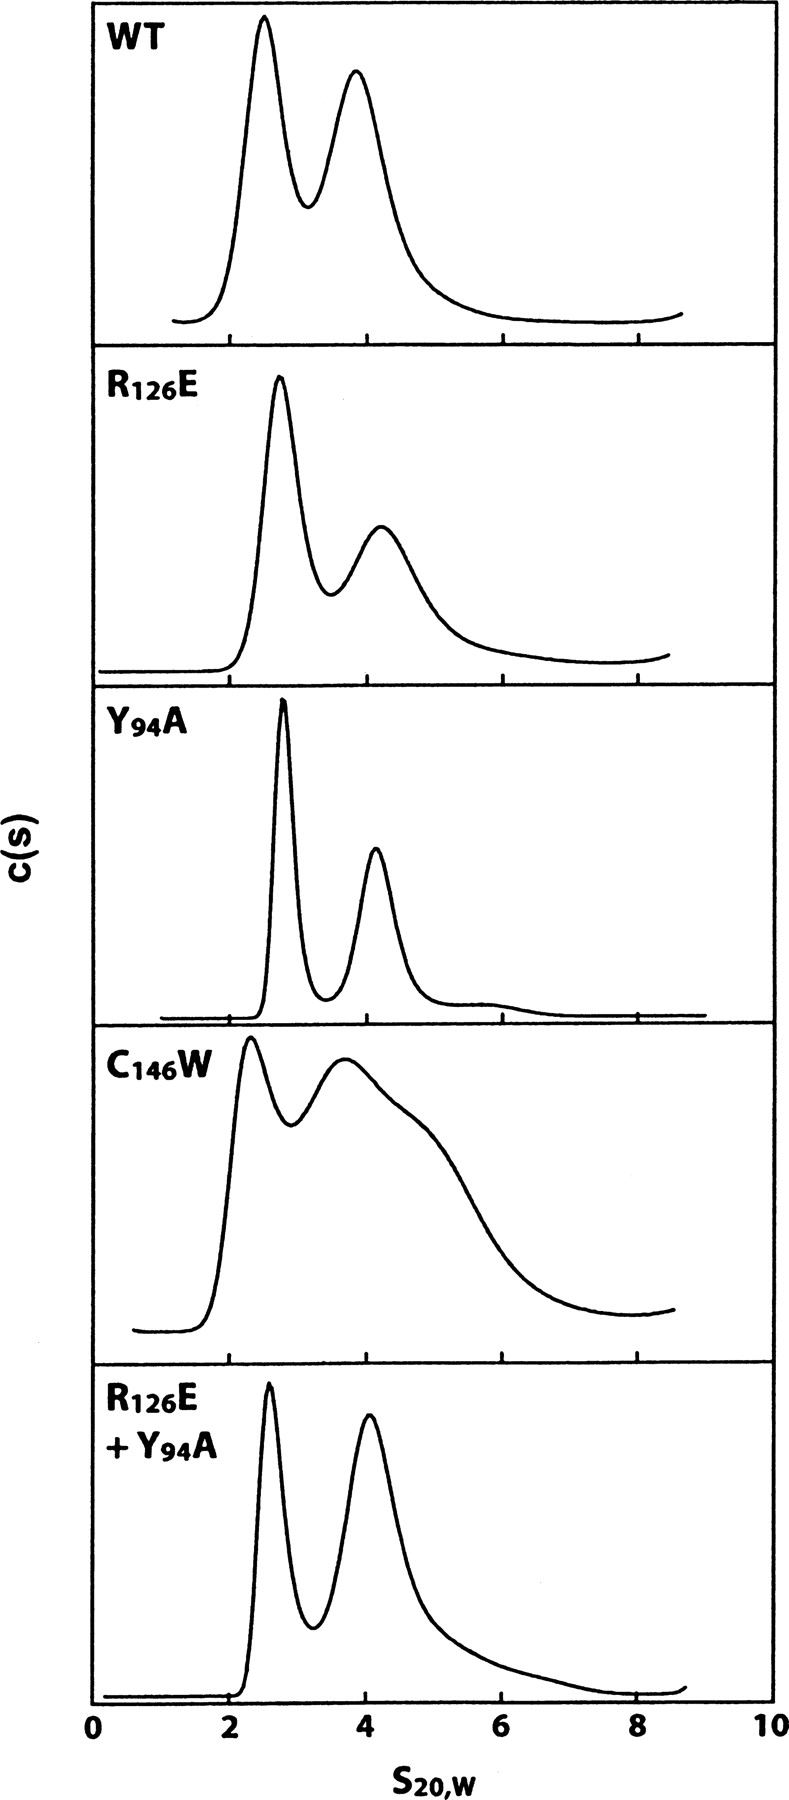
Effect of pH on the sedimentation of WT and mutant TSs. Individual samples of WT-TS, R126E, Y94A, and C146W were dialyzed against 2 × 250 mL of 50 mM Tris (pH 9.0) overnight. The concentration of the protein was determined by UV absorption at 280 nm (9) and then diluted with dialysate to a concentration of 100 μg/mL. For the heterodimer reaction sample, equal amounts of R126E and Y94A were codialyzed and then diluted with dialysate to a concentration of 100 μg/ mL. These samples were prepared singly and loaded into an aluminum two-sector centerpiece cell with quartz windows. Absorption optics set at 230 nm were used to follow the sedimentation of the sample spinning at 50,000 rpm. The centrifuge was accelerated directly to the speed of the experiment. The data were analyzed by the c(s) and c (M) methods found in Sedfit (Schuck 2000). Similar to the legend of Figure 4, the peaks at 4S represent the dimeric form of the TS proteins, while the 2S peaks represent the monomer.
Discussion
In an attempt to develop a model to explain how inactive mutant homodimers of TS interact to form an active TS heterodimer and whether this phenomenon is related to the difference in susceptibility of these mutants to trypsin, we have found that there is no one set of data to completely provide a satisfactory answer to this intriguing question. It is clear from numerous studies in the literature that mutant protein oligomers are often less compact than their wild-type counterparts making them more susceptible to proteolysis and to a breakdown to monomeric subunits. In the cases of TS, the mutant dimer (R126E)2, A, can interact in solution with any one of a number of inactive mutants, such as (C146W)2, B, to yield an active heterodimer (R126E–C146W), A-B. It can be proposed that there is equilibrium between the subunits as follows:
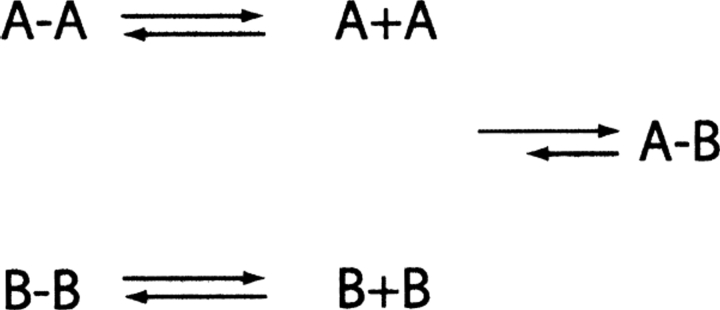 |
which contains the various specified subunits and dimers with A − B being the most stable form based on the measured increase in enzyme activity with time. This assumption is supported by several experiments, which reveal that any condition that perturbs the dimer–monomer equilibrium to increase the monomer level results in an increase in the rate of formation of the active heterodimer A − B. Thus, low concentrations of urea (1.5 M), ethanol, elevated temperature (37°C), and pH as well as dilution promote A − B formation and support this proposal (Maley et al. 1995; Saxl et al. 2001). In contrast, conditions that reduce the formation of monomer, i.e., low temperature (10°C), increased viscosity, or pHs < 7.0, slow the rate of A − B formation rather drastically.
However, other observations are not in complete agreement with the monomer–dimer proposal as shown in Supplemental Figs. S2 and S3, where sedimentation velocity analyses reveal that although dilution of WT-TS and its mutants to 2 μg/mL or less promotes monomer formation, 5 μg/mL or greater yields mainly dimer. This being the case, most of the TS assays that were performed to measure active heterodimer formation contained levels of protein favoring the presence of dimer predominantly. It is possible though that sufficient amount of nondetectable monomer were interspersed with the dimer to shift the equilibrium to A − B formation.
Another conflicting point relates to the varied susceptibility of the TS mutants described in Figure 1–3 to trypsin digestion, in contrast to the highly resistant WT-TS. These data are not consistent with the X-ray structures of such mutants as R126E (Strop et al. 1997) and Y94F (Roberts et al. 2006), which are almost identical to WT-TS. Being that the crystal structures of WT-TS and Y94F are so alike it is difficult to explain why Y94F is more susceptible to trypsin or why it forms active heterodimers so readily with R126E. It is of interest to note that recent studies using thermal CD titration that measures the temperature at which the protein structure unfolds to 50% (Tm) revealed that the Tm for Y94F is 46°C, the same as that for WT-TS. This is the same Tm reported for WT-TS using differential scanning calorimetry (Chen et al. 1996), again emphasizing the point that the structural forces holding WT-TS and Y94F together are about the same. One must conclude therefore that for whatever reason, the structure of WT-TS is not identical to the above mutants in solution, at least not in the eyes of trypsin. So how can this dilemma be resolved? One possibility is that the mutants are slightly more dissociated to the monomeric state than WT-TS, with the monomers being more readily proteolyzed than the dimers. However, at the concentrations of protein where the digestions were conducted (1 mg/mL), the major species by far would be dimeric, whether WT-TS or mutant. Another possibility is that there are subtle differences in compactness between the mutants and WT-TS in solution, which would allow trypsin greater access to the former, relative to the latter. Due to the marked alteration in structure that dUMP and folate analogs (Montfort et al. 1990) inflict on E. coli TS, it is presumed that they would have the same effect on the mutants to which they can bind, as seen by the resistance of the mutants in the presence of the substrate analogues (Supplemental Fig. S1).
Additionally it is becoming apparent that although protein structures are usually described as a single structural entity, they in reality exist as a composite of multiple conformations with only small energy differences between them (Gutteridge and Thornton 2005). As discussed by Volkov et al. (2006), protein complexes in solution are dynamic and the crystal structures could represent only a subpopulation of protein orientations. Since these multiple forms are in dynamic equilibrium with one another, it can be proposed similarly that A and B interact to form the lowest and most stable energy state, A − B.
While we have come a long way in explaining how proteins behave thermodynamically in solution, there are still many gaps to fill, such as how dimers unfold to monomers and then refold with one another to form homodimers or active heterodimers, as described earlier (Saxl et al. 2001) and in this article. This question may be extended further to the case of how subunits when released from ribosomes during the course of translation interact to form complex oligomeric structures. As we have shown earlier (West et al. 2004), this information can be exploited to inactivate WT-TS with a dominant-negative mutant of TS, an approach that could be useful for purposes of chemotherapy.
Materials and Methods
Chemicals and reagents
Ammonium sulfate obtained from ICN Pharmaceuticals and Tris·HCl from United States Biochemicals were ultrapure grade. Oligonucleotides were synthesized by the Wadsworth Center Oligonucleotide Synthesis Core facility, while peptide analysis was provided by our Peptide/Protein Sequencing and Mass Spectrometry Cores. Restriction, ligation, and other DNA modification enzymes were purchased form New England Biolabs and Boehringer Mannheim while Taq polymerase was obtained from Stratagene. Electrophoresis reagents were from BioRad and Pierce. DE-52 was obtained from Schleicher and Schuell, Inc., and phenyl sepharose 6 fast flow from Pharmacia Biotech. TPCK-treated trypsin was a generous gift of Dr. Thomas Plummer of our laboratory. All other materials were reagent grade and were obtained from standard commercial sources.
Preparation of WT-TS and TS-mutant proteins
TS was prepared using a high-expression system, which induced the enzyme to 50%–60% of the cellular protein of E. coli (Changchien et al. 2000). The enzyme and its mutants were purified to homogeneity in just three steps: sonication of the bacterial pellet, ammonium sulfate precipitation of the induced protein, and purification through a DE-52 anion exchange column as described previously (Changchien et al. 2000). The TS mutants were prepared from the thyA gene with the appropriate oligonucleotides using the Quik-Change procedure of Stratagene and were purified as above for WT-TS. Where necessary, a phenyl-sepharose purification step (Pedersen-Lane 1997) was added after the DE-52 column. If the mutant was inactive, SDS-PAGE was used to determine the least contaminated fractions to be pooled. The enzyme pools were concentrated in an Amicon ultrafiltration apparatus (W.R. Grace & Co.) with a 10-kDa cutoff filter. Proteins were stored as ammonium sulfate pellets at −70°C. Prior to use, the proteins were dissolved in a small volume of a solution containing 50 mM potassium phosphate (pH 7.5), 10% ethylene glycol, 1 mM DTT and then dialyzed against 2 × 250 mL of this buffer overnight. The dialyzed solutions were stored at −20°C.
Measurement of thymidylate synthase activity
The components of the assay solution were modified somewhat (Saxl et al. 2003) from that originally described by Wahba and Friedkin (1961). The kinetic assays were initiated by bringing the final volume of the reaction to 1.0 mL with the addition of 10–50 μL of enzyme solution. One unit of TS activity is defined as the amount of enzyme required to synthesize 1 μmol of dTMP/min at 30°C under the conditions of the assay. The protein concentration of TS was calculated from the thyA-TS amino acid sequence (Belfort et al. 1983) using the method of Gill and von Hippel (1989), which provided a molar extinction coefficient of 0.591 × 10⁵ M−1cm−1 at 280 nm. This value is equivalent to 1.71 A280 units/mg of protein.
Protein digestion
The mutants and WT-TS (620 μg, 10 nmol) were taken up in 1 mL of 400 mM ammonium bicarbonate (pH 8.0) and incubated in the presence of trypsin (w/w 1:100) at 25°C. Aliquots of 50 μL were quenched in 50 μL of SDS-PAGE loading buffer at specified times and subsequently boiled for 5 min. Peptides in aliquots of these digests were electrophoretically separated by 15% SDS-PAGE. For more refined separation of the peptides, precast 4%–20% polyacrylamide gels (8 cm × 5.8 cm × 1 mm) from Pierce were used. The running buffer for the gradient gels consisted of Tris-HEPES-SDS (100 mM/100 mM/3 mM).
N-terminal sequencing
To sequence the amino ends of the electrophoretically separated WT and mutant TS tryptic peptides, they were transblotted to a PVDF membrane (Bio-Rad or Perkin Elmer) and the membrane was lightly stained with 0.01% Coomassie blue. The transferred peptides were excised and sequenced with a model 477A protein/peptide sequencer from Applied Biosystems using their Blott Cartridge.
Analytical ultracentrifugation
Sedimentation velocity experiments were performed on a Beckman XLI analytical ultracentrifuge. Experiments were conducted at 25°C using a four-hole titanium AN-60-Ti rotor. The proteins were dialyzed overnight against 2 × 250 mL 50 mM potassium phosphate, 1 mM dithiothreitol (pH 7.5) or 50 mM Tris (pH 9.0) with urea as indicated. The viscosity (η) of the buffers, the density (δ) of the buffers, and the partial specific volume ( ) of the protein were obtained from SEDNTERP software developed by D. Hayes, T. Laue, and J.S. Philo, which can be downloaded from http://www.jphilo.mailway.com. The partial specific volume of TS calculated from its amino acid content was determined to be 0.736 mL/g at 25°C and 0.734 mL/g at 20°C. A sample volume of 420 μL and a reference volume of 440 μL of the dialysate were loaded in an aluminum two-sector centerpiece cell with quartz windows. Absorption optics set at 230 nm were used to follow the sedimentation of the sample spinning at 50,000 rpm. A single sample was run in each experiment with zero time between scans. The R min was set at 6.0, and the samples were scanned from the earliest time until the boundaries were at the cell bottom to obtain a large number of scans. Care was taken to be at thermal equilibrium before initiation of the centrifuge run. The centrifuge was accelerated directly to the speed of the experiment. The data were analyzed by the c(s) and c(M) methods found in Sedfit (Schuck 2000). The experimentally calculated sedimentation coefficients from the Sedfit program were converted to S20,w by multiplying the apparent five values by 0.92068 (pH 7.5, no urea), 0.95647 (pH 7.5, 0.5 M urea), 0.99965 (pH 7.5, 1 M urea), 1.0448 (pH 7.5, 1.5 M urea), and 0.90968 (pH 9.0, no urea) as described in the above program.
Mass spectrometric peptide analysis
Molecular weights of the peptides resulting from the limited trypsin digests of the TS mutants were obtained by nano-ESI-LC-MS with a Finnigan LCQ-DECA ion trap. The digests were loaded into the nano-LC system via a Protein CapTrap (Michrom Bioresources) and washed with 15% acetonitrile/0.2% formic acid to maximize the proportion of >3-kDa peptides obtained. TS peptides were separated by elution from a C4 column with a reverse phase gradient of 15%–80% acetonitrile/0.2% formic acid versus 0.2% formic acid/water ramped over 30 min, and introduced into the ion trap via ionization at the column exit tip. The C4 nano-column, 5 cm × 75 μm i.d., and PicoView nano-electrospray ionization source were from New Objective. TS sequence assignments from peptide masses were determined with the mass search feature of GPMAW (Lighthous Data).
Acknowledgments
We express our appreciation to the Biochemistry, Peptide Sequencing, and Mass Spectrometry cores of the Wadsworth Center for their excellent support, in particular Leslie Eisele for conducting the thermal CD titration experiments using a Jasco 720 CD apparatus and the sedimentation velocity analyses. We thank, in addition, Drs. William R. Montfort, Sue A. Roberts, and David C. Hyatt of the Department of Biochemistry and Molecular Biophysics of the University of Arizona, Tucson, Arizona, for providing the X-ray diffraction data to us on the TS mutant Y94F before submission for publication. This work was supported in part by a grant from the DOD Breast Cancer Research Program, DAMD 17-02-1-0405 (F.M.).
Footnotes
Supplemental material: see www.proteinscience.org
Reprint requests to: Frank Maley, Wadsworth Center, NY State Dept. of Health, Empire State Plaza, Box 509, Albany, NY 12201-0509, USA; e-mail: maley@wadsworth.org; fax: (518) 457-7893.
Abbreviations: Amino acid symbols: A, alanine; R, arginine; C, cysteine; E, glutamate, W, tryptophan; Y, tyrosine; CD, circular dichroism; dUMP, 2′-deoxyuridine 5′-monophosphate; H2PteGlu, 7,8-dihydrofolate; DTT, dithiothreitol; DM, double mutant (R126E–C146W); FdUMP, 5-fluoro-2′-deoxyuridine 5′-monophosphate; HEPES, (N-[2-hydroxyethyl] piperazine-N′-[2-ethanesulfonic acid]); CH2H4PteGlu, 5,10-methylene-6(R,S) tetrahydrofolate; NMR, nuclear magnetic resonance; PAGE, polyacrylamide gel electrophoresis; PVDF, polyvinylidene difluoride; PDDF, 10-propargyl 5, 8-dideazafolate; SDS, sodium dodecyl sulfate; dTMP, thymidine 5′-monophosphate; TPCK, tosylphenylchloromethylketone, Tris·HCl, Tris (hydroxymethyl)aminomethane-hydrochloride.
Article and publication are at http://www.proteinscience.org/cgi/doi/10.1110/ps.062509807.
References
- Anderson A.C., O'Neil, R.H., DeLano, W.L., and Stroud, R.M. 1999. The structural mechanism for half-the-sites reactivity in an enzyme, thymidylate synthase, involves a relay of changes between subunits. Biochemistry 38: 13829–13836. [DOI] [PubMed] [Google Scholar]
- Belfort M., Maley, G., Pedersen-Lane, J., and Maley, F. 1983. Primary structure of the Escherichia coli Thy A gene product and its thymidylate synthase product. Proc. Natl. Acad. Sci. 80: 4914–4918. [DOI] [PMC free article] [PubMed] [Google Scholar]
- Boehr D.D., Dyson, H.J., and Wright, P.E. 2006. An NMR perspective on enzyme dynamics. Chem. Rev. 106: 3055–3079. [DOI] [PubMed] [Google Scholar]
- Changchien L.-M., Garibian, A., Frasca, V., Lobo, A., Maley, G.F., and Maley, F. 2000. High level expression of Escherichia coli and Bacillus subtilis thymidylate synthases. Protein Expr. Purif. 19: 265–270. [DOI] [PubMed] [Google Scholar]
- Chen C.H., Davis, R.A., and Maley, F. 1996. Thermodynamic stabilization of nucleotide binding to thymidylate synthase by a potent benzoquinazoline folate analogue inhibitor. Biochemistry 35: 8786–8793. [DOI] [PubMed] [Google Scholar]
- Eisenmesser E.Z., Millet, D., Labeikovsky, W., Korzhnev, D.M., Wolf-Martz, M., Bosco, D.A., Skalicky, J.J., Kay, L.E., and Kern, D. 2005. Intrinsic dynamics of an enzyme underlies catalysis. Nature 438: 117–121. [DOI] [PubMed] [Google Scholar]
- Galivan J., Maley, F., and Baugh, C.M. 1977a. Protective effect of pteroylpolyglutamates and phosphate on the proteolytic inactivation of thymidylate synthase. Arch. Biochem. Biophys. 184: 346–354. [DOI] [PubMed] [Google Scholar]
- Galivan J., Noonan, J., and Maley, F. 1977b. Studies on the reactivity of the essential cysteine of thymidylate synthase. Arch. Biochem. Biophys. 184: 336–345. [DOI] [PubMed] [Google Scholar]
- Gill S.C. and von Hippel, P.H. 1989. Calculation of protein extinction coefficients from amino acid sequence data. Anal. Biochem. 182: 319–326. [DOI] [PubMed] [Google Scholar]
- Gutteridge A. and Thornton, J. 2005. Conformational change observed in enzyme crystal structures upon substrate binding. J. Mol. Biol. 346: 21–28. [DOI] [PubMed] [Google Scholar]
- Johnson E.F., Hinz, W., Atreya, C.E., Maley, F., and Anderson, K.S. 2002. Mechanistic characterization of Toxoplasma gondii thymidylate synthase (TS-DHFR)–dihydrofolate reductase. Evidence for a TS intermediate and TS half-sites reactivity. J. Biol. Chem. 277: 43126–43136. [DOI] [PubMed] [Google Scholar]
- Kamb A., Finer-Moore, J.S., and Stroud, R.M. 1992. Cofactor triggers the conformational change in thymidylate synthase: Implications for an ordered binding mechanism. Biochemistry 31: 12876–12884. [DOI] [PubMed] [Google Scholar]
- Maley F., Pedersen-Lane, J., and Changchien, L. 1995. Complete restoration of activity to inactive mutants of Escherichia coli thymidylate synthase: Evidence that E. coli thymidylate synthase is a half-the-sites activity enzyme. Biochemistry 34: 1469–1474. [DOI] [PubMed] [Google Scholar]
- Mohsen A.-W.A., Aull, J.L., Payne, D.M., and Daron, H.H. 1995. Ligand-induced conformational changes of thymidylate synthase detected by limited proteolysis. Biochemistry 34: 1669–1677. [DOI] [PubMed] [Google Scholar]
- Montfort W.R., Perry, K.M., Fauman, E.B., Finer-Moore, J.S., Maley, G.F., Hardy, L., Maley, F., and Stroud, R.M. 1990. Structure, multiple site binding, and segmental accommodation in thymidylate synthase on binding dUMP and anti-folate. Biochemistry 29: 6964–6977. [DOI] [PubMed] [Google Scholar]
- Palmer A.G. 2004. NMR characterization of the dynamics of biomacromolecules. Chem. Rev. 104: 3623–3640. [DOI] [PubMed] [Google Scholar]
- Pedersen-Lane J., Maley, G.F., Chu, E., and Maley, F. 1997. High-level expression of human thymidylate synthase. Protein Expr. Purif. 10: 256–262. [DOI] [PubMed] [Google Scholar]
- Roberts S.A., Hyatt, D.C., Honts, J.E., Changchien, L., Maley, G.F., Maley, F., and Montfort, W.R. 2006. The structure of the Y94F mutant of E. coli thymidylate synthase. Acta Crystallogr. D Biol. Crystallogr. 62: 840–843. [DOI] [PMC free article] [PubMed] [Google Scholar]
- Saxl R.L., Changchien, L.-M., Hardy, L.W., and Maley, F. 2001. Parameters affecting the restoration of activity to inactive mutants of thymidylate synthase via subunit exchange: Further evidence that thymidylate synthase is a half-of-the-sites activity enzyme. Biochemistry 40: 5275–5282. [DOI] [PubMed] [Google Scholar]
- Saxl R.L., Reston, J., Nie, Z., Kalman, T.I., and Maley, F. 2003. Modification of Escherichia coli thymidylate synthase at tyrosine-94 by 5-imidazolylpropynyl-2′-deoxyridine 5′-monophosphate. Biochemistry 42: 4544–4551. [DOI] [PubMed] [Google Scholar]
- Schuck P. 2000. Size distribution analysis of macromolecules by sedimentation velocity ultracentrifugation and Lamm equation modeling. Biophys. J. 78: 1606–1619. [DOI] [PMC free article] [PubMed] [Google Scholar]
- Spencer T., Villafranca, J.E., and Appleman, J.R. 1997. Kinetic scheme for thymidylate synthase from Escherichia coli: Determination from measurements of ligand binding, primary and secondary isotope effects, and pre-steady state catalysis. Biochemistry 36: 4212–4222. [DOI] [PubMed] [Google Scholar]
- Strop P., Changchien, L.-M., Maley, F., and Montfort, W.R. 1997. Crystal structures of a marginally active thymidylate synthase mutant, Arg126 → Glu. Protein Sci. 6: 2504–2511. [DOI] [PMC free article] [PubMed] [Google Scholar]
- Volkov A.N., Worrall, J.A.R., Holtzmann, E., and Ubbink, M. 2006. Solution structure and dynamics of the complex between cytochrome c peroxidae determined by paramagnetic NMR. Proc. Natl. Acad. Sci. 103: 18945–18950. [DOI] [PMC free article] [PubMed] [Google Scholar]
- Wahba A.J. and Friedkin, M. 1961. Direct spectrophotometric evidence for the oxidation of tetrahydrofolate during the enzymatic synthesis of thymidylate. J. Biol. Chem. 236: 11–12. [PubMed] [Google Scholar]
- West D.K., Porter, D.C., Saxl, R.L., and Maley, F. 2004. A Trojan horse approach for silencing thymidylate synthase. Biochemistry 43: 9177–9189. [DOI] [PubMed] [Google Scholar]