

Abstract
Functionally distinct subsets of hippocampal inhibitory neurons exhibit large differences in the frequency, pattern and short-term plasticity of GABA release from their terminals. Heterogeneity is also evident in the ultrastructural features of GABAergic axon terminals examined in the electron microscope, but it is not known if or how this corresponds to interneuron subtypes. We investigated the feasibility of separating morphologically distinct clusters of terminal types, using the approach of measuring several ultrastructural parameters of GABAergic terminals in the CA1 area of the rat hippocampus. Septo-hippocampal axon terminals were anterogradely labeled by biotinylated dextran amine and visualized by preembedding immunogold staining to delineate one homogeneous terminal population. Long series (100-150) of ultrathin sections were cut from stratum oriens and stratum radiatum of the CA1 area, and GABAergic terminals were identified by post-embedding immunogold staining. Stereologically unbiased samples of the total GABAergic axon terminal population and a random sample of the septal axon terminals were reconstructed in 3D, and several of their parameters were measured (e.g. bouton volume, synapse surface, volume occupied by vesicles, mitochondria volume).
Septal terminals demonstrated significantly larger mean values for most parameters than the total population of local GABAergic terminals. There was no significant difference between terminals reconstructed in the basal and apical dendritic regions of pyramidal cells, neither for the septal nor for the local population.
Importantly, almost all parameters were highly correlated, precluding the possibility of clustering the local terminals into non-overlapping subsets. Factor and cluster analysis confirmed these findings. Our results suggest that similarly to excitatory terminals, inhibitory terminals follow an “ultrastructural size principle”, and that the terminals of different interneuron subtypes cannot be distinguished by ultrastructure alone.
Keywords: interneuron, electron microscopy, 3D reconstruction, factor analysis, cluster analysis
Morphologically, physiologically and neurochemically different subsets of inhibitory cells have been described in the hippocampus (Freund and Buzsaki, 1996; Somogyi and Klausberger, 2005). During different behavior-associated EEG states, such as theta, non-theta and sharp waves (Bland, 1986; Buzsaki, 2002) and high-frequency oscillations associated with these states (gamma, 40-100Hz, (Bragin et al., 1995; Csicsvari et al., 2003); fast ripple oscillations, 150-200Hz, (Ylinen et al., 1995) these cell types show robustly different firing frequencies and patterns (Klausberger et al., 2003; Klausberger et al., 2005). It has been shown in vitro that different inhibitory cell types show differences in transmitter release timing and short-term release plasticity (Hefft and Jonas, 2005; Glickfeld and Scanziani, 2006), and by innervating different domains of the target principal cells they implement different functions (Miles et al., 1996). Both in vivo and in vitro, the most active neurons are the parvalbumin (PV) containing basket and axo-axonic cells (Pawelzik et al., 2002; Klausberger et al., 2003). Other cell types, such as different dendrite targeting cells, have lower firing probability during most in vivo states and in in vitro preparations (Csicsvari et al., 1999; Hajos et al., 2004; Losonczy et al., 2004).
In a series of previous studies (Gulyas et al., 1999; Megias et al., 2001; Matyas et al., 2004) we have described the convergence and distribution of excitatory and inhibitory synaptic inputs onto CA1 area pyramidal cells and onto 4 subsets of previously identified, functionally distinct inhibitory cell populations. Substantial differences have been demonstrated in the total number of excitatory inputs and the ratio of inhibitory inputs onto different cells. During electron microscopical sampling of the inhibitory inputs we noticed that the structure of the converging inhibitory terminals was heterogeneous with regard to several parameters, including volume, synaptic specialization size, vesicle number and density. As referred to above, subsets of inhibitory neuron populations show different transmitter release frequencies, patterns and short-term plasticity. We hypothesized that these differences might be manifested in the ultrastructure of the axon terminals, and could be used to identify the source of inhibitory inputs converging to a neuron from functionally different inhibitory cells.
Here we tested the feasibility of such an approach. We measured several morphological parameters of inhibitory terminals in different layers of the CA1 area. By measuring multiple parameters, the clustering of terminals into morphologically different subsets might be easier and more robust. As an internal control to the study we measured the terminal parameters of anterogradely labeled GABAergic septo-hippocampal fibers, a characteristic population of GABAergic terminals that can be easily and selectively labeled by anterograde tracers, such as biotinylated dextran amine (BDA), injected into the medial septum.
Experimental procedures
Handling, surgery and perfusion of animals
Experiments were carried out according to the guidelines of the Institutional Ethical Code and the Hungarian Act of Animal Care and Experimentation (1998. XXVIII. Section 243/1998.), which is in full agreement with the regulation of animal experiments in the European Union. All efforts were made to minimize pain and suffering and to reduce the number of animals used.
Firstly, the septo-hippocampal pathway was anterogradely labeled by biotinylated dextran amine (BDA 10kD, Molecular Probes, Eugene, USA), which was pressure-injected into the medial septum of 3 young adult male rats (Wistar, 3 months old, 300g) using a stereotaxic equipment, under anesthesia (chlornembutal 0.3 ml/100 g). Injections of 250 μl BDA were made at 4 sites on each side of the midline at the following coordinates (AP: 0, 0.8 mm, relative to bregma; L: 0.3mm, left and right, at 6.7 and 7.3 mm deep from the pia mater).
One week post surgery, animals were perfused under anesthesia (chlornembutal 0.3 ml/100 g,), first with physiological saline (1 min), followed by 50ml of 2% paraformaldehyde (TAAB, UK) and 0.5% glutaraldehyde (TAAB, UK) in sodium acetate buffer (pH 6.0), and then by 350ml (1 hour) of 2% paraformaldehyde and 1% glutaraldehyde in sodium borate buffer, (pH 8.5). The brains were postfixed by leaving them in the skull overnight at 4°C before being removed and coronally sectioned into 60 μm slices using a Vibratome.
In order to calculate shrinkage of sections during processing, some sections were marked for future identification and their outlines were traced using a camera lucida prior to further treatment. The graticule scale lengths were recorded.
In order to increase the penetration of the reagents all sections were immersed in 0.1M Phosphate buffer (PB) containing 10% sucrose for 2 hours and then PB with 30% sucrose overnight prior to freeze-thawing 3 times over liquid nitrogen. Sections were then thoroughly washed with PB and then treated with 0.5% sodium borohydride (NaBH4; Sigma) in PB for 10 minutes.
Visualization of septo-hippocampal fibers
Because electron-dense precipitates typically used for cytochemistry, such as diaminobenzidine, greatly obscure fine ultrastructural details when viewed in the electron microscope, we visualized the BDA tracer with a silver-enhanced gold protocol. Firstly, BDA was detected by incubating the sections with elite ABC 1:300 (Vector laboratories, Burlingame, CA, U.S.A.) in Tris-Buffered Saline (TBS) for 2 hours. This step was followed by incubation with tyramide intensification solution (1:50 for 15 minutes; Tyramide Signal Amplification kit, Perkin-Elmer Life Sciences, Waltham, MA, U.S.A.), then a second incubation with elite ABC 1:300 in TBS for 2 hours, followed by 1nm streptavidin gold diluted 1:60 overnight at 4°C (British Biocell International, Cardiff, U.K.). The gold labeled antibody was fixed by treatment with 2% glutaraldehyde for 10 minutes and then enhanced with silver for 12 minutes at 20°C (R-Gent silver intensification kit; Aurion, Wageningen, The Netherlands). Slices were then osmicated, dehydrated in a graded alcohol series followed by propylene oxide, and flat embedded in Durcupan for electron microscopy.
Shrinkage correction
Following the visualization of BDA and Durcupan embedding, slices marked previously were re-examined and compared to tracings made prior to processing using the camera lucida. The drawing tube magnification was adjusted so that the tracing outlines prior to processing were super-imposed on the outline of the same section after dehydration. The adjusted projection image of the graticule scale was then traced using this same, corrected magnification. The graticule scale length after processing was divided by the graticule scale length prior to processing in order to calculate the dehydration shrinkage correction factor, which was 1.036 (i.e. shrinkage was 100% − (1/1.036) = 3.5%).
Ultrathin sectioning and post-embedding GABA immunostaining of sections
Different layers of hippocampal area CA1, containing labeled septo-hippocampal terminals were re-embedded from the flat-embedded slices. Long series (100-150) of ultrathin sections (60 nm) were cut and collected on nickel single slot grids for electron microscopy. To distinguish GABAergic and cholinergic septal axons, as well as to identify all GABAergic axon terminals, post-embedding immunogold staining was made against GABA using a protocol modified from Somogyi & Hodgson (1985). The steps were made on droplets of Millipore-filtered solutions in humid Petri dishes, as follows: 1% periodic acid (H5IO6) for 10 min; wash in double-distilled water for 3×3 min.; 2% sodium metaperiodate (NaIO4) for 10 min; wash as before; 3 min in TBS (pH=7.4); 30 min in 1% ovalbumin dissolved in TBS; two times for 10 min in TBS; 90 min in a rabbit anti-GABA antiserum (Hodgson et al., 1985), diluted 1:2000 in TBS with 1% NGS; two times for 10 min in TBS; 10 min in 0.05 M Tris buffer, pH=7.4 containing 1% BSA and 0.5% Tween 20; goat anti-rabbit IgG-coated colloidal gold (diluted in 1:20 in the same buffer; 15 nm; Amersham, Little Chalfont, U.K.) for 90 min; wash three times for 5 min in double-distilled water; saturated uranyl-acetate for 20 min; wash in four changes of double-distilled water; staining with lead citrate; and wash in distilled water. Profiles showing a density of colloidal gold particles at least 5× background level, in two or three adjacent sections were considered GABA-immunoreactive. Unless otherwise stated, all chemicals were purchased from Sigma (www.sigmaaldrich.com).
Stereological sampling
A stereologically unbiased sample of the total GABAergic axon terminal population was taken using a disector-based method (Sterio, 1984). Within each examined layer of CA1, an area was randomly selected and imaged at 9000x magnification using a CCD camera (Megaview II, analySIS image processing software, http://www.soft-imaging.net/) linked to a Hitachi 7100 electron microscope. The area was then scanned for the presence of post-embedding immunogold-labeled axon terminals with synapses. Terminals were marked on the digital image of the area. This process was repeated for the corresponding area on the next nine sequential sections to create a sampling volume.
GABAergic axon terminals with synapses present within the first section, or touching the exclusion edges (bottom and left) of the area in any section were excluded from the sampling volume, whereas profiles present in any of the other 9 scanned areas, or touching the top or right edges of each area, were included in the sampling volume (Figure 1A,B). This procedure randomly selects synaptic terminals regardless of their size. The included terminals with synapses were then imaged at high magnification (40,000 – 80,000x) in all sections where their profile was present. Other images at lower magnifications were also taken from some sections to aid alignment and the identification of postsynaptic targets. All digital images were scaled correctly according to microscope magnification at the time of acquisition, and this scale data was retained as an inherent part of the Tagged Image File Format (TIFF). Septal axon terminals were randomly selected in the light microscope for re-embedding, and serial sections through these terminals were then cut. They were examined in the electron microscope for co-localization of BDA- and GABA-labeling. Dual labeled terminals that established synapses were then imaged at high magnification, as above.
Figure 1.

Sampling and reconstruction of axon terminals. Panel A: Serial sections with super-imposed rectangular sampling areas indicating inclusion (white) and exclusion (black) boundary lines. Panel B: Ten rectangular areas were used to create a physical 3-D disector volume to sample terminals (dark shape on right). The tenth area was used as an exclusion plane for terminals not completely within the sample boundary (light shape bisected by plane, on left). Panels C and D: Representative electron micrographs of a Septal and a Local terminal, respectively. t - terminal, d - dendrite, * - adjacent, non-GABA-IR profile. Note the presence of GABA neurotransmitter labeled by small (10nm) gold particles in both terminals (C and D), but that only the Septal terminal (C) also contains anterograde tracer labeled by large, silver-enhanced gold particles. Panel E: 3-D reconstructions of the same Septal (left) and Local (right) profiles shown in C and D at the same scale for visual comparison. Scale bars in both panels are 500nm in 100nm black/white divisions. Black shaded areas on each reconstruction indicate synaptic contact areas. Panel F: As Panel E except terminals are rotated about their vertical axis and the axonal membrane is partially transparent to allow the clustered vesicles (light grey) and the mitochondria (mid grey) to be seen in relation to the synaptic active zone (black). Scalebars: 200nm in C and D, and 500nm in E and F.
Image acquisition and sectioning-compression correction
Images of serially sectioned axon terminals were imported into the analySIS 3-D reconstruction software (http://www.soft-imaging.net/), forming an image stack that was then aligned manually. Alignment was aided by using several additional lower power magnification images (15,000x) at regular intervals in the stack that were matched with the high magnification images. The ultramicrotome cutting thickness of the sections (60nm) was used to define the distance between the sections (Z axis).
Ultramicrotome sectioning compresses sections perpendicularly to the edge of the knife as they are cut, which distorts the shape and hence the calculated parameters of reconstructed terminals. This compression was corrected for by comparing scaled low-power electron micrographs of the sections and scaled camera lucida images of the block from which the sections had been cut, and dividing the former by the latter to obtain a correction ratio. This ratio was used to de-compress the digital images used for 3-dimensional reconstruction in the same direction that the sections had been compressed in during sectioning.
3-dimensional reconstructions and measurements
Profiles in each 2-dimensional section (image) within a stack were manually traced and used to create a 3-dimensional object. The object volume and surface area were then measured using a function within the reconstruction software. The calculated volume and surface area of each object were then corrected for the shrinkage that occurred during dehydration by applying the appropriate shrinkage correction factor (see above). In each stack, the process of tracing and linking to form a 3-dimensional object was performed for several different parameters, and the volume and surface area of each object was then measured by the software.
Each axon bouton was reconstructed in order to measure the volume and surface areas (Tvol and Tsurf). This was done in such a way that it did not include intervaricose axon segments: at the points where the bouton clearly became intervaricose axon, it was smoothly truncated to preserve the general curvature of the bouton. In order to measure possible morphological correlates of synaptic efficacy, the area of synaptic active zones adjacent to the postsynaptic specialization were reconstructed as a 2-dimensional surface adjacent to the presynaptic release face (Sarea). Because individual vesicles could not be accurately reconstructed or represented, terminal vesicle content was analyzed by two separately reconstructed objects. The first traced around the profiles of tightly packed vesicles that made membrane contact with each other, and was termed “clustered vesicles” (VVD). These were often close to the active zone. The second traced around the profiles of all the vesicles within a terminal, including individual vesicles, tightly packed clusters or loose groups not in direct membrane contact with each other that were separate from the main cluster, thus measuring total vesicle content (VVA). Mitochondria within terminals were deemed important because they generate the energy required for ATP-dependent mechanisms and act as Ca2+ buffers/sinks. When present, their number was recorded (Mnum) and they were reconstructed to calculate total volume and surface area (Mvol and Msurf). The number of separate synaptic targets (Starg) and the number of separate active zones (AZ) were also counted for each terminal. In addition, the diameter of the postsynaptic target perpendicular to the synapse was examined in the serial sections, and was measured for each postsynaptic target (Tdia).
Statistical analysis
All analyses (correlations, distribution normality, ANOVA, Factor analysis, unsupervised clustering) were performed using Statistica software (StatSoft, Inc. (2004), version 6; www.statsoft.com).
Results
Large, stereotaxic injections were made that resulted in anterograde tracer being taken up by cells within the central area of the medial septum / diagonal band, but not by cells outside of this area. The injections produced axon labeling in all areas of the hippocampus. The distribution pattern of labeled fibers was similar to that observed previously (Freund & Antal, 1988), with both small and large caliber fibers present in the hilus of the dentate gyrus, all layers of the CA3 region, and to a lesser extent of CA1. Small diameter axon collaterals and en passant terminals that contained the anterograde tracer BDA but were not immunoreactive for GABA when tested subsequently by preembedding immunogold staining in the electron microscope were presumed to be septal cholinergic fibers (not shown). These were less numerous than the septal GABAergic terminals, which were immunoreactive for both anterograde tracer and GABA, and were usually larger (Figure 1C). However, both of these terminal types were substantially less common than axon terminals immunoreactive for GABA but not labeled anterogradely (Figure 1D).
Randomly selected, BDA-labeled, GABA-positive septal axon terminals as well as a systematic sample of BDA-negative GABA-positive terminals, most of which are likely local in origin and will be subsequently referred to as “local” terminals, were reconstructed at the electron microscopic level using a physical disector protocol (Figure 1A,B and Methods) and the ANALYsis 3D reconstruction software (Figure 1E+F). Samples were taken from three regions of hippocampal CA1 area: SO - stratum oriens, SRI - the inner half of stratum radiatum and SRO -the outer half of stratum radiatum including stratum lacunosum-moleculare. These distinctions were made for two reasons: 1) inhibitory neurons terminating onto different domains of principal cells have been demonstrated to show different EEG-associated firing patterns in vivo (Klausberger et al., 2003; Klausberger et al., 2005) and recordings from interneurons of different strata were shown to possess different transmission dynamics in vitro (Poncer et al., 2000), 2) an earlier study (Kubota and Kawaguchi, 2000) suggested a correlation between the size of an axon terminal and the diameter of its target dendrite (i.e. its proximal or distal location). Stratum pyramidale axon terminals were not sampled for two reasons: 1) it has been shown that perisomatic boutons are larger than dendritic terminals (Gulyas et al., 1993), 2) relatively few BDA-labeled septo-hippocampal fibers are present in stratum pyramidale.
A total of 89 GABAergic terminals were reconstructed, 25 septal and 64 local (Table 1). A number of functionally relevant morphological parameters were quantitatively analyzed; the volume of the terminal (Tvol), the total synaptic surface area of the terminal (Sarea), the volume of the terminal occupied by densely-packed vesicles (VVD), the volume of the terminal occupied by all vesicles (VVA), the volume of all mitochondria within the terminal (Mvol), the number of mitochondria (Mnum), the number of separate synaptic targets contacted by the terminal (Starg), the number of separate active zones formed by the terminal (AZ), the number of dense-core vesicles within the terminal (DCV) and the diameter of the profiles contacted by the terminal (Tdia). The reconstructed parameters are listed in Table 2.
Table 1.
Sample distribution. Number of sampled and 3D-reconstructed terminals organized by origin and region of hippocampal area CA1. SRO - outer half of stratum radiatum and stratum lacunosum moleculare, SRI - inner half of stratum radiatum, SO - stratum oriens.
| Septal | Local | All | |
|---|---|---|---|
| SRO | 10 | 21 | 31 |
| SRI | 9 | 25 | 34 |
| SO | 6 | 18 | 24 |
| All | 25 | 64 | 89 |
Table 2.
List of measured parameters, with abbreviations used. 1-5 were used for quantitative analysis.
| 1 | Volume of terminal (μm3) | Tvol |
| 2 | Synapse surface area (μm2) | Sarea |
| 3 | Volume occupied by densely packed vesicles (μm3) | VVD |
| 4 | Volume occupied by all vesicles (μm3) | VVA |
| 5 | Volume of mitochondria (μm3) | Mvol |
| 6 | Number of mitochondria | Mnum |
| 7 | Number of separate synaptic targets | Starg |
| 8 | Number of separate active zones | AZ |
| 9 | Number of dense core vesicles | DCV |
| 10 | Diameter of synaptic target (μm) | Tdia |
Septo-hippocampal and local GABAergic terminals are morphologically different
Septo-hippocampal GABAergic terminals were generally larger when observed in the electron microscope (x-y dimensions) and were contained within more serial sections (larger z-axis) than local GABAergic terminals. The mean terminal volume (Tvol) of septal GABAergic terminals was 0,71 +/- 0,43 μm3, whereas the mean Tvol of local GABAergic terminals was 0,18 +/- 0,13 μm3. This general feature was apparent for most of the parameters measured (Table 3), including the mean synaptic surface area (Sarea), the mean mitochondrial volume (Mvol) and the mean postsynaptic target diameter (Tdia). This latter observation might be due to the fact that while local terminals innervated mostly pyramidal cell shafts, septal terminals primarily innervated proximal GABAergic dendrites and somata. A notable exception was the mean number of postsynaptic profiles (Starg), which had a value of 1 for all of the septal terminals reconstructed, but varied somewhat for local terminals. The mean number of active zones (AZ) for septal terminals was larger than 1, whereas the value for local terminals was similar to the Starg value. To summarize, septal terminals usually contacted a single target (96%, 24/25 terminals), often with multiple active zones (36%, 9/25 terminals), whereas local terminals contacted their target(s) with only a single active zone (95%, 61/64 terminals), with multiple active zones indicating multiple targets (19%, 12/64 terminals). It is also important to note that in the local terminal population we found only a small amount of terminals in the size range of the septal population (4 out of 64 unlabeled terminals, 6%). This suggests that the contribution of the septo-hippocampal terminals to the total GABAergic terminal population is rather small.
Table 3.
Measured parameter data. Mean and Standard Deviation of parameters that were measured directly from the reconstructions for Septal only, Local only and All terminals combined. Note that for parameters labeled *, there is a significant (p<0.05) difference between Septal and Local - see also Table 4.
| Septal | Local | All | |
|---|---|---|---|
| Tvol* | 0.71 +/- 0.43 | 0.18 +/- 0.13 | 0.33 +/- 0.35 |
| Sarea* | 0.123 +/- 0.081 | 0.078 +/- 0.047 | 0.091 +/- 0.061 |
| VVD* | 0.0137 +/- 0.0180 | 0.0018 +/- 0.0018 | 0.0051 +/- 0.0109 |
| VVA* | 0.360 +/- 0.241 | 0.090 +/- 0.078 | 0.166 +/- 0.187 |
| Mvol* | 0.130 +/- 0.097 | 0.036 +/- 0.040 | 0.062 +/- 0.074 |
| Mnum | 2.6 +/- 1.6 | 0.9 +/- 0.6 | 1.4 +/- 1.2 |
| Starg | 1.0 +/- 0.2 | 1.2 +/- 0.5 | 1.2 +/- 0.5 |
| AZ | 1.6 +/- 1.3 | 1.3 +/- 0.5 | 1.4 +/- 0.8 |
| DCV | 2.9 +/- 2.8 | 1.1 +/- 1.7 | 1.6 +/- 2.2 |
| Tdia | 2.6 +/- 4.3 | 0.8 +/- 0.3 | 1.3 +/- 2.4 |
The apparent differences between septal and local terminals observed qualitatively from the 3-d reconstructions (Figure 1) and quantitatively from the data (Table 3, Figures 2 and 3) were compared using a Kruskall-Wallis ANOVA. A significant (p<0.05) difference was found between terminal type, but not between layers, for most of the parameters, including all of those listed in Table 4. This indicated that the type of terminal alone accounted for the variance in the data, and the effect of layer was negligible. Thus all local terminals were of comparable size, irrespective of their location in the hippocampal strata. This was also the case for septal terminals. In addition, no significant interaction between type and layer was observed, indicating that septal GABAergic terminals were significantly larger than their local counterparts, irrespective of stratum.
Figure 2.

Measured parameters are highly variable and overlapping. Raw data distributions of the first five parameters, for Septal (open diamonds) and Local (open triangles) terminals, with means indicated by thick horizontal bars. Error bars indicate standard deviation. Note that although the data points overlap to some extent, Septal is significantly (p<0.05) different from Local in all cases - see Table 4.
Figure 3.
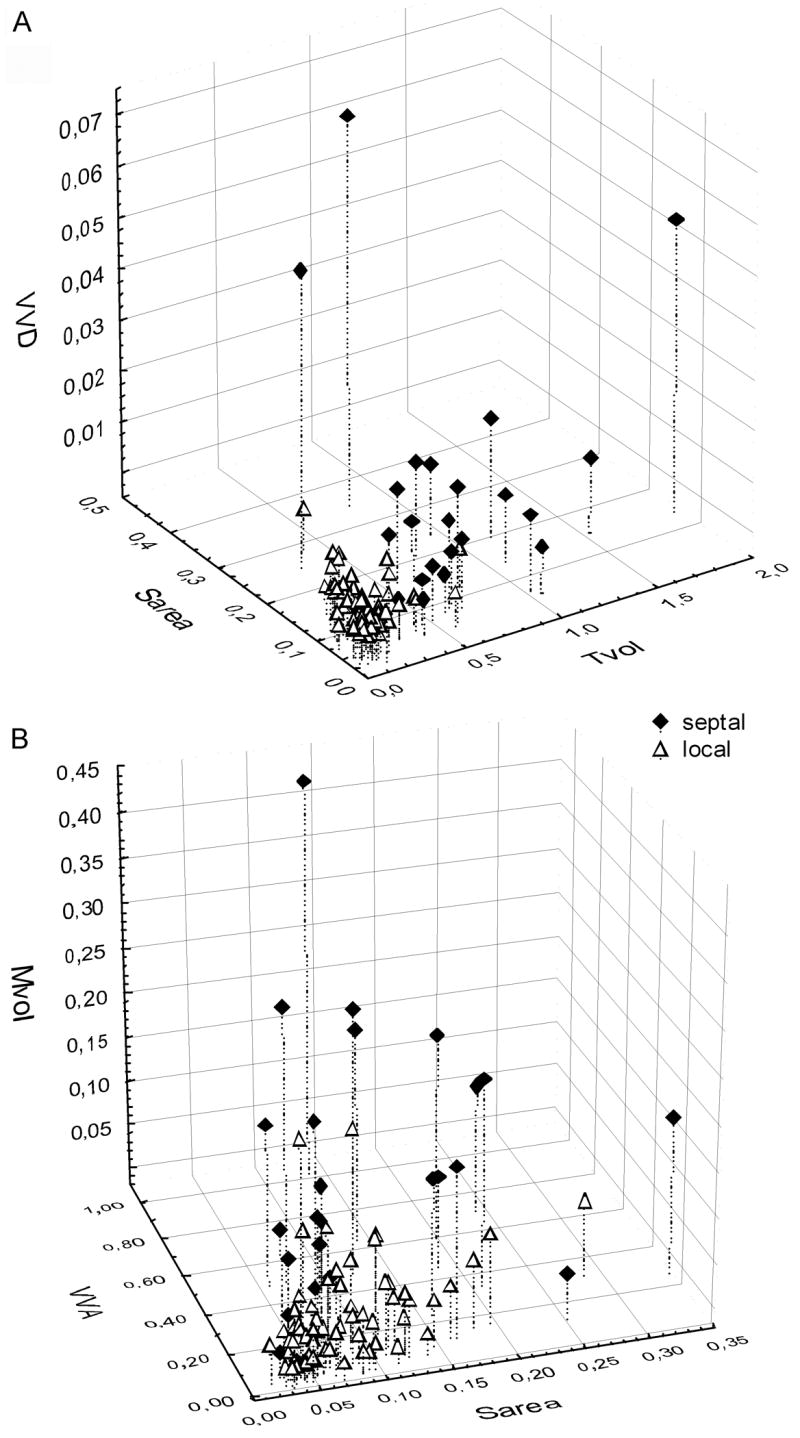
3-dimensional plots of raw data to demonstrate that parameters are highly correlated with one another. A) Tvol, Sarea and VVD B) Sarea, VVA and Mvol. Values for Septal (filled diamonds) and Local (open triangles) are indicated separately. Note that most Local terminals form a dense cluster in both plots, but the majority of Septal terminals lie outside the cluster.
Table 4.
Kruskal-Wallis non-parametric ANOVA results indicating a significant (p<0.05) difference between type but not layer for the five most important parameters.
| Type | Layer | |
|---|---|---|
| Tvol | p < 0.001 | p = 0.071 |
| Sarea | p = 0.016 | p = 0.620 |
| VVD | p < 0.001 | p = 0.115 |
| VVA | p < 0.001 | p = 0.110 |
| Mvol | p < 0.001 | p = 0.113 |
Several other noteworthy points should be made regarding the data in Table 3. 1) The number of mitochondria (Mnum) was larger for septal terminals, indicating that these terminals always contained at least one mitochondrion. In addition, septal terminal mitochondria could possess a complex, sometimes branched 3-dimensional form, rather than a classical “sausage” or “kidney-bean” shape. 2) The number of dense-core vesicles (DCV) was larger for septal terminals. 3) Target diameter was larger for septal terminals, suggesting that they target more proximal dendrites. Of further interest, puncta adherentia were also observed between many septal terminals and their postsynaptic targets, but only very rarely between a local terminal and its target. However, their presence in septal terminals was not consistent, and they were not analyzed further here (data not shown).
Morphological parameters of GABAergic terminals are highly inter-related
Parameters considered the most functionally relevant (Tvol, Sarea, VVD, VVA and Mvol) were examined further, and the raw data values, mean and standard deviations are plotted in Figure 2. Minimal overlap was observed among the individual data points of the septal and local group in the case of these five parameters. For most variables, several smaller values were seen in the septal group, and a few larger values were seen in the local group. Data were also examined using three-dimensional plots (Figure 3) to visualize the relationships between different parameters for individuals in each population of terminals. Our intention was that by plotting several measured parameters, distinct clusters of local terminals might be revealed, which might belong to distinct GABAergic cell populations. As can be seen in Figure 3, there was a strong inter-relationship between all parameters measured for each terminal, such that, for example, a terminal with a large Tvol value had correspondingly large values for all other parameters. The plot of datapoints in Figure 3 also demonstrate that most of the local terminal datapoints form a compact cluster. The only separation we found was between the septal and local terminals, which did not show a substantial overlap.
Data were tested for normality and showed a non-normal distribution (Shapiro-Wilk test significant for all parameters, p<0.001), with high skewness and kurtosis that were clearly different from zero (at least 1.75 for skewness and at least 4 for Kurtosis). Levene's test for homogeneity of variances was also significant for all parameters (p<0.01), requiring further analysis with non-parametric statistics. Spearman rank order correlations were performed to investigate the extent of the visually observed inter-relationships between the parameters. Results indicated that almost all aspects of the terminals were significantly correlated with each other (p<0.05, Table 5), with only a few exceptions. This was also true when data were analyzed as just septal, just local or all together, further indicating the highly inter-related nature of the parameters for any given inhibitory terminal, either septal or local.
Table 5.
Spearman Rank Order correlations between the first 5 parameters. Symbols represent significant (p < 0.05) correlations. Septal only (open diamond), Local only (open triangle), All (filled circle). X denotes a non-significant correlation.
| Tvol | Sarea | VVD | VVA | Mvol | |
|---|---|---|---|---|---|
| Tvol | |||||
| Sarea | ◊ Δ ● | ||||
| VVD | ◊ Δ ● | ◊ Δ ● | |||
| VVA | ◊ Δ ● | ◊ Δ ● | ◊ X X | ||
| Mvol | ◊ Δ ● | ◊ Δ ● | ◊ Δ X | ◊ Δ ● |
The large number of correlations between almost all structures suggested that parameters co-varied to a considerable extent, but this analysis did not reveal much information about the underlying organizational principles of the terminals. Principal components analysis was therefore used to define the relationships between parameters of different ultrastructural components. Two factors were extracted with Eigenvalues greater than 1, for the total dataset, and for datasets containing just septal and just local terminals, and these are plotted in Figure 4. Generally, two main parameter groupings were seen in all datasets, the first incorporating Tvol, Mvol and VVA, in most cases within close proximity to one another, and a second more diffuse grouping of Sarea and VVD was also apparent.
Figure 4.

Factor analysis by Principal components, using Varimax raw rotation. Plot of Factor 1 loadings against Factor 2 loadings for the five most important parameters. The Factors are shown for Septal only (open diamonds) and Local only (open triangles) and for All cases (filled circles). Shaded areas indicate the two main groupings of parameters.
Similarly, unsupervised joining cluster analysis was used to determine if there were any patterns in the relationships between the parameters, and the plots are shown in Figure 5. Similar to the factor loading plots (Figure 4), the most closely linked parameters were Tvol, VVA and Mvol. Also, these parameters had a similar cluster tree when analyzed for just septal, just local or all terminals (grey boxes in Figure 5).
Figure 5.

Functionally related parameters are clustered together. Icicle plots of agglomerative clustering for the first five parameters, using Ward's method. Linkage distances are Euclidean, expressed as a percentage of maximum. Shaded areas indicate similar clustering of parameters. Note the similar clustering of functionally related parameters, particularly Tvol, VVA and Mvol, which share the same clustering structure in all three clustering plots.
Terminal types cannot be subdivided on the basis of ultrastructure
Individual cases (terminals) were also subjected to cluster analysis, but as predicted from the raw data distributions, no evident grouping was observed. In all cases, terminals were essentially clustered in terms of their overall size, and not even septal vs. local types were completely segregated into separate clusters (data not shown).
Discussion
In this study we have examined the ultrastructural characteristics of GABAergic axon terminals in area CA1 of the hippocampal region and drawn two main conclusions. Firstly, GABA-immunoreactive terminals arising from the medial septum show significantly larger values for many of the parameters we measured than GABA-immunoreactive terminals of local inhibitory neurons, and also express some characteristic features. Secondly, most of the terminal parameters, for both septal and local terminals, were highly correlated, such that terminals with either small, average or large values for one parameter would also have small, average or large values, respectively, for most of the other parameters we measured. The broad range of the data confirms that the ultrastructural size principle demonstrated in the case of excitatory terminals in the hippocampus (Pierce and Lewin, 1994) also applies to hippocampal GABAergic terminals, irrespective of their origin. Due to these scaling relationships, our data also indicate that the terminals of different interneuron types cannot be distinguished from each other on the basis of their ultrastructural features, even if several parameters are measured concurrently. Interestingly, principal component and cluster analysis revealed grouping among terminal parameters, possibly revealing functional couplings.
Septal terminal structure suggests repetitive and reliable transmission
Septal terminals were significantly larger in all aspects than their local counterparts. This was evident from the reconstruction images (Figure 1) and the mean value for many measured parameters (Tables 4 and 3). As was previously reported (Freund & Antal, 1988), labeled septal terminals in this study also selectively contacted interneurons in the hippocampus. Interestingly, septal terminals almost always (96%) contacted a single postsynaptic target, and often possessed more than one active zone (36%).
In the cerebellum, GABAA receptor density in the postsynaptic specialization is constant, thus, receptor number and therefore quantal amplitude of the synaptic event is proportional to the surface of the synaptic specialization (Nusser et al., 1997; Nusser et al., 1998). Our data indicate that large terminals have large synaptic surface area and a large vesicle pool. The large volume occupied by vesicles and the presence of multiple release sites suggest reliable transmission and large inhibitory events for the septal terminals; indeed, regular and rhythmic activity of medial septum GABAergic neurons has been demonstrated (Ford et al., 1989; Serafin et al., 1996; Sotty et al., 2003). The presence of a large amount of vesicles may also indicate ability for sustained, high frequency release. This is likely because septo-hippocampal GABAergic cells contain parvalbumin (Freund, 1989) and have been shown to fire high frequency bursts reliably and rhythmically at theta interburst frequencies both in vivo (Borhegyi et al., 2004; Simon et al., 2006) and in vitro (Morris et al., 1999). Transmitter release at multiple release sites is considered to be independent, with similar probability (Katz, 1969), thus the presence of multiple release sites makes transmission more reliable (Taschenberger et al., 2002). In addition, transmitter diffusion among release sites within a bouton also extends the decay time of IPSCs (Telgkamp et al., 2004) and thus increases charge transfer.
Additionally, septal terminals targeted large diameter, proximal dendritic trunks and somata of GABAergic neurons, as observed previously (Freund and Antal, 1988; Gulyas et al., 1990). By terminating in the perisomatic region they exert potent inhibition close to the site of action potential generation (Toth et al., 1997). The potential for reliable, repetitive multiquantal release on the proximal dendritic/somatic domain of target neurons indicates that septal inputs are likely to exert a strong influence on the firing of hippocampal interneurons. Multiple terminals in the perisomatic region might be required for the control of inhibitory neurons, due to differences in the amount and types of chloride channels and transporters. Also, the reversal potential of chloride in inhibitory neurons is more depolarized than in principal cells, and so GABA-induced inhibition has a shunting rather than a hyperpolarizing effect in these cells (Banke and McBain, 2006). In order to be effective, shunting inhibition requires a higher conductance, which is most probably implemented through multiple release sites with large active zones. Large terminals with multiple release sites have also been observed in PV-IR GABAergic fast-bursting neurons of the anterior pretectum, which are also long-range projection neurons that terminate predominantly onto proximal dendrites (Bokor et al., 2005).
Ultrastructural size principle applies to inhibitory terminals and precludes their division into subtypes
A general feature of all terminals examined was the presence of strong correlations between many of the investigated parameters (Table 4). Thus we propose that inhibitory terminals, like excitatory terminals, follow an ‘ultrastructural size principle’ (Pierce and Lewin, 1994), such that all parameters scale with respect to each other, and predictions of ultrastructural parameters can be made from one another quantitatively, if the population mean and variance for each parameter is known (as shown by PCA, Figure 4).
Initially, we measured many different ultrastructural parameters, as we did not know which ones might be distinctive among terminal groups. Ratios were also derived from many of the measured parameters, e.g. Tvol to Mvol, but these ratios were seldom more informative than the parameters that they were derived from. Finally, we did restrict our investigation to parameters that could be considered as having functional relevance. For example, total volume occupied by synaptic vesicles, synaptic surface area and mitochondrial volume could all be considered as important for sustainability of transmitter release, the amount of neurotransmitter released by a terminal (multiquantal) and the local energy supply / calcium buffering capacity of a terminal, respectively. Indeed, as discussed below, clustering of the parameters suggested associations with different functions.
Although the local terminals were smaller than the septal ones, their measured parameters moved within a wide range. This might be because local terminals can arise from many different sources intrinsic to the hippocampus, as many different interneuron types have been characterized (Buhl et al., 1994; Freund and Buzsaki, 1996; Pawelzik et al., 2002; Somogyi and Klausberger, 2005). However, we could not subdivide the terminal populations on the basis of their morphological parameters, indicating that the variability of the strongly correlating terminal parameters within interneuron populations is comparable to the variability of all GABAergic local terminals, precluding the possibility of identifying terminals of different interneuron subtypes on the basis of their morphological parameters alone.
In agreement with this, a careful examination of the data presented in a recent publication (Biro et al., 2006) shows that the volume of CCK-immunoreactive hippocampal boutons parallels (and is probably correlated with) the sum of the active zone area in these terminals. This data also demonstrated that the range of CCK-immunoreactive terminal volumes was large, which matches with our data for the Local terminal population. Interestingly, some of these CCK-immuoreactive terminals contained more than one active zone, suggesting that the terminals had morphological characteristics that may allow them to repetitively and reliably release neurotransmitter, in a similar way to that discussed above concerning Septal terminals. Indeed, such morphological features of these terminals may be essential, as they function over a very large dynamic range, and can strongly inhibit their postsynaptic targets upon the suspension of endocannabinoid signalling (Losonczy et al., 2004).
As a consequence of the strong scaling relationships between correlated parameters, terminals did not fall into distinct (non-overlapping) clusters. This rejects our original proposal that the measurement of multiple ultrastructural parameters can be used to divide inhibitory terminals into sub-clusters that would match functionally distinct inhibitory cell terminals.
No apparent differences among terminals innervating different dendritic domains
We sampled three different strata of area CA1: stratum oriens, the inner half of stratum radiatum, and the outer half of stratum radiatum and stratum lacunosum-moleculare to address the issues of structural and functional specialization of inhibitory terminals in the CA1 area. Many different classes of anatomically characterized interneurons with non-overlapping axon-terminal arbors have been shown to have specific activity patterns and firing phase during different types of in vivo EEG activity (Klausberger et al., 2003; Klausberger et al., 2005). For excitatory synapses, correlations have been demonstrated between ultrastructural size and synaptic efficacy (Harris and Stevens, 1989; Mackenzie et al., 1999), and such relationships have also been shown for inhibitory terminals (Nusser et al., 1997). We found no evident differences in terminal ultrastructure among layers, suggesting that terminal morphology is not influenced by the specific activity patterns of individual inhibitory cell populations terminating in different layers.
The lack of difference in ultrastructural features suggests that the release pattern did not influence terminal morphology to an extent that could be detected by electron microscopical sampling. However it is still possible that each inhibitory neuron subtype may possess a population of terminals with a characteristic distribution of sizes that partially or completely overlap with that of other interneuron subtypes. Indeed, given the variability and diversity of interneurons between and even within subtypes, and the often multiple possible permutations of parameters (ultrastructural, ion channel expression etc.) that can be and are used to reach a particular phenotype, such a scenario would seem likely (Soltesz, 2005; Marder and Goaillard, 2006).
Terminal parameters cluster into functionally relevant subgroups
Because different parameters correlated with each other to differing degrees, principal component analysis was used to investigate the higher order nature of the data, by examining the inter-relationships between all measured parameters simultaneously. Terminals with parameters located near to each other in the multidimensional PCA parameter space can have potentially similar functional roles (Figure 4). Parameters Sarea and VVD were closely situated in one cluster, and both could be associated with the same functional feature. The size of active zone and the number of vesicles closely associated with the release site might influence the amount of released vesicles or the frequency of release (depending on which transmitter release models are taken into account, Richmond and Broadie, 2002; Fernandez-Peruchena, 2005 #4473, but see Gaffield et al., 2006). Similarly, the other cluster of parameters (Tvol, Mvol and VVA) might be associated with the vesicle pool available in the terminal for release. The interrelations of measured parameters were also examined by unsupervised clustering because it makes no a priori assumptions concerning the data clusters. This produced very similar patterns of parameter relationships (Figure 5), reinforcing the conclusion that the parameters are indeed related through their functional role.
Clustering of individual terminals was also attempted, but clustering was affected primarily by size and neither local nor septal terminals showed a clear pattern or structure. Furthermore, neither the two terminal types, nor terminals of each type sampled in different layers, fell into separate clusters. Although this meant that individual terminals could not be assigned to interneuron-subtype-specific categories, it did confirm that the ultrastructural size principle has a strong basis, and is generally applicable. Indeed, the septo-hippocampal terminals might also be expected to have at least two different structural types, as at least two different types of GABAergic cells with distinct firing patterns are present in the medial septum (Morris et al., 1999; Borhegyi et al., 2004), but no such division was evident.
In summary, by performing the first quantitative analysis of their ultrastructural parameters, we found a series of profound morphological differences between septal and local GABAergic terminals in the hippocampal CA1 region. Our results suggest that septal terminals exert more potent inhibition than local ones, irrespective of hippocampal layer, due to several specialized features (multiple release sites, larger synaptic surfaces, multiple contacts on proximal elements). We also revealed strong correlation among axon terminal parameters, thus eliminating the possibility of clustering synaptic boutons into functionally distinct categories based on morphological measurements. This lack of distinction indicates that the type and/or density of presynaptic ion channels (e.g. N vs. P/Q Ca2+ channels, Hefft and Jonas, 2005) and metabotropic receptors (Dalezios et al., 2002; Ferraguti et al., 2005; Hajos et al., 1998; Katona et al., 1999; Hajos et al., 2000; Kogo et al., 2004) expressed in the terminals might be more important contributors for tuning release properties than morphologically measurable parameters. Alternatively, release pattern is primarily influenced by the pattern of action potentials generated by the parent cell and not by terminal parameters.
Acknowledgments
We are grateful to Drs. N. Hájos, V. Varga and Zs. Borhegyi for comments on the manuscript, and to Mrs. K. Lengyel, Ms. K. Ivanyi and Mr. Gy. Goda for their excellent assistance. This work was supported by the EU Centre of Excellence grant, the Howard Hughes Medical Institute (USA), NIH (NS30549), Philip Morris External Research Program and OTKA (T46820 and K60927, Hungary).
Abbreviations
- AZ
Number of separate active zones within a terminal
- BDA
biotinylated dextran amine
- DCV
Number of dense core vesicles within a terminal
- GABA
Gamma-amino-butyric acid
- GABAergic
utilizes GABA as the main neurotransmitter
- Mnum
Number of mitochondria within a terminal
- Mvol
Volume of mitochondria within terminal
- Sarea
presynaptic surface area apposed to the postsynaptic density
- SO
stratum oriens
- SRI
stratum radiatum, inner half
- SRO
stratum radiatum, outer half, including stratum lacunosum-moleculare
- Starg
Number of separate profiles receiving synaptic input from the terminal
- Tdia
Diameter of synaptic target
- Tvol
Volume of terminal
- VVA
Volume occupied by all vesicles within terminal
- VVD
Volume occupied by densely packed vesicles within terminal
Footnotes
Publisher's Disclaimer: This is a PDF file of an unedited manuscript that has been accepted for publication. As a service to our customers we are providing this early version of the manuscript. The manuscript will undergo copyediting, typesetting, and review of the resulting proof before it is published in its final citable form. Please note that during the production process errors may be discovered which could affect the content, and all legal disclaimers that apply to the journal pertain.
References
- Banke TG, McBain CJ. GABAergic input onto CA3 hippocampal interneurons remains shunting throughout development. J Neurosci. 2006;26:11720–11725. doi: 10.1523/JNEUROSCI.2887-06.2006. [DOI] [PMC free article] [PubMed] [Google Scholar]
- Biro AA, Holderith NB, Nusser Z. Release probability-dependent scaling of the postsynaptic responses at single hippocampal GABAergic synapses. J Neurosci. 2006;26:12487–12496. doi: 10.1523/JNEUROSCI.3106-06.2006. [DOI] [PMC free article] [PubMed] [Google Scholar]
- Bland BH. The physiology and pharmacology of hippocampal formation theta rhythms. Progr Neurobiol. 1986;26:1–54. doi: 10.1016/0301-0082(86)90019-5. [DOI] [PubMed] [Google Scholar]
- Bokor H, Frere SG, Eyre MD, Slezia A, Ulbert I, Luthi A, Acsady L. Selective GABAergic control of higher-order thalamic relays. Neuron. 2005;45:929–940. doi: 10.1016/j.neuron.2005.01.048. [DOI] [PubMed] [Google Scholar]
- Borhegyi Z, Varga V, Szilagyi N, Fabo D, Freund TF. Phase segregation of medial septal GABAergic neurons during hippocampal theta activity. J Neurosci. 2004;24:8470–8479. doi: 10.1523/JNEUROSCI.1413-04.2004. [DOI] [PMC free article] [PubMed] [Google Scholar]
- Bragin A, Jando G, Nadasdy Z, Hetke J, Wise K, Buzsaki G. Gamma (40-100 Hz) oscillation in the hippocampus of the behaving rat. J Neurosci. 1995;15:47–60. doi: 10.1523/JNEUROSCI.15-01-00047.1995. [DOI] [PMC free article] [PubMed] [Google Scholar]
- Buhl EH, Halasy K, Somogyi P. Diverse sources of hippocampal unitary inhibitory postsynaptic potentials and the number of synaptic release sites. Nature. 1994;368:823–828. doi: 10.1038/368823a0. [DOI] [PubMed] [Google Scholar]
- Buzsaki G. Theta oscillations in the hippocampus. Neuron. 2002;33:325–340. doi: 10.1016/s0896-6273(02)00586-x. [DOI] [PubMed] [Google Scholar]
- Csicsvari J, Jamieson B, Wise KD, Buzsaki G. Mechanisms of gamma oscillations in the hippocampus of the behaving rat. Neuron. 2003;37:311–322. doi: 10.1016/s0896-6273(02)01169-8. [DOI] [PubMed] [Google Scholar]
- Csicsvari J, Hirase H, Czurko A, Mamiya A, Buzsaki G. Oscillatory coupling of hippocampal pyramidal cells and interneurons in the behaving Rat. J Neurosci. 1999;19:274–287. doi: 10.1523/JNEUROSCI.19-01-00274.1999. [DOI] [PMC free article] [PubMed] [Google Scholar]
- Dalezios Y, Lujan R, Shigemoto R, Roberts JD, Somogyi P. Enrichment of mGluR7a in the presynaptic active zones of GABAergic and non-GABAergic terminals on interneurons in the rat somatosensory cortex. Cereb Cortex. 2002;12:961–974. doi: 10.1093/cercor/12.9.961. [DOI] [PubMed] [Google Scholar]
- Ferraguti F, Klausberger T, Cobden P, Baude A, Roberts JD, Szucs P, Kinoshita A, Shigemoto R, Somogyi P, Dalezios Y. Metabotropic glutamate receptor 8-expressing nerve terminals target subsets of GABAergic neurons in the hippocampus. J Neurosci. 2005;25:10520–10536. doi: 10.1523/JNEUROSCI.2547-05.2005. [DOI] [PMC free article] [PubMed] [Google Scholar]
- Ford RD, Colom LV, Bland BH. The classification of medial septum-diagonal band cells as theta-on or theta-off in relation to hippocampal EEG states. Brain Res. 1989;493:269–282. doi: 10.1016/0006-8993(89)91162-1. [DOI] [PubMed] [Google Scholar]
- Freund TF. GABAergic septohippocampal neurons contain parvalbumin. Brain Res. 1989;478:375–381. doi: 10.1016/0006-8993(89)91520-5. [DOI] [PubMed] [Google Scholar]
- Freund TF, Antal M. GABA-containing neurons in the septum control inhibitory interneurons in the hippocampus. Nature. 1988;336:170–173. doi: 10.1038/336170a0. [DOI] [PubMed] [Google Scholar]
- Freund TF, Buzsaki G. Interneurons of the hippocampus. Hippocampus. 1996;6:345–470. doi: 10.1002/(SICI)1098-1063(1996)6:4<347::AID-HIPO1>3.0.CO;2-I. [DOI] [PubMed] [Google Scholar]
- Gaffield MA, Rizzoli SO, Betz WJ. Mobility of synaptic vesicles in different pools in resting and stimulated frog motor nerve terminals. Neuron. 2006;51:317–325. doi: 10.1016/j.neuron.2006.06.031. [DOI] [PubMed] [Google Scholar]
- Glickfeld LL, Scanziani M. Distinct timing in the activity of cannabinoid-sensitive and cannabinoid-insensitive basket cells. Nat Neurosci. 2006;9:807–815. doi: 10.1038/nn1688. [DOI] [PMC free article] [PubMed] [Google Scholar]
- Gulyas AI, Gorcs TJ, Freund TF. Innervation of different peptide-containing neurons in the hippocampus by GABAergic septal afferents. Neuroscience. 1990;37:31–44. doi: 10.1016/0306-4522(90)90189-b. [DOI] [PubMed] [Google Scholar]
- Gulyas AI, Miles R, Hájos N, Freund TF. Precision and variability in postsynaptic target selection of inhibitory cells in the hippocampal CA3 region. Eur J Neurosci. 1993;5:1729–1751. doi: 10.1111/j.1460-9568.1993.tb00240.x. [DOI] [PubMed] [Google Scholar]
- Gulyas AI, Megias M, Emri Z, Freund TF. Total number and ratio of excitatory and inhibitory synapses converging onto single interneurons of different types in the CA1 area of the rat hippocampus. J Neurosci. 1999;19:10082–10097. doi: 10.1523/JNEUROSCI.19-22-10082.1999. [DOI] [PMC free article] [PubMed] [Google Scholar]
- Hajos N, Papp EC, Acsady L, Levey AI, Freund TF. Distinct interneuron types express m2 muscarinic receptor immunoreactivity on their dendrites or axon terminals in the hippocampus. Neuroscience. 1998;82:355–376. doi: 10.1016/s0306-4522(97)00300-x. [DOI] [PubMed] [Google Scholar]
- Hajos N, Palhalmi J, Mann EO, Nemeth B, Paulsen O, Freund TF. Spike timing of distinct types of GABAergic interneuron during hippocampal gamma oscillations in vitro. J Neurosci. 2004;24:9127–9137. doi: 10.1523/JNEUROSCI.2113-04.2004. [DOI] [PMC free article] [PubMed] [Google Scholar]
- Hajos N, Katona I, Naiem SS, MacKie K, Ledent C, Mody I, Freund TF. Cannabinoids inhibit hippocampal GABAergic transmission and network oscillations. Eur J Neurosci. 2000;12:3239–3249. doi: 10.1046/j.1460-9568.2000.00217.x. [DOI] [PubMed] [Google Scholar]
- Harris KM, Stevens JK. Dendritic spines of CA 1 pyramidal cells in the rat hippocampus: serial electron microscopy with reference to their biophysical characteristics. J Neurosci. 1989;9:2982–2997. doi: 10.1523/JNEUROSCI.09-08-02982.1989. [DOI] [PMC free article] [PubMed] [Google Scholar]
- Hefft S, Jonas P. Asynchronous GABA release generates long-lasting inhibition at a hippocampal interneuron-principal neuron synapse. Nat Neurosci. 2005;8:1319–1328. doi: 10.1038/nn1542. [DOI] [PubMed] [Google Scholar]
- Hodgson AJ, Penke B, Erdei A, Chubb IV, Somogyi P. Antisera to γ-aminobutyric acid. I. Production and characterization using a new model system. J Histochem Cytochem. 1985;33:229–239. doi: 10.1177/33.3.3973378. [DOI] [PubMed] [Google Scholar]
- Katona I, Sperlagh B, Sik A, Kafalvi A, Vizi ES, Mackie K, Freund TF. Presynaptically located CB1 cannabinoid receptors regulate GABA release from axon terminals of specific hippocampal interneurons. J Neurosci. 1999;19:4544–4558. doi: 10.1523/JNEUROSCI.19-11-04544.1999. [DOI] [PMC free article] [PubMed] [Google Scholar]
- Katz B. The Release of Neural Transmitter Substances. Liverpool, UK: Liverpool University Press; 1969. [Google Scholar]
- Klausberger T, Magill PJ, Marton LF, Roberts JD, Cobden PM, Buzsaki G, Somogyi P. Brain-state- and cell-type-specific firing of hippocampal interneurons in vivo. Nature. 2003;421:844–848. doi: 10.1038/nature01374. [DOI] [PubMed] [Google Scholar]
- Klausberger T, Marton LF, O'Neill J, Huck JH, Dalezios Y, Fuentealba P, Suen WY, Papp E, Kaneko T, Watanabe M, Csicsvari J, Somogyi P. Complementary roles of cholecystokinin- and parvalbumin-expressing GABAergic neurons in hippocampal network oscillations. J Neurosci. 2005;25:9782–9793. doi: 10.1523/JNEUROSCI.3269-05.2005. [DOI] [PMC free article] [PubMed] [Google Scholar]
- Kogo N, Dalezios Y, Capogna M, Ferraguti F, Shigemoto R, Somogyi P. Depression of GABAergic input to identified hippocampal neurons by group III metabotropic glutamate receptors in the rat. Eur J Neurosci. 2004;19:2727–2740. doi: 10.1111/j.0953-816X.2004.03394.x. [DOI] [PubMed] [Google Scholar]
- Kubota Y, Kawaguchi Y. Dependence of GABAergic synaptic areas on the interneuron type and target size. J Neurosci. 2000;20:375–386. doi: 10.1523/JNEUROSCI.20-01-00375.2000. [DOI] [PMC free article] [PubMed] [Google Scholar]
- Losonczy A, Biro AA, Nusser Z. Persistently active cannabinoid receptors mute a subpopulation of hippocampal interneurons. Proc Natl Acad Sci U S A. 2004;101:1362–1367. doi: 10.1073/pnas.0304752101. [DOI] [PMC free article] [PubMed] [Google Scholar]
- Mackenzie PJ, Kenner GS, Prange O, Shayan H, Umemiya M, Murphy TH. Ultrastructural correlates of quantal synaptic function at single CNS synapses. J Neurosci. 1999;19:RC13. doi: 10.1523/JNEUROSCI.19-12-j0003.1999. [DOI] [PMC free article] [PubMed] [Google Scholar]
- Marder E, Goaillard JM. Variability, compensation and homeostasis in neuron and network function. Nat Rev Neurosci. 2006;7:563–574. doi: 10.1038/nrn1949. [DOI] [PubMed] [Google Scholar]
- Matyas F, Freund TF, Gulyas AI. Convergence of excitatory and inhibitory inputs onto CCK-containing basket cells in the CA1 area of the rat hippocampus. Eur J Neurosci. 2004;19:1243–1256. doi: 10.1111/j.1460-9568.2004.03225.x. [DOI] [PubMed] [Google Scholar]
- Megias M, Emri Z, Freund TF, Gulyas AI. Total number and distribution of inhibitory and excitatory synapses on hippocampal CA1 pyramidal cells. Neuroscience. 2001;102:527–540. doi: 10.1016/s0306-4522(00)00496-6. [DOI] [PubMed] [Google Scholar]
- Miles R, Toth K, Gulyas AI, Hájos N, Freund TF. Differences between somatic and dendritic inhibition in the hippocampus. Neuron. 1996;16:815–823. doi: 10.1016/s0896-6273(00)80101-4. [DOI] [PubMed] [Google Scholar]
- Morris NP, Harris SJ, Henderson Z. Parvalbumin-immunoreactive, fast-spiking neurons in the medial septum/diagonal band complex of the rat: intracellular recordings in vitro. Neuroscience. 1999;92:589–600. doi: 10.1016/s0306-4522(99)00026-3. [DOI] [PubMed] [Google Scholar]
- Nusser Z, Cull-Candy S, Farrant M. Differences in synaptic GABA(A) receptor number underlie variation in GABA mini amplitude. Neuron. 1997;19:697–709. doi: 10.1016/s0896-6273(00)80382-7. [DOI] [PubMed] [Google Scholar]
- Nusser Z, Hajos N, Somogyi P, Mody I. Increased number of synaptic GABA(A) receptors underlies potentiation at hippocampal inhibitory synapses. Nature. 1998;395:172–177. doi: 10.1038/25999. [DOI] [PubMed] [Google Scholar]
- Pawelzik H, Hughes DI, Thomson AM. Physiological and morphological diversity of immunocytochemically defined parvalbumin- and cholecystokinin-positive interneurones in CA1 of the adult rat hippocampus. J Comp Neurol. 2002;443:346–367. doi: 10.1002/cne.10118. [DOI] [PubMed] [Google Scholar]
- Pierce JP, Lewin GR. An ultrastructural size principle. Neuroscience. 1994;58:441–446. doi: 10.1016/0306-4522(94)90071-x. [DOI] [PubMed] [Google Scholar]
- Poncer JC, McKinney RA, Gahwiler BH, Thompson SM. Differential control of GABA release at synapses from distinct interneurons in rat hippocampus. J Physiol. 2000;528(Pt 1):123–130. doi: 10.1111/j.1469-7793.2000.00123.x. [DOI] [PMC free article] [PubMed] [Google Scholar]
- Richmond JE, Broadie KS. The synaptic vesicle cycle: exocytosis and endocytosis in Drosophila and C. elegans. Curr Opin Neurobiol. 2002;12:499–507. doi: 10.1016/s0959-4388(02)00360-4. [DOI] [PubMed] [Google Scholar]
- Serafin M, Williams S, Khateb A, Fort P, Muhlethaler M. Rhythmic firing of medial septum non-cholinergic neurons. Neuroscience. 1996;75:671–675. doi: 10.1016/0306-4522(96)00349-1. [DOI] [PubMed] [Google Scholar]
- Simon AP, Poindessous-Jazat F, Dutar P, Epelbaum J, Bassant MH. Firing properties of anatomically identified neurons in the medial septum of anesthetized and unanesthetized restrained rats. J Neurosci. 2006;26:9038–9046. doi: 10.1523/JNEUROSCI.1401-06.2006. [DOI] [PMC free article] [PubMed] [Google Scholar]
- Soltesz I. Diversity in the Neuronal Machine. Oxford: Oxford University Press; 2005. [Google Scholar]
- Somogyi P, Hodgson AJ. Antisera to γ-aminobutyric acid. III. Demonstration of GABA in Golgi-impregnated neurons and in conventional electron microscopic sections of cat striate cortex. J Histochem Cytochem. 1985;33:249–257. doi: 10.1177/33.3.2579124. [DOI] [PubMed] [Google Scholar]
- Somogyi P, Klausberger T. Defined types of cortical interneurone structure space and spike timing in the hippocampus. J Physiol. 2005;562:9–26. doi: 10.1113/jphysiol.2004.078915. [DOI] [PMC free article] [PubMed] [Google Scholar]
- Sotty F, Danik M, Manseau F, Laplante F, Quirion R, Williams S. Distinct electrophysiological properties of glutamatergic, cholinergic and GABAergic rat septohippocampal neurons: novel implications for hippocampal rhythmicity. J Physiol. 2003;551:927–943. doi: 10.1113/jphysiol.2003.046847. [DOI] [PMC free article] [PubMed] [Google Scholar]
- Sterio DC. The unbiased estimation of number and sizes of arbitrary particles using the disector. J Microsc. 1984;134:127–136. doi: 10.1111/j.1365-2818.1984.tb02501.x. [DOI] [PubMed] [Google Scholar]
- Taschenberger H, Leao RM, Rowland KC, Spirou GA, von Gersdorff H. Optimizing synaptic architecture and efficiency for high-frequency transmission. Neuron. 2002;36:1127–1143. doi: 10.1016/s0896-6273(02)01137-6. [DOI] [PubMed] [Google Scholar]
- Telgkamp P, Padgett DE, Ledoux VA, Woolley CS, Raman IM. Maintenance of high-frequency transmission at purkinje to cerebellar nuclear synapses by spillover from boutons with multiple release sites. Neuron. 2004;41:113–126. doi: 10.1016/s0896-6273(03)00802-x. [DOI] [PubMed] [Google Scholar]
- Toth K, Freund TF, Miles R. Disinhibition of rat hippocampal pyramidal cells by GABAergic afferents from the septum. J Physiol (Lond) 1997;500:463–474. doi: 10.1113/jphysiol.1997.sp022033. [DOI] [PMC free article] [PubMed] [Google Scholar]
- Ylinen A, Bragin A, Nadasdy Z, Jando G, Szabo I, Sik A, Buzsaki G. Sharp wave-associated high-frequency oscillation (200 Hz) in the intact hippocampus: network and intracellular mechanisms. J Neurosci. 1995;15:30–46. doi: 10.1523/JNEUROSCI.15-01-00030.1995. [DOI] [PMC free article] [PubMed] [Google Scholar]