Abstract
The steroidogenic acute regulatory protein (StAR) increases the movement of cholesterol from the outer to the inner membrane of adrenal and gonadal mitochondria, thus providing the substrate for steroid hormone biosynthesis. Deletion of 62 amino-terminal aa produces a cytoplasmic form of StAR (N-62 StAR) that lacks the mitochondrial leader sequence but retains full activity and appears to act at the outer mitochondrial membrane. At neutral pH the native state of bacterially expressed N-62 StAR protein displays cooperative unfolding under the influence of urea with ΔGH2O = −4.1 kcal/mol, and it remains correctly folded down to pH 4. Limited proteolysis at different pHs shows that the biologically essential C-terminal region is accessible to solvent, and that the N-terminal domain is compact at pH 8 and partially unfolds below pH 4. Secondary structural analysis of CD curves suggests that the unfolding may coincide with an increase in α-helical character at pH 3.5. Fluorescence spectroscopy at pH 3–8 and at 0–6 M urea is consistent with two distinct domains, a compact N-terminal domain containing tryptophans 96 and 147 and a more solvent-accessible C-terminal domain containing tryptophans 241 and 250. These observations suggest that StAR forms a molten globule structure at pH 3.5–4.0. As the mitochondrial proton pump results in an electrochemical gradient, and as StAR must unfold during mitochondrial entry, StAR probably undergoes a similar conformational shift to an extended structure while interacting with the mitochondrial outer membrane, allowing this apparent molten globule form to act as an on/off switch for cholesterol entry into the mitochondria.
Most proteins are folded into unique conformations determined by energetic information specified by their sequences (1, 2). Folding can proceed through a variety of intermediate states with decreasing Gibbs free energies (3). The intermediates may comprise partially folded forms of individual domains or of the entire protein: intermediates that have attained a high degree of secondary structure but lack defined tertiary structure often are termed “molten globules” (4). Molten globules can be viewed as highly dynamic, collapsed, compact polypeptide chains maintained by hydrophobic interactions that promote helical conformations but that lack fixed, specific long-range interactions (5–11). As molten globules are incompletely folded proteins, they generally are regarded as having little or no biological activity (12), although proteins may go through molten globule intermediate states during membrane insertion (13). We present evidence that the steroidogenic acute regulatory protein (StAR) exists as a molten globule at reduced pH and hypothesize that this partially unfolded state may be critical to its biological action.
StAR was first described as pp30, a 30-kDa phosphoprotein found in adrenal and gonadal steroidogenic cells that is synthesized rapidly in response to cAMP and has a very short half-life (14–16). StAR rapidly increases the movement of cholesterol from the outer to the inner mitochondrial membrane (17–19), thus increasing the availability of substrate for the cholesterol side-chain cleavage enzyme (P450scc), which initiates the synthesis of all steroid hormones (20). Transfection of steroidogenic cells with vectors expressing StAR and of nonsteroidogenic cells with StAR and the cholesterol side-chain cleavage enzyme system shows that StAR increases steroidogenesis at least 6-fold (17–19). Disruption of the human gene for StAR causes congenital lipoid adrenal hyperplasia (18, 21–24), a severe disorder of adrenal and gonadal steroidogenesis in which placental steroidogenesis is spared (25, 26).
StAR is synthesized as a 37-kDa protein of 285 aa that is imported into mitochondria via a typical mitochondrial leader sequence and cleaved to a 30-kDa intramitochondrial form (14–19). However, deletion of 62 amino-terminal aa results in a cytoplasmic form of StAR (N-62 StAR) that retains complete activity and appears to interact with the outer mitochondrial membrane (27, 28). Thus it is now thought that the active form of StAR is the 37-kDa “preprotein,” and that the “mature,” intramitochondrial 30-kDa protein is biologically inactive (29). Consistent with this hypothesis, all known StAR mis-sense mutations that cause congenital lipoid adrenal hyperplasia are in the carboxyl-terminal 40% of the protein between residues 169 and 275 (22, 24, 26) and deletion of only 28 carboxyl-terminal residues renders StAR inactive (18); thus the C terminus of StAR contains biologically crucial domains. Although StAR is critical for steroidogenesis in the adrenal and gonads, steroidogenic tissues that do not express the StAR gene, including the placenta (25) and brain (30), synthesize pregnenolone by a StAR-independent mode of steroidogenesis (22). The mechanism of StAR-independent steroidogenesis is unknown, but a protein of unknown function termed MLN-64 is found in placenta and brain, has a C terminus with significant homology to StAR, and can promote steroidogenesis in a transfected cell system (31).
Although N-62 StAR does not enter the mitochondria, immuno-electron microscopy shows that relatively few StAR molecules are associated with the outer mitochondrial membrane (27, 28). As addition of bacterially expressed StAR to the cytoplasm showed the StAR protein itself rather than a StAR-induced cytoplasmic product must interact with the mitochondria, it appears that StAR either has a small number of high-affinity interactions or a large number of transient interactions with the outer mitochondrial membrane (28, 29). Two StAR mutants that cause congenital lipoid adrenal hyperplasia, E169G and L275P, have only modest degrees of protein misfolding (32), suggesting the model of a large number of transient interactions. This model would be consistent with the suggestion that StAR’s mitochondrial leader serves to target the carboxyl terminus of StAR to unidentified receptors or effectors on the mitochondrial outer membrane; i.e., that the mitochondrial import machinery is important for increasing the local effective concentration of StAR at the outer mitochondrial membrane, thus transiently augmenting StAR’s action before this action is terminated by StAR’s importation into the mitochondria (28, 29). This model suggests that the active form of StAR should be a partially unfolded form, where an N-terminal domain enters the mitochondria whereas the partially unfolded molten globule form of the C terminus interacts with the outer mitochondrial membrane. We now present direct physical evidence that StAR exists as such a molten globule; furthermore, limited proteolysis identifies an N-terminal domain that retains a significant degree of structure whereas the C-terminal domain is less tightly folded at the low pH that StAR may experience at the mitochondrial membrane. These data suggest that this tightly folded N-terminal domain makes the StAR protein pause as it enters the mitochondria, increasing the opportunity for the C terminus to exert its activity.
MATERIALS AND METHODS
Construction of StAR Expression Plasmids.
The construction of the wild-type and mutant N-62 StAR vectors, their expression in Escherichia coli, and the purification of the wild-type and mutant StAR proteins were as described (32). Briefly, plasmid constructs were transfected into E. coli M15(pREP4), grown in LB medium containing kanamycin and ampicillin, and induced with 1 mM isopropyl β-d-thiogalactopyranoside. The StAR protein was purified through a Ni-nitrilotriacetic acid super flow (Qiagen, Chatsworth, CA) column precharged with NiSO4. To obtain N-62 StAR protein in various pH environments, we initially used direct dialysis against the appropriate buffer, but that resulted in aggregated StAR protein. Therefore, after elution of wild-type N-62 StAR protein from the Ni2+ column at pH 4.5, the protein samples were transferred to several different Centricon-3 tubes (Amicon), and washed and dialyzed with the appropriate buffer until the desired pH was attained. Protein concentrations were determined by denaturation with guanidinum hydrochloride (33).
Anti-StAR Antiserum.
Immunoblotting of StAR protein was carried out as described (32), except that a new rabbit anti-human StAR antiserum was raised against recombinant wild-type N-62 StAR. Protein was dissolved in Freund’s adjuvant and 0.2 mg was injected into each of three New Zealand White rabbits followed by a booster injection 6 weeks later (Lampire Biologicals, Pipersville, PA). Titers were assessed by an immunoradiometric assay. Only one rabbit generated titers above 1:500; after a third injection of antigen, this rabbit yielded a high-affinity antiserum that is used at a 1:10,000 dilution.
Circular Dichroism (CD).
CD experiments in the far-UV region (195–250 nm) were carried out by using a 1-mm path-length quartz cuvette at 20°C in a Jasco (Easton, MD) J-710 spectropolarimeter equipped with a Peltier temperature-controlled cell holder (Hewlett–Packard). One reading at high concentration used a 0.1-mm cell. The instrument was purged with a continuous flow of nitrogen of 10 liter/min. The CD spectra obtained in the near-UV (250–375 nm) were recorded in a 1-cm path-length cuvette with a protein concentration of 3 mg/ml. Spectra obtained in the far-UV are presented without mathematical smoothing. Purified wild-type N-62 StAR was equilibrated in 10 mM Tris or NaH2PO4 buffers ranging in pH from 2.0 to 8.3, and the CD spectra were recorded as a function of pH. The mean residue molar ellipticity [Θ] at 204 and 222 nm was plotted versus pH. Secondary structural analysis was carried out by using the variable selection method (34) to determine the relative proportions of α-helix and β-sheet as a function of pH. Purified wild-type N-62 StAR was equilibrated in 10 mM Tris or 10 mM sodium phosphate at pH 3.0, 4.0, 4.5, and 8.3 with increasing concentrations of urea up to 8.5 M. CD spectra were recorded as described above, and urea concentrations were determined in a refractometer after recording each spectrum. The appropriate urea buffer blank was subtracted from each spectrum, and Θ at 222 nm was plotted with respect to urea concentration.
Fluorescence Measurements.
Fluorescence studies were performed by using a Hewlett–Packard spectrofluorimeter equipped with emission slits set at 5 nm. All experiments were carried out with 40 ng of protein in 0.5 ml. The N-62 StAR protein at pH 8.3, 4.5, 4.0, 3.5, and 3.0 containing 6.0 M, 4.0 M, 2.0 M, or no urea was excited at 295 nm (for tryptophan), and the emission spectrum was recorded between 297 nm and 450 nm.
Proteolysis.
N-62 StAR (80 ng) was incubated with 5 units of trypsin (Promega, sequencing grade) in 50 mM Tris, pH 8.0 for 5, 15, 30, 45, and 60 min overnight at 4°C or 20°C. The reactions were terminated with 1× sample running buffer containing 1 mM PMSF, boiled for 5–8 min, electrophoresed on a 20% SDS-polyacrylamide gel, and electroblotted to a poly(vinylidene difluoride) membrane; various membranes were immunoblotted or stained with Coomassie blue or silver nitrate. Similarly, 80 ng of N-62 StAR were incubated with 5 μl of immobilized pepsin (Pierce) in 20 mM NaOAc, pH 4.0, for 30–180 min at either 4°C or room temperature. The major bands at 16 kDa (pH 8) and 8.5 kDa (pH 4) resulting from limited digestion were excised, cut into 1-mm pieces, and extracted three times with 50% acetonitrile/25 mM aqueous NH4HCO3 in silanized Eppendorf tubes for in-gel digestion (35). After lyophilization in a vacuum centrifuge, the gel pieces were rehydrated with 20 μl of 50 ng/μl trypsin (Promega; sequencing grade), digested overnight at 37°C, and sonicated in 100 μl of water for 5 min. The supernatant was removed, and the gel pieces were extracted three times with 50% acetonitrile/5% trifluoroacetic acid (TFA). The extracts were pooled and reduced to 5–10 μl by vacuum centrifugation, and 10 μl of 0.1% TFA was added. Aliqouts of 1 μl of the unseparated peptide mixtures were analyzed by matrix-assisted laser desorption ionization mass spectrometry (MALDI MS), using a PE Biosystems (Framingham, MA) Voyager-DE STR mass spectrometer in reflectron mode. The matrix was α-cyano-4-hydroxycinnamic acid, and the mass scale was calibrated internally by reference to known trypsin autolysis products. The remainder of the sample was dried to 5 μl, and 30 μl of water was added. A 15-μl aliquot was used for capillary HPLC interfaced to a PE Biosystems Mariner electrospray ionization mass spectrometer. Solvent A (0.1% formic acid) and solvent B (5:2 ethanol/n-propanol, 0.05% formic acid) were used to develop a 180-μm × 15-cm C-18 capillary column with 3-μm particle size (LC Packings, San Francisco) with a gradient of 5–60% solvent B in 120 min. The molecular masses of the peptides were determined by MS and compared with calculated masses for peptides anticipated for cleavage of the StAR protein by trypsin, assuming cleavages at lysine and arginine residues. For comparison purposes, an undigested sample also was cut from the SDS-polyacrylamide gel and digested with trypsin, and the peptides were identified by MALDI MS and liquid chromatography electrospray ionization MS.
RESULTS
N-62 StAR Protein Is a Monomer.
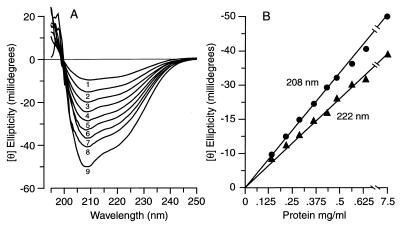
We prepared N-62 StAR as described (32); analytical ultracentrifugation at 0.3 mg/ml and pH 8.3 confirmed that the present preparation of N-62 StAR was monomeric (data not shown), also as described (32). Many proteins change their conformations and/or form aggregates at high concentrations. However, the signal intensities of CD spectra obtained in the far-UV for this preparation of N-62 StAR at pH 4.5 depended solely on concentration over a 60-fold range from 0.125 to 7.4 mg/ml (Fig. 1A). The CD data gave a linear correlation between concentration and Θ at both the π-π* transition at 208 nm and the n-π* transition at 222 nm (Fig. 1B). Thus the N-62 StAR preparation used in this study was monomeric and did not aggregate or change its conformation at high (or low) concentrations.
Figure 1.
Effect of protein concentration on conformation. (A) Unsmoothed far-UV CD spectra of wild-type N-62 StAR recorded in a 1-mm path-length cuvette between 195 nm and 250 nm for protein concentrations of 0.125 mg/ml (wave 1), 0.187 mg/ml (wave 2), 0.250 mg/ml (wave 3), 0.312 mg/ml (wave 4), 0.387 mg/ml (wave 5), 0.449 mg/ml (wave 6), 0.512 mg/ml (wave 7), and 0.574 mg/ml (wave 8), and in a 0.1-mm path-length cuvette for a protein concentration of 7.5 mg/ml (wave 9), all at pH 4.5. (B) Correlation between protein concentration and ellipticity (Θ) at 208 and 222 nm, indicating that the protein conformation is independent of concentration.
Effect of pH.
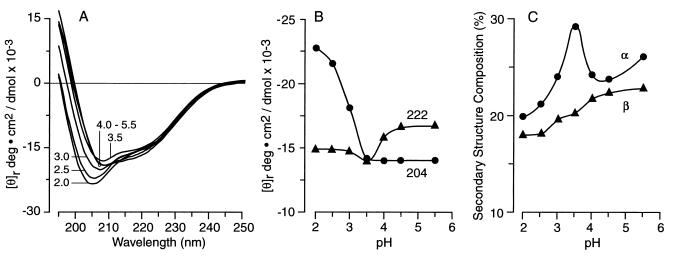
Protein conformation and folding are often sensitive to pH. As the pH decreases, most native proteins first lose tertiary structure and then their secondary structure so that under strongly acidic conditions they revert to an unstructured random coil. CD spectroscopy can distinguish secondary structural components by the presence of minima near 198 nm for random coil, at 208 nm and 222 nm for the α-helices, and at 218 nm for β-sheets (36, 37). Changes in the CD spectra were used to monitor pH-induced unfolding of N-62 StAR. At neutral pH the protein exhibits the CD spectrum of its native conformation as described (32). This CD spectrum remained substantially unchanged at pH 5.5, 4.5, and 4.0, retaining its primarily α-helical character (Fig. 2A). A plot of θ222 versus pH showed only a minor drop in the proportion of secondary structure (helix plus sheet), even at pH 2.0, whereas a small increase in θ204 at pH4 and below showed the increased presence of random coil (Fig. 2B). Secondary structural analysis by the method of Johnson (34) for N-62 StAR at these pH values was consistent with these conclusions (Fig. 2C). Thus in the range pH 8.3 to 4.0 there was little change in the CD spectra or the calculated secondary structural analysis. The amount of α-helix increased at pH 3.5 without a corresponding change in the calculated proportion of β-sheet, consistent with a transition to a molten globule. As the pH was lowered further, the secondary structure decreased only slightly and random coil increased, as shown by the blue shift of the minimum to 204 nm at pH 2.0. N-62 StAR gave positive CD signals in the near-UV at pH values from 8.3 to 2.0, suggesting that even at pH 2.0 the protein was not wholly denatured (data not shown).
Figure 2.
Effect of pH on protein conformation. (A) Unsmoothed far-UV CD spectrum of N-62 StAR protein, recorded between 190 nm and 250 nm and equilibrated at the pH values shown. (B) Correlation between [θ]204 and [θ]222 and pH, indicating the increase in random coil below pH 4 and the retention of secondary structure, even down to pH 2.0. (C) Correlation between secondary structure as represented by the percentage α-helix and β-sheet compositions and pH, suggesting an increase in helicity at pH 3.5.
Urea Denaturation.
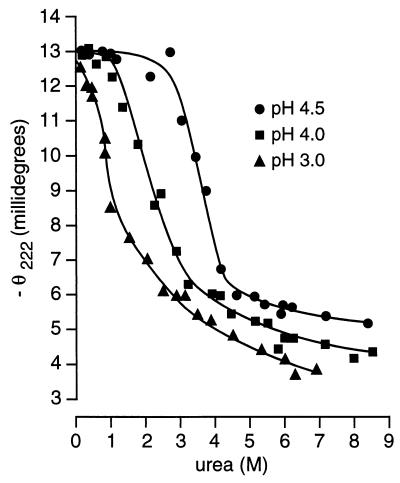
Concentrated urea will disrupt the higher structure of water, thus decreasing hydrophobic effects and promoting protein unfolding and dissociation. We used urea-induced unfolding and refolding of StAR at various pH values to monitor the cooperativity of StAR unfolding. At each pH, N-62 StAR was added to buffered urea at different concentrations and melted overnight at room temperature, then the ellipticity was recorded at 222 nm. Fig. 3 shows urea denaturation curves obtained at pH 3.0, 4.0, and 4.5; the melting curves were indistinguishable at pH values between 4.5 and 8.3, thus the data for the higher pH values are not shown. At pH 4.5 the unfolding of StAR started at about 2.5 M urea and was essentially complete in 5.0 M urea with the midpoint of the transition at 3.5 M urea. These curves fit a two-state model in which the free energy differences between the native (N) and unfolded (U) conformations depend linearly on the concentration of the denaturant; thus ΔG = ΔGH2O-m[Urea] (38), where ΔG is the apparent free energy difference at any urea concentration, ΔGH2O is the free energy difference in the absence of denaturant, and m is a parameter describing the cooperativity of the transition. Hence at pH values between 4.5 and 8.3, ΔGH2O = −4.1 kcal/mol and m = 1.26 kcal (38). This cooperative transition for StAR unfolding also was seen at pH 4.0, but the curve was shifted to lower urea concentrations, reducing the free energy to −3.4 kcal/mol. By contrast, at pH 3.0 there was no cooperative transition as the addition of even very low concentrations of urea caused an immediate reduction in the CD signal, indicating a largely unfolded state that could undergo a complete loss of secondary structure, resulting in the formation of random coil. Thus StAR is stable at or above pH 4.5, but has decreasing free energy and decreasing stability as the pH falls below 4.0.
Figure 3.
Urea denaturation. Equivalent amounts of wild-type N-62 StAR were equilibrated overnight with different concentrations of urea buffered with 10 mM Tris or 20 mM Na2HPO4 at pH values ranging from 2.0 to 8.3. The ellipticity at 222 nm was recorded in a 1-mm path-length cuvette at 20°C and plotted against the urea concentration, as determined in a refractometer. For clarity only data obtained at pH 4.5 (●), 4.0 (■), and 3.0 (▴) are presented.
Proteolytic Digestion of StAR.
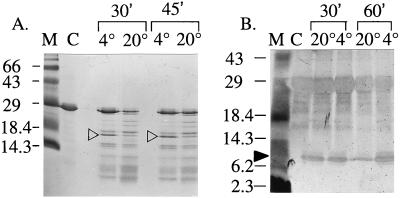
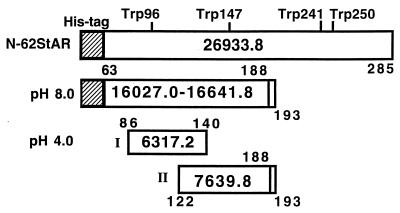
To understand StAR folding in greater detail we sought to determine whether N-62 StAR contains domains that are differentially protected from proteolysis under different conditions. Trypsin is a highly specific enzyme that cleaves after lysine and arginine residues under mildly alkaline conditions, whereas pepsin is a nonspecific protease at acidic pH that cleaves preferentially on either side of aromatic and other hydrophobic amino acids. Therefore, we partially digested N-62 StAR with trypsin at pH 8.0 and with pepsin at pH 4.0 at different temperatures for varying lengths of time. The digestion patterns were analyzed by protein staining and Western blotting after 20% SDS/PAGE. At pH 8.0, a 16-kDa protein fragment was protected initially (Fig. 4) but then was digested into discrete tryptic fragments on longer incubation (data not shown), suggesting a tightly packed protein core, whereas pepsin digestion at pH 4.0 yielded a smaller protected fragment of about 8.5 kDa (Fig. 4). Fig. 4 was selected from a wide range of times, temperatures, pHs, and enzyme/substrate ratios. The 16-kDa fragment was isolated by gel electrophoresis and digested further with trypsin, and the resulting peptides were analyzed by two different mass spectrometric techniques, MALDI MS and liquid chromatography electrospray ionization MS (Table 1). These data establish the identities of the protected fragments and show that the protected domain is essentially N terminal at both pH 4 and pH 8 (Fig. 5). The peptides identified in the subdigest of the 16-kDa band obtained at pH 8.0 spanned the sequence from the extreme N terminus (including the His tag) to residue 188 of full-length StAR. The anticipated tryptic peptide for residues 194–213 was prominent in the digest of the full-length protein but was not found after digestion at pH 8.0, and the pentapeptide at 189–193 (Cys-Ala-Lys-Arg-Arg) could not be seen in either case. Thus at pH 8.0, there is a protected N-terminal domain extending to residue 188 or 193. The calculated molecular mass of these two N-terminal domains would be 16,028.0 or 16,641.8 Da, consistent with the apparent molecular mass of 16 kDa seen on the gel. The mass spectrometric analysis of the tryptic peptide for 194–213 derived from a tryptic digest of the full-length protein showed that serine 195 was phosphorylated even though the protein had been expressed in bacteria. This residue is phosphorylated in a regulated fashion to increase StAR activity in eukaryotic cells (39).
Figure 4.
Proteolytic digestion of N-62 StAR. (A) Trypsin digestion of 5 μg samples of N-62 StAR for 30 or 45 min at 4°C or 20°C as indicated, displayed on 20% acrylamide and stained with Coomassie blue. The ≈16-kDa band (open arrowheads) was excised for mass spectrometric analysis. This photograph understates the differences in staining intensity in the original gels; the indicated bands were decidedly more prominent than any others. (B) Pepsin digestion of 1 μg samples of N-62 StAR for 30 or 60 min at 20°C or 4°C, as indicated, displayed on 20% acrylamide and stained with silver nitrate. The ≈8.5-kDa band (solid arrowhead) appeared as a doublet and hence was excised as two separate bands for mass spectrometric analysis. Peptides smaller than 10 kDa do not stain well.
Table 1.
Mass spectrometric analysis of StAR peptides
| Sequence residues | Digest peptide mass (M+H)+
|
||||
|---|---|---|---|---|---|
| Calculated | N-62 StAR | pH 8.0 band | pH 4.0 band I | pH 4.0 band II | |
| 249-253 | 600.351 | 600.354 | — | — | — |
| 112-118 | 713.420 | ||||
| 713.429 | 713.425 | 713.441 | — | ||
| 183-188 | 722.384 | 722.380 | 722.382 | — | |
| 722.402 | 722.397 | 722.394 | |||
| 133-140 | 1,050.547 | 1,050.548 | 1,050.550 | 1,050.515 | |
| 1,050.566 | 1,050.538 | 1,050.585 | 1,050.544 | ||
| 275-284 | 1,096.539 | 1,096.537 | — | — | — |
| 239-248 | 1,201.720 | 1,201.704 | — | — | — |
| 274-284 | 1,252.640 | 1,252.625 | — | — | — |
| 86-97 | 1,315.701 | 1,315.693 | 1,315.699 | — | |
| 1,315.683 | 1,315.693 | 1,315.705 | |||
| 122-132 met-ox | 1,330.668 | 1,330.659 | 1,330.665 | 1,330.612 | |
| 1,330.684 | 1,330.643 | 1,330.671 | 1,330.664 | ||
| 141-152 met-ox | 1,421.619 | — | — | ||
| 1,421.603 | 1,421.627 | ||||
| 141-152 met-ox2 | 1,437.614 | — | |||
| 1,437.593 | 1,437.581 | 1,437.661 | |||
| Leader (3-17)* | 1,717.682 | 1,717.681 | — | — | — |
| 218-236 met-ox | 2,018.979 | — | — | — | |
| 2,019.019 | |||||
| 163-182 | 2,082.062 | 2,082.076 | 2,082.065 | — | — |
| 2,082.054 | 2,082.029 | ||||
| 99-118 | 2,160.061 | — | — | ||
| 2,159.965 | 2,159.966 | ||||
| 99-118 met-ox | 2,176.056 | — | — | ||
| 2,175.984 | 2,175.996 | ||||
| 254-272 | 2,183.157 | 2,183.173 | — | — | — |
| 2,183.156 | |||||
| 194-213† | 2,207.918 | — | — | — | |
| 2.207.912 | |||||
| 193-213† | 2,364.019 | — | — | — | |
| 2,364.006 | |||||
| Leader (3-17)* + 63-85 met-ox | 4,448.881 | — | — | ||
| 4,449.007 | 4,449.019 | ||||
| Leader (3-17)* + 63-85 met-ox2 | 4,464.876 | — | — | ||
| 4,464.930 | 4,464.723 | ||||
| Leader (1-17)* + 63-85 met-ox3 | 4,768.012 | — | — | ||
| 4,767.900 | 4,767.886 | ||||
The top values are from MALDI MS and the bottom values are from liquid chromatography electrospray ionization MS.
Leader sequence (1-17) MRGSHHHHHHGSDDDDK.
Phosphorylated; met-ox: methionine sulfoxide residues.
Figure 5.
Interpretation of the data in Table 1 showing regions of N-62 StAR that are protected from proteolysis at pH 4.0 and pH 8.0. (Top) The N-62 StAR construct has four Trp residues in the indicated positions and retains the 6 His-tag and 11 other amino-terminal aa (cross-hatched area); its total molecular mass is 26,933.8. (Middle) The truncated 16-kDa species resulting from limited trypsin digestion at pH 8.0 is shown with two possible carboxyl termini because resides 189–193 are not amenable to mass spectrometric analysis. Thus masses of either 16,027.0 or 16,641.8 are possible. (Bottom) The ≈6.5-kDa band isolated from pepsin digestion at pH 4 contains two partially overlapping peptides of 6,317.2 and 7,639.8, assuming the 189–193 peptide is retained.
At pH 4.0 the region protected from digestion with pepsin was much smaller, running at ≈8.5 kDa (Fig. 4B). Close inspection showed two closely spaced bands. Each was cut from the gel and digested with trypsin, and the resulting peptides were analyzed (Table 1). The lower band (I) corresponded to the sequence 86–140 and the upper band (II) to 122–188 (or 193 as stated above for the pH 8.0 protected region) (Fig. 5). After the secondary tryptic digestion, no peptides were identified corresponding to N- or C-terminal extensions, probably because the original pepsin digestion is relatively promiscuous. Thus a large N-terminal region was protected from limited proteolytic digestion at pH 8.0 whereas the C-terminal region essential for activity was exposed to solvent under physiological conditions and hence was accessible to proteolysis. When the pH is reduced to 4.0 the protein’s tertiary structure starts to collapse even though the secondary structure is maintained. At pH 4.0 some sites in the previously protected region become exposed to the solvent and can be cut by pepsin, but a significant degree of protection is retained and two overlapping peptides encompassing residues 86–188 persist. Both of these peptides contain numerous potential cleavage sites for pepsin; the failure of pepsin to cleave these sites at pH 4.0 attests to the substantial degree of protein folding retained under these conditions.
Fluorescence Spectroscopy.
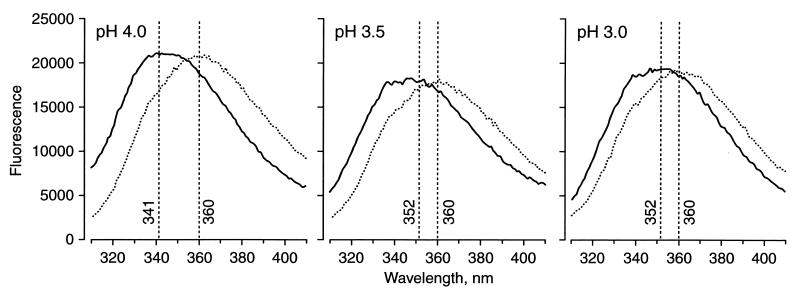
Excitation of tryptophan residues by UV radiation at 295 nm results in fluorescent emission with maxima at about 350 nm. The precise emission wavelength depends on the environment of each tryptophan residue, which may be strongly influenced by the state of hydration, pH, and the nature of nearby residues. Fluorescence from tryptophans that are shielded from the aqueous environment generally is associated with a blue shift to shorter wavelengths, relative to more solvent-exposed residues. StAR has four tryptophan residues at positions 96, 147, 241, and 250 (19), hence we examined the fluorescence of N-62 StAR at pH 8.3, 4.5, 4.0, 3.5, and 3.0. The measurements were repeated with 2.0, 4.0, and 6.0 M urea at all pHs except 8.3 (Table 2). The emission curves obtained at pH 8.3, 4.5, and 4.0 were essentially the same, with a predominant peak at 341 nm overlapping a peak at 352 nm (Fig. 6). Reducing the pH to 3.5 and 3.0 progressively diminished the intensity of the 341-nm peak and increased the intensity of the 352-nm peak. Thus it appears that there are essentially two environments for tryptophan, one shielded and the other more solvent exposed: the shielded environment is maintained down to pH 4.0 but it is reduced over the pH range of 4.0 to 3.0. At all pHs studied, increasing concentrations of urea up to 6.0 M shifted the signal to 360 nm, corresponding to denaturation of N-62 StAR and complete exposure of all four tryptophans.
Table 2.
Tryptophan emission maxima
| Urea concentration, molar
|
||||
|---|---|---|---|---|
| 0.0 | 2.0 | 4.0 | 6.0 | |
| pH 8.3 | 341 | — | — | — |
| pH 4.5 | 341 | 352 | 355 | 360 |
| pH 4.0 | 341 | 352 | 353 | 360 |
| pH 3.5 | 346 | 355 | 358 | 360 |
| pH 3.0 | 352 | 356 | 362 | 360 |
Figure 6.
Fluorescence spectroscopy. Samples of N-62 StAR at pH 8.3, 4.0, 3.5, and 3.0 were excited at 295 nm in the absence or presence of 2.0, 4.0, and 6.0 M urea. Only the data without urea and with 6.0 M urea at pH 4.0, 3.5, and 3.0 are shown. The pH 8.3 and 4.0 data in the absence of urea were equivalent. The effects of 2.0 and 4.0 M urea were intermediate between those of 0.0 and 6.0 M urea. The wavelengths of the emission maxima in each condition are given in Table 2.
The proteolytic digestion of N-62 StAR showed that Trp-96 and Trp-147 are in a protected N-terminal domain that survives digestion at both pH 8.0 and 4.0; by contrast Trp-241 and Trp-250 are in the exposed C-terminal domain that is readily proteolyzed, even at pH 8.0. Thus Trp-241 and Trp-250 probably give rise to the peak at 352 nm, and Trp-96 and Trp-147 give rise to the blue-shifted signal at 341 nm at all pHs down to the point at which the N terminus starts to unfold. Then tertiary structure is lost over a narrow pH range, causing the previously protected residues to become partly exposed, reducing the intensity of the 341-nm peak. The CD data show that secondary structure is retained in this pH range, thus we conclude that a molten globule is formed in the pH range of 3.0 to 4.0. All structure is lost in the presence of strongly denaturing 6 M urea, almost totally eliminating the peak at 341 nm, and shifting the signal to 360 nm, independent of pH.
DISCUSSION
Although N-62 StAR lacks a mitochondrial leader sequence and is not transported into mitochondria, it is active and appears to function via the outer mitochondrial membrane (27–29). Because the full-length, wild-type StAR must undergo unfolding during its mitochondrial entry, and because it appears that StAR is active during this mitochondrial entry, we hypothesized that the active form of StAR is in a molten globule state that acts directly on the outer mitochondrial membrane. Our present physical studies on the N-62 StAR protein are consistent with this hypothesis, as they show: (i) pH-dependent unfolding with an increase in helical character at pH 3.5 and retention of secondary structure, even at pH 2.0, (ii) cooperative denaturation in urea down to pH 4.0, (iii) the existence of a compact N-terminal domain that partially unfolds at pH 4, and (iv) that the C-terminal region, which is known to be essential for steroidogenesis, is more solvent accessible and partially unfolded at lower pH. Thus we suggest that StAR is biologically active at local acidic pH.
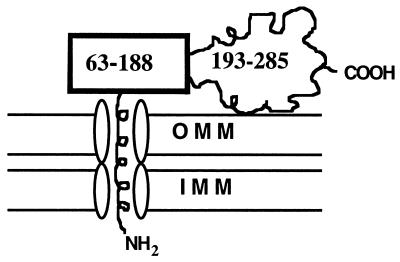
In full-length StAR the N-terminal mitochondrial leader sequence must direct the N terminus to be the first domain to enter the mitochondrial membrane. The C terminus is the region most accessible to proteases. This finding is somewhat unexpected as, with the exception of 14 aa at the extreme C terminus, the C terminus is the most hydrophobic domain of N-62 StAR, and secondary structure predictions suggest that all regions of the protein are highly structured (40, 41). An electrostatic interaction could occur between the positively charged residues at the C terminus of the protein and the negatively charged membrane lipid. Alternatively, the C-terminal region of StAR might interact with an as-yet-unidentified receptor on the outer mitochondrial membrane. In either event, the physical data suggest that the helices in the soluble StAR structure could be preserved in the membrane-bound form (13), suggesting that the membrane-bound protein retains its compact N terminus. We hypothesize that this compact N terminus, which must fully unfold during mitochondrial entry (46), causes the StAR protein to pause during mitochondrial entry, thus providing more opportunity for the biologically active C terminus to interact with the the outer mitochondrial membrane (Fig. 7).
Figure 7.
Model for StAR’s entry into the mitochondria. The amphipathic helical mitochondrial leader peptide transverses the outer mitochondrial membrane (OMM) and inner mitochondrial membrane (IMM) by using standard mitochondrial protein-import machinery. The protease-resistant domain comprising residues 63–188 slows protein unfolding and mitochondrial entry, permitting the biologically active protease-accessible carboxyl-terminal domain (residues 189–285) to have more opportunity to interact with the OMM.
Enzymes catalyzing proton transfer are arranged asymmetrically on the inner mitochondrial membrane so that protons are transferred across the two mitochondrial membranes. This proton pump establishes an electrochemical gradient leading to a local reduction of pH outside the mitochondria. Hydrolysis of ATP appears to be necessary for StAR activity and disruption of the mitochondrial electrochemical gradient with the protonophore mCCCP eliminated StAR-induced steroidogenesis by mitochondria isolated from mouse Leydig MA-10 cells (42, 43). If the interaction of StAR with the outer mitochondrial membrane causes a reduction in the membrane potential (ΔΨ) (44), our data suggest that this reduction would extend the length and increase the flexibility of the linker region between the protected N terminus and the biologically active, putatively membrane-bound C terminus. The structure of StAR lends itself to partial unfolding, as the N-terminal and C-terminal domains behave differently: the limited proteolysis at pH 4 correlates well with the lack of extensive flexibility indicated by the tryptophan fluorescence and strongly suggests a partially open tertiary structure. Thus partial unfolding induced by the mitochondrial electrochemical gradient and by mitochondrial insertion result in the transition to a molten globule state (45). By preserving some secondary structure, the molten globule state would provide the best pathway for minimizing the energetic cost of making a compact protein structure able to be inserted into a membrane, as this transition to a flexible conformation lowers the energy required to allow the structure to open, possibly exposing a cholesterol channel. Thus as has been suggested before (28), StAR could function as an on/off switch for cholesterol flux from the outer to the inner mitochondrial membrane. A specific molten globule form of StAR could be a mandatory step for eliciting its activity on the outer mitochondrial membrane.
Acknowledgments
We thank from the University of California, San Francisco Drs. David A. Agard, Department of Biochemistry and Biophysics, and Stanley B. Prusiner, Department of Neurology, for use of the CD spectro-polarimeters and Dr. Richard Shafer, Department of Pharmaceutical Chemistry, for use of the spectrofluorimeter. This work was supported by National Institutes of Health Grants DK37922, DK42154, and HD34449 (to W.L.M.). H.S.B. was supported by Pediatric Endocrinology Training Grant DK07161 (to W.L.M.). R.M.W. was supported by the Natural Sciences and Engineering Research Council of Canada. MS was carried out in the University of California, San Francisco Mass Spectrometry Facility, supported by National Institutes of Health Grant NCRRBRTP RR01614.
ABBREVIATIONS
- StAR
steroidogenic acute regulatory protein
- MALDI
matrix-assisted laser desorption ionization
- MS
mass spectrometry
References
- 1.Anfinsen C B. Biochem J. 1972;128:737–749. doi: 10.1042/bj1280737. [DOI] [PMC free article] [PubMed] [Google Scholar]
- 2.Anfinsen C B. Science. 1973;181:222–225. doi: 10.1126/science.181.4096.223. [DOI] [PubMed] [Google Scholar]
- 3.Brooks C L I, Greubele M, Onuchic J N, Wolynes P G. Proc Natl Acad Sci USA. 1998;95:11037–11038. doi: 10.1073/pnas.95.19.11037. [DOI] [PMC free article] [PubMed] [Google Scholar]
- 4.Privalov P L. J Mol Biol. 1996;258:707–725. doi: 10.1006/jmbi.1996.0280. [DOI] [PubMed] [Google Scholar]
- 5.Kuwajima K. Proteins Struct Funct Genet. 1989;6:87–103. doi: 10.1002/prot.340060202. [DOI] [PubMed] [Google Scholar]
- 6.Chan H S, Dill K A. Annu Rev Biophys Biophys Chem. 1991;20:447–490. doi: 10.1146/annurev.bb.20.060191.002311. [DOI] [PubMed] [Google Scholar]
- 7.Ptitsyn O B. In: Protein Folding. Creighton T E, editor. New York: Freeman; 1992. pp. 243–300. [Google Scholar]
- 8.Peng Z Y, Kim P S. Biochemistry. 1994;33:2136–2141. doi: 10.1021/bi00174a021. [DOI] [PubMed] [Google Scholar]
- 9.Redfield C, Smith L J, Boyd J, Lawrence G M, Edwards R G, Gershater C J, Smith R A, Dobson C M. J Mol Biol. 1994;238:23–41. doi: 10.1006/jmbi.1994.1265. [DOI] [PubMed] [Google Scholar]
- 10.Dill K A, Stigter D. Adv Protein Chem. 1995;46:59–104. doi: 10.1016/s0065-3233(08)60332-0. [DOI] [PubMed] [Google Scholar]
- 11.Ptitsyn O B. Adv Protein Chem. 1996;47:83–229. doi: 10.1016/s0065-3233(08)60546-x. [DOI] [PubMed] [Google Scholar]
- 12.Horowitz P M, Xu R. J Biol Chem. 1992;267:19464–19469. [PubMed] [Google Scholar]
- 13.van der Goot F G, González-Mañas J M, Lakey J H, Pattus F. Nature (London) 1991;354:408–410. doi: 10.1038/354408a0. [DOI] [PubMed] [Google Scholar]
- 14.Stocco D M, Sodeman T C. J Biol Chem. 1991;266:19731–19738. [PubMed] [Google Scholar]
- 15.Epstein L F, Orme-Johnson N R. J Biol Chem. 1991;266:19739–19745. [PubMed] [Google Scholar]
- 16.Stocco D M, Clark B J. Endocr Rev. 1996;17:221–244. doi: 10.1210/edrv-17-3-221. [DOI] [PubMed] [Google Scholar]
- 17.Clark B J, Wells J, King S R, Stocco D M. J Biol Chem. 1994;269:28314–28322. [PubMed] [Google Scholar]
- 18.Lin D, Sugawara T, Strauss J F, III, Clark B J, Stocco D M, Saenger P, Rogol A, Miller W L. Science. 1995;267:1828–1831. doi: 10.1126/science.7892608. [DOI] [PubMed] [Google Scholar]
- 19.Sugawara T, Holt J A, Driscoll D, Strauss J F, III, Lin D, Miller W L, Patterson D, Clancy K P, Hart I M, Clark B J, Stocco D M. Proc Natl Acad Sci USA. 1995;92:4778–4782. doi: 10.1073/pnas.92.11.4778. [DOI] [PMC free article] [PubMed] [Google Scholar]
- 20.Miller W L. Endocr Rev. 1988;9:295–318. doi: 10.1210/edrv-9-3-295. [DOI] [PubMed] [Google Scholar]
- 21.Tee M K, Lin D, Sugawara T, Holt J A, Guiguen Y, Buckingham B, Strauss J F, III, Miller W L. Hum Mol Genet. 1995;4:2299–2305. doi: 10.1093/hmg/4.12.2299. [DOI] [PubMed] [Google Scholar]
- 22.Bose H S, Sugawara T, Strauss J F, III, Miller W L. N Engl J Med. 1996;335:1870–1878. doi: 10.1056/NEJM199612193352503. [DOI] [PubMed] [Google Scholar]
- 23.Bose H S, Pescovitz O H, Miller W L. J Clin Endocrinol Metab. 1997;82:1511–1515. doi: 10.1210/jcem.82.5.3962. [DOI] [PubMed] [Google Scholar]
- 24.Nakae J, Tajima T, Sugawara T, Arakane F, Hanaki K, Hotsubo T, Igarashi N, Igarashi Y, Ishii T, Koda N, et al. Hum Mol Genet. 1997;6:571–576. doi: 10.1093/hmg/6.4.571. [DOI] [PubMed] [Google Scholar]
- 25.Saenger P, Klonari Z, Black S M, Compagnone N, Mellon S H, Fleischer A, Abrams C A L, Shackleton C H L, Miller W L. J Clin Endocrinol Metab. 1995;80:200–205. doi: 10.1210/jcem.80.1.7829612. [DOI] [PubMed] [Google Scholar]
- 26.Miller W L. J Mol Endocrinol. 1997;17:227–240. doi: 10.1677/jme.0.0190227. [DOI] [PubMed] [Google Scholar]
- 27.Arakane F, Sugawara T, Nishino H, Liu Z, Holt J A, Pain D, Stocco D M, Miller W L, Strauss J F., III Proc Natl Acad Sci USA. 1996;93:13731–13736. doi: 10.1073/pnas.93.24.13731. [DOI] [PMC free article] [PubMed] [Google Scholar]
- 28.Arakane F, Kallen C B, Watari H, Foster J A, Sepuri N B V, Pain D, Stayrook S E, Lewis M, Gerton G L, Strauss J F., III J Biol Chem. 1998;273:16339–16345. doi: 10.1074/jbc.273.26.16339. [DOI] [PubMed] [Google Scholar]
- 29.Miller, W. L. & Strauss, J. F. III (1999) J. Steroid Biochem. Mol. Biol., in press.
- 30.Mellon S H. J Clin Endocrinol Metab. 1994;78:1003–1008. doi: 10.1210/jcem.78.5.8175951. [DOI] [PubMed] [Google Scholar]
- 31.Watari H, Arakane F, Moog-Lutz C, Callen C B, Tomasetto C, Gerton G L, Rio M C, Baker M E, Strauss J F., III Proc Natl Acad Sci USA. 1997;94:8462–8467. doi: 10.1073/pnas.94.16.8462. [DOI] [PMC free article] [PubMed] [Google Scholar]
- 32.Bose H S, Baldwin M A, Miller W L. Biochemistry. 1998;37:9768–9775. doi: 10.1021/bi980588a. [DOI] [PubMed] [Google Scholar]
- 33.Gill S C, von Hippel P H. Anal Biochem. 1989;182:319–326. doi: 10.1016/0003-2697(89)90602-7. [DOI] [PubMed] [Google Scholar]
- 34.Johnson W C., Jr Proteins. 1990;7:205–214. doi: 10.1002/prot.340070302. [DOI] [PubMed] [Google Scholar]
- 35.Rosenfeld J, Capdeville J, Guillemot J C, Ferrara P. Anal Biochem. 1992;203:173–179. doi: 10.1016/0003-2697(92)90061-b. [DOI] [PubMed] [Google Scholar]
- 36.Johnson W C., Jr Annu Rev Biophys Biophys Chem. 1988;17:145–166. doi: 10.1146/annurev.bb.17.060188.001045. [DOI] [PubMed] [Google Scholar]
- 37.Woody R W, Dunker A K. In: Circular Dichroism and Conformational Analysis of Biomolecules. Fasman G D, editor. New York: Plenum; 1996. pp. 109–144. [Google Scholar]
- 38.Pace C N. Methods Enzymol. 1986;131:266–280. doi: 10.1016/0076-6879(86)31045-0. [DOI] [PubMed] [Google Scholar]
- 39.Arakane F, King S R, Du Y, Kallen C B, Walsh L P, Watari H, Stocco D M, Strauss J F., III J Biol Chem. 1997;272:32656–32662. doi: 10.1074/jbc.272.51.32656. [DOI] [PubMed] [Google Scholar]
- 40.Rost B, Sander C. Proc Natl Acad Sci USA. 1993;90:7558–7562. doi: 10.1073/pnas.90.16.7558. [DOI] [PMC free article] [PubMed] [Google Scholar]
- 41.Chou P Y, Fasman G D. Annu Rev Biochem. 1978;47:251–276. doi: 10.1146/annurev.bi.47.070178.001343. [DOI] [PubMed] [Google Scholar]
- 42.King S R, Stocco D M. Endocr Res. 1996;22:505–514. doi: 10.1080/07435809609043739. [DOI] [PubMed] [Google Scholar]
- 43.King, S. R., Liu, Z., Soh, J., Eimerl, S., Orly, J. & Stocco, D. M. (1999) J. Steroid Biochem. Mol. Biol., in press. [DOI] [PubMed]
- 44.Sepuri N B, Schulke N, Pain D. J Biol Chem. 1998;273:1420–1424. doi: 10.1074/jbc.273.3.1420. [DOI] [PubMed] [Google Scholar]
- 45.Ryan K R, Jensen R E. Cell. 1995;83:517–519. doi: 10.1016/0092-8674(95)90089-6. [DOI] [PubMed] [Google Scholar]
- 46.Gaume B, Klaus C, Ungermann C, Guiard B, Neupert W, Brunner M. EMBO J. 1998;17:6497–6507. doi: 10.1093/emboj/17.22.6497. [DOI] [PMC free article] [PubMed] [Google Scholar]


