Abstract
In the presence of moderate (2–4 M) urea concentrations the tetrameric enzyme, glycine N-methyltransferase (GNMT), dissociates into compact monomers. Higher concentrations of urea (7–8 M) promote complete denaturation of the enzyme. We report here that the H176N mutation in this enzyme, found in humans with hypermethioninaemia, significantly decreases stability of the tetramer, although H176 is located far from the intersubunit contact areas. Dissociation of the tetramer to compact monomers and unfolding of compact monomers of the mutant protein were detected by circular dichroism, quenching of fluorescence emission, size-exclusion chromatography, and enzyme activity. The values of apparent free energy of dissociation of tetramer and of unfolding of compact monomers for the H176N mutant (27.7 and 4.2 kcal/mol, respectively) are lower than those of wild-type protein (37.5 and 6.2 kcal/mol). A 2.7 Å resolution structure of the mutant protein revealed no significant difference in the conformation of the protein near the mutated residue.
Keywords: glycine N-methyltransferase, mutant, stability, unfolding, quaternary structure, urea
The mechanism of stabilization of multimeric proteins is especially important for enzymes where an association/dissociation transition is a part of the mechanism of regulation of enzyme activity. The intersubunit contact areas in multimeric proteins are formed as the result of the folding of subunits into a specific tertiary structure. Mutations in those areas can change stability of proteins (Vaughan et al. 1999; Guerois et al. 2002). A less studied problem is how mutations located outside of contact areas could affect intersubunit interactions.
We found that glycine N-methyltransferase is an interesting example of the monomer-multimer stability relationship. GNMT is an abundant mammalian liver enzyme, which catalyzes the transfer of the methyl group from S-adenosylmethionine (AdoMet) to glycine resulting in the synthesis of S-adenosylhomocysteine (AdoHcy) and sarcosine (Heady and Kerr 1973; Ogawa et al. 1988). GNMT is an important part of a regulatory mechanism that maintains a constant ratio of AdoMet/AdoHcy, which is believed to determine the methylation capacity of the cell (Balaghi et al. 1993). The importance of this enzyme in methyl group metabolism was established by discovery of several specific cases of human hypermethionineaemia, which were caused by mutations of GNMT (Luka et al. 2002; Augoustides-Savvopoulou et al. 2003).
Under native conditions GNMT is a tetramer. ▶ shows the crystal structure of human GNMT (Pakhomova et al. 2004). Inside the AB dimer (this is also valid for the symmetry related CD dimer) there are numbers of hydrogen bonds and salt bridges between helices (helices H in ▶), comprised of residues 88–101 from subunit A and the same residues of subunit B. In addition, the β-strands of subunit A and B (residues 205–209; β in ▶) participate in strong antiparallel hydrogen bonding with the same β-strands from the symmetry-related subunits C and D. An interesting feature of the GNMT tetrameric assembly is participation of the N termini in interactions with the active sites of the adjacent subunits. The U-loops (residues 9–20) of each subunit enter the active center of adjacent subunits and close the entrance to it as it is shown in ▶. As a result, each subunit of GNMT interacts with three other subunits by at least 16 hydrogen bonds, several salt bridges, and a cation–pi interaction.
Figure 1.
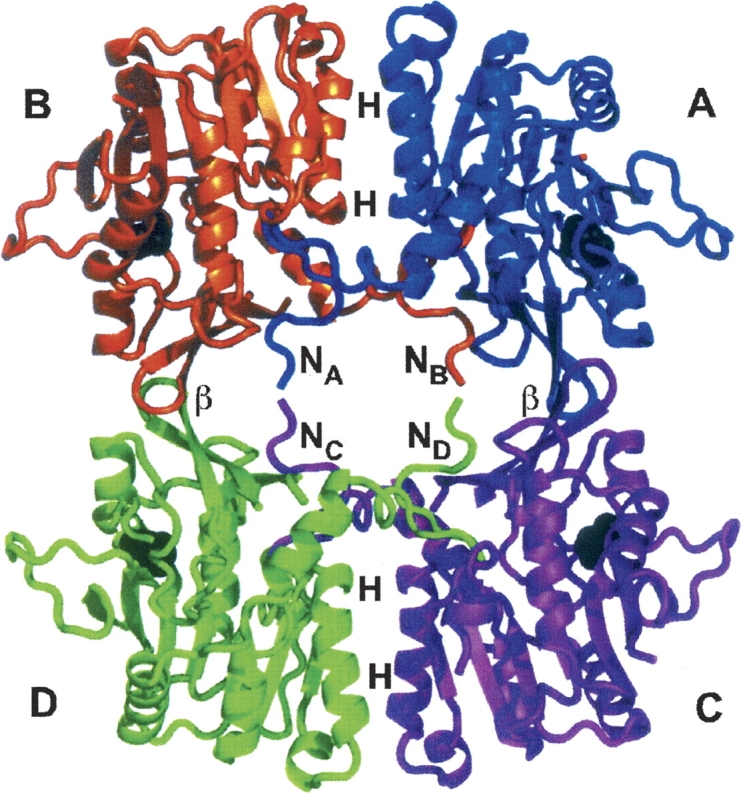
Tetramer of human GNMT. Subunits are differently colored (subunit A, blue; B, orange; C, magenta; D, green). In the flat-shaped tetrameric structure the contacting areas are marked (N, N termini; H, helixes; and β, β-strands). Histidines 176 in all subunits are drawn as black spheres.
Comparative analysis of the kinetic properties and the quaternary, tertiary, and secondary structures of natural mutants of human GNMTs (L49P, N140S, and H176N) with wild-type (WT) enzyme showed that, while the enzymes differ in their kinetics, the overall structures of the mutant proteins are not changed compared to that of the wild type (Luka and Wagner 2003a). The activity of GNMT depends on its quaternary structure. When urea-induced unfolding of human WT GNMT was studied, it was found that the active form of enzyme is a tetramer, and, upon dissociation, the enzyme is completely inactivated (Luka and Wagner 2003b). More detailed analysis was done for the mutant H176N GNMT. This mutant protein exhibited ∼25% less activity compared to WT enzyme most likely due to impaired binding of glycine (Luka and Wagner 2003a). When urea unfolding of that mutant protein was studied, it was found that the quaternary structure was much less stable compared to wild-type GNMT.
To get insight into the mechanism of destabilization of GNMT by H176N mutation we studied this phenomenon by enzyme activity assays, fluorescence spectroscopy, size-exclusion chromatography, circular dichroism, and X-ray crystal structure analysis. Results of the comparison of the structure and stability of the mutant and wild-type enzymes are presented in this work.
Results
Fluorescence spectroscopy
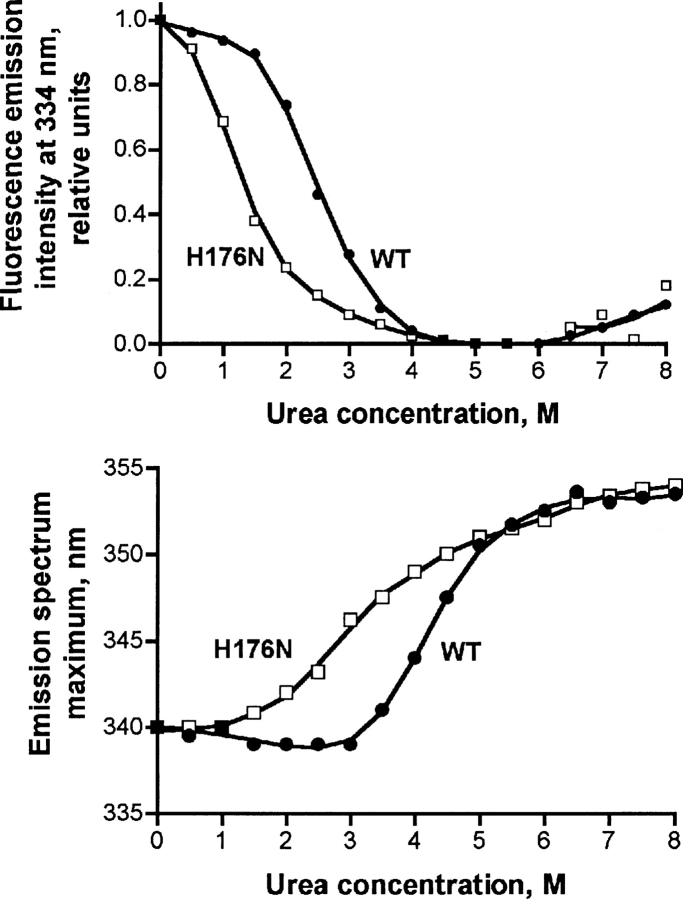
We have previously shown that the first step of human GNMT unfolding by urea was tetramer dissociation with a decrease of intrinsic fluorescence (Luka and Wagner 2003b). Similar dependence of intensity of fluorescence on the urea concentration was observed for the H176N mutant GNMT (▶, top panel) but it was shifted to lower urea concentrations. The shift in urea concentration was about 1.5 M for the mutant GNMT compared with the transition midpoint for the WT protein. Upon unfolding, the emission maximum underwent a red shift due to the exposure of the tryptophan and tyrosine residues to the solvent (▶, bottom panel), and this shift in fluorescence maximum to lower urea concentrations was also seen with the mutant protein. Both data showed the decreased stability of mutant GNMT compared to WT enzyme.
Figure 2.
Analysis of unfolding of WT and H176N mutant GNMT by fluorescence spectroscopy. (Top) Dependence of the intensity of fluorescence emission of GNMTs at 334 nm. (Bottom) Dependence of the maxima of emission spectra. Fluorescence emission spectra were recorded for wild-type (solid circles) and H176N mutant GNMTs (open squares) in 50 mM Tris-HCl, pH 8.0, 150 mM NaCl, 14 mM β-mercaptoethanol. Protein concentration was 0.05 mg/mL, cuvette of 1 cm optical length. The protein fluorescence was excited at 285 nm.
Size-exclusion chromatography
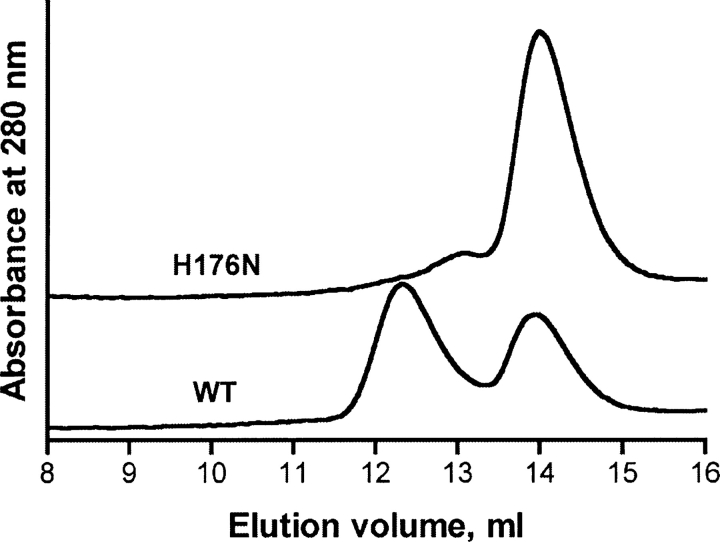
The results of the fluorescence analysis suggested that the mutant tetramer dissociated at a much lower urea concentration compared to the WT enzyme. As shown by the fluorescence data (▶, top panel) at a concentration of 2.5 M urea ∼50% of the tetramer of WT GNMT was dissociated, but dissociation of the N176H mutant protein was nearly complete. This result was confirmed by size-exclusion chromatography. As shown in ▶ at 2.5 M urea concentration wild-type GNMT consisted of two molecular species, tetramer and monomer, with nearly equal amounts of tetramer (elution volume 12.3 mL) and monomers (elution volume 14.0 mL). At the same concentration of urea mutant GNMT was present almost exclusively in monomeric form with an elution volume of 14.0 mL. The tetramer/monomer equilibrium behavior of GNMT during size-exclusion chromatography was experimentally studied in our previous work (Luka and Wagner 2003b).
Figure 3.
Size-exclusion chromatography of wild-type and N176H mutant GNMTs. The 100 μL proteins' samples with concentration 1 μM (tetramer) were applied to a Sepharose-12 column equilibrated with elution buffer (50 mM Tris-HCl, pH 8.0, 150 mM NaCl, 14 mM β-mercaptoethanol, 2.5 M urea) and eluted with the same buffer using a flow rate of 0.5 mL/min. Proteins' elution was monitored by absorbance at 280 nm. Two elution profiles were stacked by ÄKTA Purifier software.
Enzyme activity
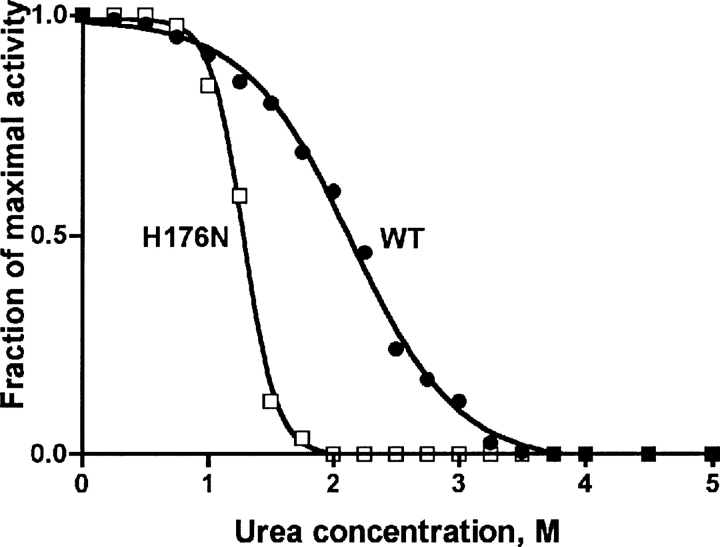
Dissociation of native tetramer of human GNMT leads to inactivation of the enzyme in urea solutions within 1–4 M concentrations' range (Luka and Wagner 2003b). The same inactivation was observed for the H176N mutant protein but this took place at significantly lower urea concentrations. As shown in ▶ the mutant enzyme was completely inactive in 2.0 M urea while the wild-type enzyme possessed ∼60% activity at that urea concentration.
Figure 4.
Dependence of activity of GNMT on urea concentration. Activity was measured in 200 mM Tris-HCl, pH 8.0, 400 μM S-Adenosylmethionine, 5 mM DTT, 20 mM glycine, 0.1 μM GNMT (tetramer), and desired concentration of urea at 25°C. Closed circles, WT; open circles, H176N mutant GNMT.
Circular dichroism spectroscopy
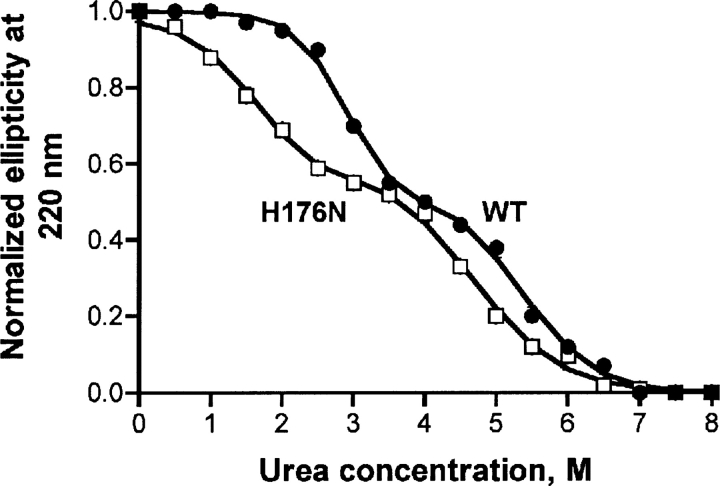
To derive the thermodynamic data describing the unfolding of GNMT the method of circular dichroism (CD) was used. The urea dependence of the CD signal of WT GNMT was clearly a two-step transition with a characteristic shape (Luka and Wagner 2003b). The CD data for the unfolding of mutant GNMT were obtained and compared with those of the WT enzyme at pH 8.0 as shown in ▶. The two-step transition observed in mutant GNMT was similar to that seen for the wild-type protein but both steps of denaturation were shifted to lower urea concentrations. For the mutant GNMT the first unfolding step (tetramer dissociation) was ∼1.2 M urea lower and the second unfolding (monomer unfolding) step was ∼0.8 M lower than the WT protein.
Figure 5.
Study of unfolding of wild-type and H176N mutant GNMTs by circular dichroism. The proteins' CD spectra were recorded in 50 mM Tris-HCl, pH 8.0, 150 mM NaCl, 14 mM β-mercaptoethanol, and different concentrations of urea. Protein concentration was 1.0 μM (tetramer). Spectra were recorded in a 1.0-mm cuvette in the range 250–210 nm. Normalized ellipticity at 220 nm was plotted against urea concentration and these data were fitted to two steps of two-state transitions as explained in Materials and Methods.
Thermodynamic analysis
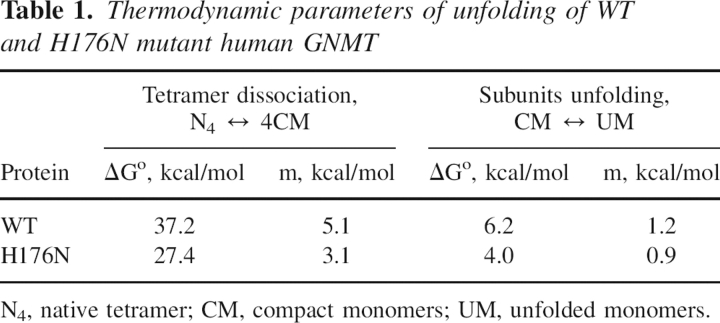
The CD data were used for deriving of thermodynamic data for both transitions for WT and H176N mutant proteins and were obtained by the procedure described in Materials and Methods. The data obtained are presented in ▶. An apparent free energy of tetramer dissociation to compact monomers and full unfolding of compact monomers for the H176N mutant in the absence of urea was significantly lower than that for the WT protein. The fitting procedure was performed assuming that the amplitudes of normalized CD signals of native and fully unfolded GNMT were equal to 1 and 0, respectively. In this case, the fitting procedure predicted the amplitude of compact subunits to be 0.54 for WT GNMT and 0.65 for mutant protein.
Table 1.
Thermodynamic parameters of unfolding of WT and H176N mutant human GNMT
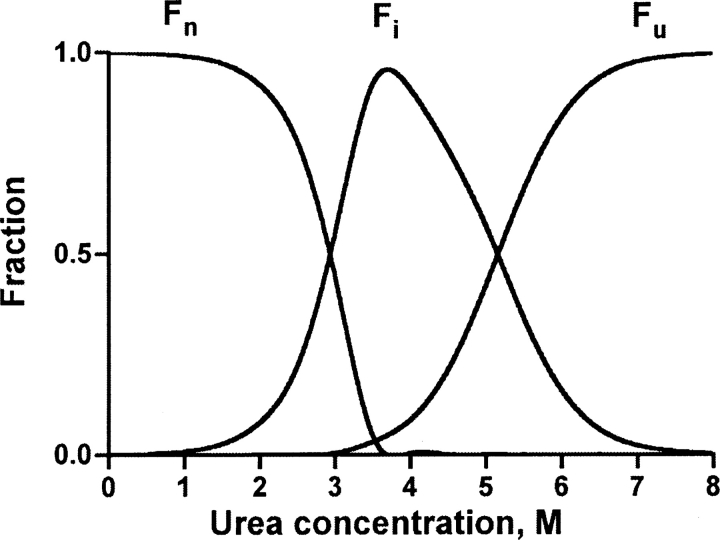
The fractions of all molecular species (tetramer, compact monomers, and unfolded monomers) were calculated and are presented as dependence on urea concentration in ▶. The thermodynamic calculations are in very good agreement with experimental data obtained in SEC experiments (Luka and Wagner 2003b): There was almost no overlap in the fraction of tetramer and fully unfolded monomers with 91% present as compact monomer at a concentration of 3.5 M urea in the case of WT GNMT. The dependence of molecular species on urea concentration for the mutant protein is similar to that of the WT GNMT with a shift to lower urea concentrations (not shown). This analysis of the various fractions that are present at different concentrations of urea explains the difference between the urea concentrations at which the decrease of fluorescence intensity takes place during denaturation and the red shift of the fluorescence emission maximum. Comparison of the data from ▶ and ▶ suggests that the decrease of fluorescence intensity is the result of native tetramer dissociation but the red shift of the fluorescence maximum is the result of the unfolding of the intermediate state of the compact monomers.
Figure 6.
Urea concentration dependence of the distribution of molecular species of GNMT. The fractions of WT GNMT native tetramer Fn, intermediate compact monomers Fi, and unfolded monomers Fu are marked. Fractions were calculated based on the thermodynamic parameters derived by the fitting procedure (▶).
Crystal structure
The crystal structure of H176N mutant is very similar to that of WT protein (Pakhomova et al. 2004). Both the WT and H176N structures contain a citrate molecule co-crystallized in the active site. As in the case of WT GNMT, the asymmetric unit is comprised of a dimer (subunits A and B, related by the twofold NCS). The tetramer assembly (subunits A, B, C, and D) is generated by the application of the crystallographic twofold rotation axis to the dimer AB. Comparison of crystal structures of WT and H176N mutant shows that there is no difference between the WT and the H176N mutant GNMT in the conformation of the residues participating in the intersubunit interactions.
Discussion
The results presented above show that the decreased stability of the H176N mutant of tetrameric GNMT is a function of the stability of the individual subunits. This is due to a shift in the equilibrium between the compact monomers of the tetramer to unfolded monomers as demonstrated by unfolding in urea solutions.
Studies on the structure/stability relationship of T4 lysozyme and other globular proteins showed that the principal interactions that keep globular proteins in their native conformation are hydrophobic interactions (Matthews 1995; Karplus 1997). In general, replacement of hydrophobic residues within the globular part of the molecule by polar residues results in lower stability (Matthews 1995). In addition, the environment in which the substitution occurs must also be considered. For example, replacement of arginine 96 by histidine in T4 lysozyme resulted in additional hydrogen bonds provided by the added histidine. In spite of this, the stability of the protein decreased (Kitamura and Sturtevant 1989; Weaver et al. 1989). The effect of the introduction or replacement of histidine in a structure is particularly difficult to predict since it depends on its protonation state, which is determined by its interaction with neighboring residues (Loewenthal et al. 1992; Edcomb and Murphy 2002).
Although the stability of the H176N mutation is markedly decreased, there is very little change in structure. Only minor differences are seen between the interactions of the residues surrounding H176 in the WT structure and N176 in the mutant structure as it is shown in ▶ for one of the subunits. Residue 176 is buried within the hydrophobic interior. In the tertiary structure of GNMT H176 or N176 is located on the β-strand containing residues 170–178 that participate in the antiparallel interaction with the β-strand 284–293. As shown in ▶, both these strands interact with helix 249–260. The interaction between the two strands and helix in WT GNMT is completely hydrophobic with residues I174, H176, L249, F252, L256, F286, and H288 located between helix 249–260 and β-strands 170–178 and 284–293. There is no possibility for hydrogen bonding between H176 and H288 because the distance between ND1 atom of H176 and NE2 atom of H288 is 3.7 Å. An important feature of helix 249–260 is that it is positioned on the surface of the subunit and interacts with the protein globule only through contacts with β-strands 170–178 and 284–293.
Figure 7.
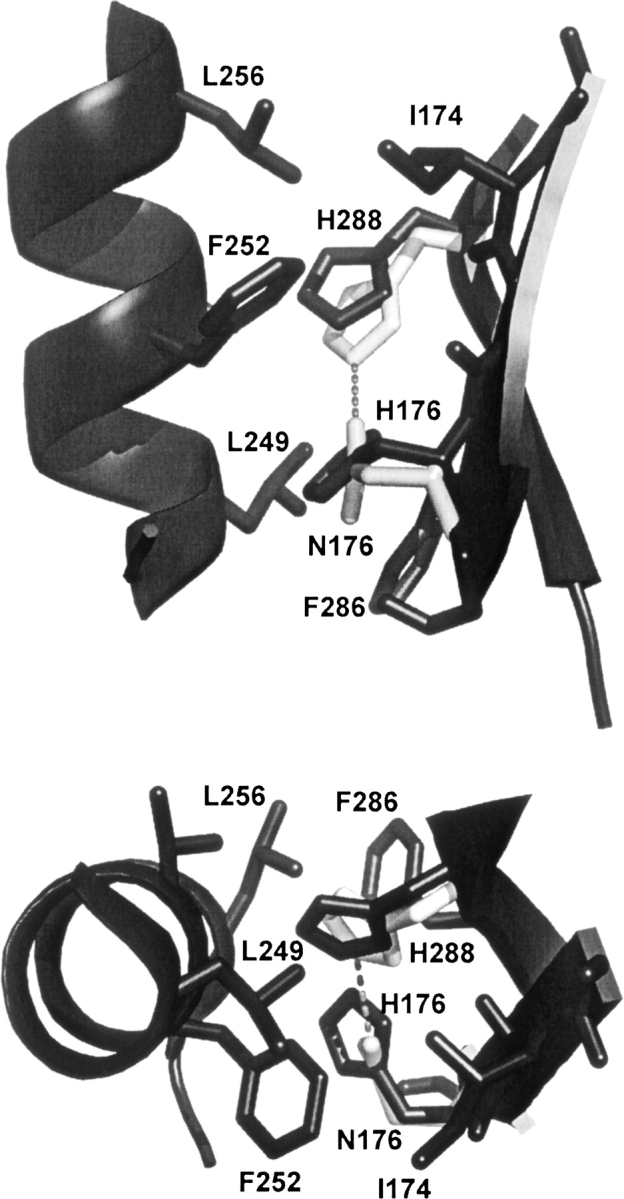
Histidine and asparagine 176 interactions with neighboring residues. Such interactions are seen in all subunits and are shown here in detail for subunit A. The fragments of structures of subunits A of WT (black) and H176N mutant (light gray) GNMT in cartoon representation are superimposed. Only residues which participate in interaction of β-strands 170–178 and 284–293 with helix 249–260 are shown. The hydrogen bond between N176 and H288 is shown as a dashed line. Interacting fragments are shown in two projections.
The overall positions of all residues around N176 in mutant GNMT are the same as in the WT protein except in the mutant where there is a small rotation of H288. The major difference between the two structures is that in the mutant there is a stronger interaction of N176 with H288. There is a hydrogen bond between the OD1 atom of H176 and the NE2 atom of H288 with a distance of 3.06 Å in subunit A and 3.08 Å in subunit B as it is shown in ▶.
Thus, the reason for the lower stability of the H176N mutant GNMT is not a decrease in the number of hydrogen bonds but the loss of the hydrophobic interactions in which H176 participated in the WT protein. It appears that interaction of the two antiparallel β-strands 170–178 and 284–293 with the helix 249–260 is an important contributor to the stability of GNMT, with H176 playing an important part.
When histidine 176 is replaced by asparagine the polar moiety is introduced into the highly hydrophobic interior (interacting β-strands 170–178, 284–293, and helix 249–260). Such a change should cause destabilization of that interaction since histidine is more hydrophobic than asparagine. The difference in hydrophobicity between side chains of histidine and asparagine was found to be 1.40 kcal/mol (Karplus 1997). The destabilizing effect we found for H176N mutation is about 2 kcal.
The glycine N-methyltransferase mutant H176N showed only small changes in kinetic parameters compared to the WT enzyme with a Km value for glycine increased about twofold (Luka and Wagner 2003a). The proposed binding site for glycine was shown to be R175 in the rat enzyme (Huang et al. 2000; Takata et al. 2003). In human GNMT the corresponding residue is R177, adjacent to H176. Since the H176N mutant is less stable, this may be the reason for the higher Km value for glycine.
Materials and Methods
Protein preparation
The cloning of human wild-type and mutated GNMT cDNAs in the pET-17b expression vector and proteins expression was reported earlier (Luka and Wagner 2002, 2003a). The GNMT proteins were isolated and purified by ammonium sulfate precipitation from the crude extract and ion-exchange chromatography on a DE-52 column. After a final step using chromatography on a Sephacryl S-200 size-exclusion column GNMT, preparations with purity of 96%–98% were obtained.
GNMT activity
GNMT activity was assayed using the charcoal adsorption method described earlier (Wagner et al. 1985). Enzyme activity assay in urea solutions was done as reported earlier (Luka and Wagner 2002). Briefly, GNMT activity was assayed in the reaction mixture with component concentrations of 200 mM Tris-HCl, pH 8.0, 400 μM [3H-CH3]-S-adenosylmethionine, 5 mM DTT, 20 mM glycine, 0.1 μM GNMT (tetramer), and desired concentrations of urea at 25°C. Proteins in all unfolding experiments were incubated at 25°C for 1 h with urea before mixing with substrates. The working solutions containing urea were prepared by dilution from a fresh 10 M urea stock solution.
Size-exclusion chromatography
SEC was done on the ÄKTA Purifier System (Amersham Pharmacia Biotech.) using a Superose 12 column in column buffer containing 50 mM Tris-HCl, pH 8.0, 150 mM NaCl, and 14 mM β-mercaptoethanol at a flow rate of 0.5 mL/min at 22°C as reported earlier (Luka and Wagner 2003b). The elution of the proteins was monitored by absorbance at 280 nm. The column was calibrated with cytochrome C, lysozyme, chymotrypsin, carbonic anhydrase, ovalbumin, BSA, alcohol dehydrogenase, potato beta-amylase, and aldolase in the column buffer without urea and in the presence of 8 M urea.
Fluorescence spectroscopy
Protein fluorescence spectra were recorded on a Perkin-Elmer 650–40 Fluorescence Spectrophotometer (Perkin-Elmer Corp.) and on a Cary Eclipse Fluorescence Spectrophotometer (Varian, Inc.). Fluorescence emission spectra were recorded from 300 to 400 nm with slits of 5 nm in a 10-mm cuvette at 22°C in the same buffer as used for SEC. Simultaneous intrinsic tryptophan and tyrosine fluorescence was measured with excitation at 285 nm, and tryptophan fluorescence was measured with excitation at 295 nm. The protein concentrations were 0.05–0.13 mg/mL with absorbance values not higher than 0.1 at the excitation wavelength to avoid the inner filter effect.
CD spectroscopy
CD spectra were recorded on Jasco-720 and Jasco-820 spectropolarimeters in a cell with an optical path length of 1.0 mm with a scan speed of 10 nm/min, sensitivity of 20 mdeg, resolution 1 nm, and a time constant of 2 sec. The spectral data were obtained in the range of 250–210 nm four times, averaged and smoothed by the instrument software. The protein was in the same buffer as used in SEC with concentration of the samples at 0.13 mg/mL (1 μM of tetramer). The spectropolarimeters were calibrated with D(−)-pantolactone.
Protein assay
The concentration of protein samples was determined by the BCA method (BCA Protein Assay kit, Pierce) by using bovine serum albumin as a standard. Protein purity was determined by SDS electrophoresis.
Unfolding data analysis
The thermodynamic analysis of the unfolding transition was done by analysis of the data obtained by CD according to a three-state model, which was found to be the case in human WT GNMT urea induced unfolding. Data for WT GNMT on fluorescence, activity, and circular dichroism are reprinted with permission from Elsevier© 2003 (Luka and Wagner 2003b):
 |
where N, U, and I are the native, unfolded, and intermediate (compact monomers) states. K1 and K2 are the unfolding equilibrium constants of the corresponding steps.
If the total molar concentration of protein is Pt in terms of mole of monomers, then
and the molar fraction of each species is: Fn = 4[N4]/Pt, Fi = [I]/Pt, and Fu = [U]/Pt.
The sum of the molar fractions is equal to 1:
The equilibrium constants K1 and K2 in terms of molar fractions are:
 |
If Y is the amplitude of the spectroscopic signal and Yn, Yi, and Yu are amplitudes of the signals of native, intermediate, and unfolded states of the protein, then
For normalized data Yu = 0 and Yn = 1, then
 |
Relations of equilibrium constants to change of free energy of two transitions of GNMT unfolding process are expressed as:
and
where R is the gas constant (1.987 cal/mol*K) and T is the temperature in Kelvin.
By assuming that free energy for each step linearly depends on urea concentration the ΔG could be expressed in terms of ΔGo as the change of free energy of unfolding in the absence of denaturant
where ΔGo is the free energy change in the absence of urea and m1 and m2 are dependence of the free energy change upon urea concentration for steps 1 and 2.
FromEquations 8–11 expressions for K1 and K2 can be written as:
By substitutions and rearrangements of Equation 3 we can write as:
Equation 14 was solved by Mathematica 5 for Fi as in Mateu and Fersht (1998), and one of the four solutions, that has a physical meaning, was used for the fitting procedure. The latter was done by fitting the parameter Y (Equation 7) to the experimental data by using the “Statistics NonlinearFit” package from Mathematica 5. The parameters Yi, ΔGo 1, ΔGo 2, m1, and m2 were fitted. The solution of Equation 14 gives the fraction of Fi and subsequent solution of Equation 3 gives the fractions of Fn and Fu.
Protein crystallization
Crystals of H176N mutant of human GNMT were grown at 4°C by the hanging-drop vapor diffusion method after mixing 1 μL of the enzyme at 8.4 mg/mL in 50 mM Tris-HCl, pH 8.0, 200 mM NaCl, 14 mM β-mercaptoethanol, 1 mM EDTA with 1 μL of the reservoir solution (10% [w/v] polyethylene glycol 4000, 0.1 M Na-citrate pH 5.8, 5% glycerol). Crystals usually appeared overnight and grew to full size within 1–2 d.
Data collection
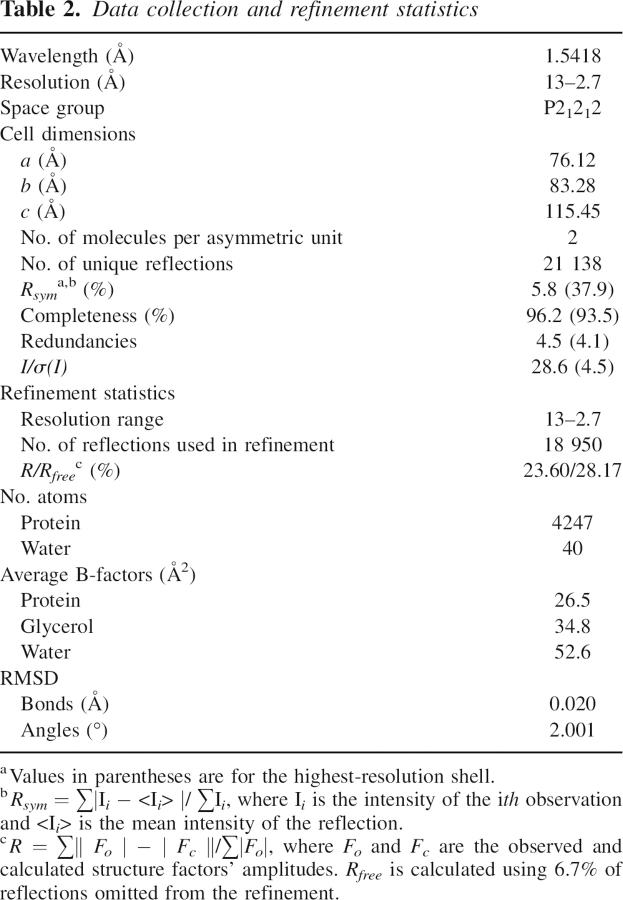
Prior to data collection, a suitable crystal was dipped for 30 sec in a modified mother solution with the addition of 20% ethylene glycol as a cryoprotectant. Diffraction data were collected at 100°K with a cryo-stream cooler from Oxford Cryojet with a 345-mm MAR Research imaging plate detector mounted on a NONIUS FR591 rotating anode generator (CuKα radiation). Data were processed with Mosflm (Rossmann and van Beek 1999) and scaled using Scala (Collaborative Computational Project, Number 4, 1994). Data collection and processing statistics are given in ▶.
Table 2.
Data collection and refinement statistics
Crystal structure determination
The crystal structure was solved by the molecular replacement procedure as implemented in the CNS package (Adams et al. 1997). A dimer of the human GNMT (PDB accession code 1R74) was used as a search model. The positioned MR model was refined using the maximum likelihood refinement in REFMAC (Adams et al. 1997). Twofold noncrystallographic symmetry restraints as well as bulk solvent corrections were applied. The program O (Jones et al. 1991) was used to build the initial models, and throughout the refinement.
No significant electron density was observed for residues 1–4, 127–128, 225–235 of subunit A, and 1–4, 127–128, 226–235 of subunit B, an indication that these regions are highly mobile or disordered. An electron density in the Fo − Fc map, which can be attributed to a citrate molecule, was found in the active site. Additional electron densities on cysteines 187, 284 (subunit A) and 187, 248, 284 (subunit B) were interpreted as coming from covalently bound β-mercaptoethanol (BME) molecules as the protein buffer contained BME. The final model consisted of residues 5–126, 129–224, 236–293 and 5–126, 129–225, 236–293 for subunits A and B, respectively, two citrate molecules, one chloride ion, and 40 water molecules. The protein molecules display good stereochemistry with 87.5% of nonglycine residues falling in the most favored regions of a Ramachandran plot and none in disallowed regions. Refinement statistics are listed in ▶. The refined coordinates have been deposited to the Protein Data Bank with the accession code 2AZT.
Acknowledgments
We would like to acknowledge support from NIH grants DK15289 to C.W. and from Louisiana Governor's Biotechnology Initiative to M.E.N.
Footnotes
Reprint requests to: Conrad Wagner, Vanderbilt University Medical Center, Department of Biochemistry, 620 Light Hall, Nashville, TN 37232, USA; e-mail: Conrad.Wagner@vanderbilt.edu; fax: (615) 343-0407.
Article published online ahead of print. Article and publication date are at http://www.proteinscience.org/cgi/doi/10.1110/ps.072921507.
References
- Adams P.D., Pannu, N.S., Read, R.J., and Brunger, A.T. 1997. Cross-validated maximum likelihood enhances crystallographic simulated annealing refinement. Proc. Natl. Acad. Sci. 94 5018–5023. [DOI] [PMC free article] [PubMed] [Google Scholar]
- Augoustides-Savvopoulou P., Luka, Z., Karyda, S., Stabler, S.P., Allen, R.H., Patsiaoura, K., Wagner, C., and Mudd, S.H. 2003. Glycine N methyltransferase deficiency: A new patient with a novel mutation. J. Inherit. Metab. Dis. 26 745–759. [DOI] [PubMed] [Google Scholar]
- Balaghi M., Horne, D.W., and Wagner, C. 1993. Hepatic one-carbon metabolism in early folate deficiency in rats. Biochem. J. 291 145–149. [DOI] [PMC free article] [PubMed] [Google Scholar]
- Collaborative Computational Project, Number 4 1994. The CCP4 suite: Programs for protein crystallography. Acta Crystallogr D Biol. Crystallogr. 50 760–763. [DOI] [PubMed] [Google Scholar]
- Edcomb S.P. and Murphy, K.P. 2002. Variability in the pKa of histidine side- chains correlates with burial within proteins. Protein Struct. Funct. Genet. 49 1–6. [DOI] [PubMed] [Google Scholar]
- Guerois R., Nielsen, J.E., and Serrano, L. 2002. Predicting changes in the stability of proteins and protein complexes: A study of more than 1000 mutations. J. Mol. Biol. 320 369–387. [DOI] [PubMed] [Google Scholar]
- Heady J.E. and Kerr, S.J. 1973. Purification and characterization of glycine N-methyltransferase. J. Biol. Chem. 248 69–72. [PubMed] [Google Scholar]
- Huang Y., Komoto, J., Konishi, K., Takata, Y., Ogawa, H., Gomi, T., Fujioka, M., and Takusagawa, F. 2000. Mechanisms for auto-inhibition and forced product release in glycine N- methyltransferase: Crystal structures of wild-type, mutant R175K and S- adenosylhomocysteine-bound R175K enzymes. J. Mol. Biol. 298 149–162. [DOI] [PubMed] [Google Scholar]
- Jones T.A., Zou, J.Y., Cowan, S.W., and Kjeldgard, M. 1991. Improved methods for building protein models in electron density maps and the location of errors in these models. Acta Crystallogr. A 4 110–119. [DOI] [PubMed] [Google Scholar]
- Karplus P.A. 1997. Hydrophobicity regained. Protein Sci. 6 1302–1307. [DOI] [PMC free article] [PubMed] [Google Scholar]
- Kitamura S. and Sturtevant, J.M. 1989. A scanning calorimetric study of the thermal denaturation of the lysozyme of phage T4 and the Arg 96- His mutant form thereof. Biochemistry 28 3803–3807. [DOI] [PubMed] [Google Scholar]
- Loewenthal R., Sancho, J., and Fersht, A.R. 1992. Histidine-aromatic interactions in barnase. Elevation of histidine pKa and contribution to protein stability. J. Mol. Biol. 224 759–770. [DOI] [PubMed] [Google Scholar]
- Luka Z. and Wagner, C. 2002. Expression and purification of glycine N- methyltransferases in Escherichia coli . Protein Expr. Purif. 20 280–286. [DOI] [PubMed] [Google Scholar]
- Luka Z. and Wagner, C. 2003a. Effect of naturally occurring mutations in human glycine N-methyltransferase on activity and conformation. Biochem. Biophys. Res. Commun. 312 1067–1072. [DOI] [PubMed] [Google Scholar]
- Luka Z. and Wagner, C. 2003b. Human glycine N-methyltransferase is unfolded by urea through compact subunit state. Arch. Biochem. Biophys. 420 153–160. [DOI] [PubMed] [Google Scholar]
- Luka Z., Cerone, R., Phillips III, J.A., Mudd, S.H., and Wagner, C. 2002. Mutations in human glycine N-methyltransferase give insights into its role in methionine metabolism. Hum. Genet. 110 68–74. [DOI] [PubMed] [Google Scholar]
- Mateu M.G. and Fersht, A.R. 1998. Nine hydrophobic side chains are key determinants of the thermodynamic stability and oligomerization status of tumour suppressor p53 tetramerization domain. EMBO J. 17 2748–2758. [DOI] [PMC free article] [PubMed] [Google Scholar]
- Matthews B.W. 1995. Studies on protein stability with T4 lysozyme. Adv. Protein Chem. 46 249–278. [DOI] [PubMed] [Google Scholar]
- Ogawa H., Gomi, T., Takusagawa, F., and Fujioka, M. 1988. Structure, function and physiological role of glycine N-methyltransferase. Int. J. Biochem. Cell Biol. 30 13–26. [DOI] [PubMed] [Google Scholar]
- Pakhomova S., Luka, Z., Grohmann, S., Wagner, C., and Newcomer, M.E. 2004. Glycine N-methyltransferases: A comparison of the crystal structures and kinetic properties of recombinant human, mouse and rat enzymes. Proteins 57 331–337. [DOI] [PubMed] [Google Scholar]
- Rossmann M.G. and van Beek, C.G. 1999. Data processing. Acta Crystallogr. D Biol. Crystallogr. 55 1631–1640. [DOI] [PubMed] [Google Scholar]
- Takata Y., Huang, Y., Komoto, J., Yamada, T., Konishi, K., Ogawa, H., Gomi, T., Fujioka, M., and Takusagawa, F. 2003. Catalytic mechanism of glycine N-methyltransferase. Biochemistry 42 8394–8402. [DOI] [PubMed] [Google Scholar]
- Vaughan C.K., Buckle, A.M., and Fersht, A.R. 1999. Structural response to mutation at a protein-protein interface. J. Mol. Biol. 286 1487–1506. [DOI] [PubMed] [Google Scholar]
- Wagner C., Briggs, W.T., and Cook, R.J. 1985. Inhibition of glycine N- methyltransferase activity by folate derivatives: Implications for regulation of methyl group metabolism. Biochem. Biophys. Res. Commun. 127 746–752. [DOI] [PubMed] [Google Scholar]
- Weaver L.H., Gray, T.M., Grutter, M.G., Anderson, D.E., Wozniak, J.A., Dahlquist, F.W., and Matthews, B.W. 1989. High-resolution structure of the temperature-sensitive mutant of phage lysozyme, Arg 96-His. Biochemistry 28 3793–3797. [DOI] [PubMed] [Google Scholar]


