

Abstract
Relative to other parvalbumin isoforms, the mammalian β-parvalbumin (oncomodulin) displays attenuated divalent ion affinity. High-resolution structural data for the Ca2+-bound protein have provided little insight into the physical basis for this behavior, prompting an examination of the unliganded state. This article describes the solution structure and peptide backbone dynamics of Ca2+-free rat β-parvalbumin (β-PV). Ca2+ removal evidently provokes significant structural alterations. Interaction between the D helix and the AB domain in the Ca2+-bound protein is greatly diminished in the apo-form, permitting the D helix to straighten. There is also a significant reorganization of the hydrophobic core and a concomitant remodeling of the interface between the AB and CD-EF domains. These modifications perturb the orientation of the C and D helices, and the energetic penalty associated with their reversal could contribute to the low-affinity signature of the CD site. By contrast, Ca2+ removal causes a comparatively minor perturbation of the E and F helices, consistent with the more typical divalent ion affinity observed for the EF site. Ca2+-free rat β-PV retains structural rigidity on the picosecond–nanosecond timescale. At 20°C, the majority of amide vectors show no evidence for motion on timescales above 20 ps, and the average order parameter for the entire molecule is 0.92.
Keywords: calcium-binding protein, EF-hand protein, parvalbumin, oncomodulin, NMR, structure, dynamics
The role of Ca2+ in eukaryotic signal transduction (Berridge et al. 2003; Berridge 2004, 2005) is facilitated by myriad Ca2+-binding proteins. Many of these exhibit a metal ion-binding site consisting of a central binding loop and flanking helical segments. This motif is commonly known as the “EF-hand” because the arrangement of the loop and helices can be mimicked with the fingers of the right hand (Kretsinger 1980; Kawasaki and Kretsinger 1995; Celio et al. 1996).
Within the binding loop, the ligands to the bound ion are positioned at the vertices of an octahedron and, accordingly, are referenced by the axes of a Cartesian coordinate system (Kretsinger 1980; Strynadka and James 1989). The −y ligand is a backbone carbonyl; −z is a nearly invariant glutamate; and −x is frequently water. The remaining ligands are side-chain oxygen atoms. Because the −z glutamate binds Ca2+ in a bidentate manner, the coordination geometry is actually pentagonal bipyramidal. Despite the general similarity of their binding sites, EF-hand proteins exhibit broad variation in divalent ion-binding properties. The physical basis for the diverse behavior remains poorly understood.
Parvalbumins are small (12 kDa), vertebrate-specific EF-hand proteins (Heizmann and Kagi 1989; Pauls et al. 1996a). In fact, the crystal structure of carp parvalbumin (PV) established the EF-hand paradigm (Kretsinger and Nockolds 1973). The PV molecule includes six α-helices (A–F) organized into two domains—the AB domain (residues 1–38) and the CD-EF domain. The two metal ion-binding sites, the CD and EF sites, are named for the adjacent helices. In the Ca2+-bound protein, they are related by an approximate twofold symmetry axis and are linked by a short fragment of antiparallel β structure.
The PV family includes α and β sublineages (Goodman and Pechere 1977; Moncrief et al. 1990), which can be distinguished on the basis of isoelectric point, C-terminal helix length, and several lineage-specific sequence assignments. Mammals express one α-PV and one β-PV (Fohr et al. 1993). The α-PV isoform serves as a cytoplasmic Ca2+ buffer in diverse tissue settings. The distribution of the β isoform, also called oncomodulin, is more limited. Until recently, the outer hair cell population in the organ of Corti was believed to be the sole site for expression in postnatal mammals (Henzl et al. 1997; Sakaguchi et al. 1998). However, Benowitz and colleagues have shown that oncomodulin is secreted by activated macrophages and functions as a potent nerve growth factor for retinal ganglion cells (Yin et al. 2006).
Despite 49% sequence identity with the rat α isoform (Berchtold and Means 1985; Gillen et al. 1987), rat β-PV exhibits substantially lower affinity for divalent ions (Hapak et al. 1989; Cox et al. 1990). In HEPES-buffered saline, at pH 7.4, the ΔΔG°′ for Ca2+ is 3.6 kcal/mol. When K+ is the major solvent cation, this difference increases to 5.5 kcal/mol (Henzl et al. 2004b).
Although high-resolution structures are available for the Ca2+-bound α- and β-parvalbumins from rat (Ahmed et al. 1993; McPhalen et al. 1994; Bottoms et al. 2004) and human (Babini et al. 2004; Baig et al. 2004), they offer little insight into the atypical metal ion-binding properties of the β isoform. It has been suggested that the unliganded state of the mammalian β-PV influences the divalent ion-binding signature (Henzl et al. 2004a). Reasoning that detailed structural information might help to clarify this issue, we have determined the solution structure and examined the peptide backbone dynamics of Ca2+-free rat β-PV. Our findings are described herein.
Results
Resonance assignments
The 108-residue sequence of rat β-PV includes two proline residues (MacManus et al. 1983; Gillen et al. 1987). The protein is acidic (pI 3.85), with a predicted net charge of −14 at pH 6.0. Due, perhaps, to its highly anionic character, rat β-PV exhibits no tendency to self-associate at the concentrations employed for NMR spectroscopy, in either the Ca2+-free or -bound forms (Henzl et al. 2002). At 20°C, the apo-protein exhibits a well-resolved 1H-15N HSQC spectrum (▶), which differs perceptibly from that collected on the Ca2+-loaded protein under the same conditions (Supplemental Fig. S1). Except for G56, which is weak, all of the expected 105 amide signals are readily discernible. The following pairs of resonances are highly overlapped: I5/Y65, I11/A12, D22/F49, D45/F66, D53/R75, and Q42/S108.
Figure 1.

(A) 1H-15N HSQC spectrum of Ca2+-free rat β-PV in 0.15 M NaCl, 0.01 M Mes (pH 6.0), at 20°C. (B) Expanded view of the crowded central region.
Complete backbone assignments (HN, N, Cα, Hα, Cβ, C′) were made using a suite of three-dimensional, triple-resonance experiments. Representative strip plots for residues 31–41 are displayed in Supplemental Figure S2. Side-chain aliphatic carbon assignments were likewise complete, neglecting the carboxylate (Asp, Glu), carboxamide (Asn, Gln), and guanidinium (Arg) carbon atoms. Side-chain proton assignments (aliphatic and aromatic) were 96% complete, lacking chemical shifts for the Hζ atoms of the 8 Phe residues; Hδ2, Hɛ1, and Hɛ2 of His-107 and Hη11, Hη12, Hη21, and Hη22 of Arg-48 and Arg-75. Assignments were made for just half of the Cδ-and Cɛ-ring carbons of Phe and Tyr, and the Cγ and Cζ carbons were left unassigned.
The tabulated chemical shifts served as input for CSI and TALOS. The former returned ϕ and ψ estimates for 62 residues. The latter provided “good” ϕ,ψ predictions for 47 residues. CSI identified the following helical regions—residues 8–17, 27–36, 40–49, 61–67, 79–88, and 99–105.
Solution structure of Ca2+-free rat β-parvalbumin
The tertiary structure of Ca2+-free rat β-PV was calculated with distance, dihedral, and RDC restraints (▶, Supplemental Fig. S3). ▶ displays an ensemble of the 20 lowest-energy conformers. Relative to the ensemble average, the RMSD is 0.39 Å for the backbone atoms (Cβ, Cα, C′, O, and N) and 0.99 Å for all heavy atoms. According to PROCHECK, 97% of the observed ϕ,ψ combinations reside in allowed regions of the Ramachandran plot. The structures exhibit good agreement with the experimental restraints. On average, there are just 3.7 NOE violations in excess of 0.5 Å. Fewer than 7% of the CSI and TALOS restraints are violated by more than 5°, and the RMSD between the calculated and observed RDC values is 0.77 Hz. ▶ summarizes the structural quality statistics for the ensemble.
Table 1.
List of restraints and statistical analysis for the apo-rat β-PV solution structure
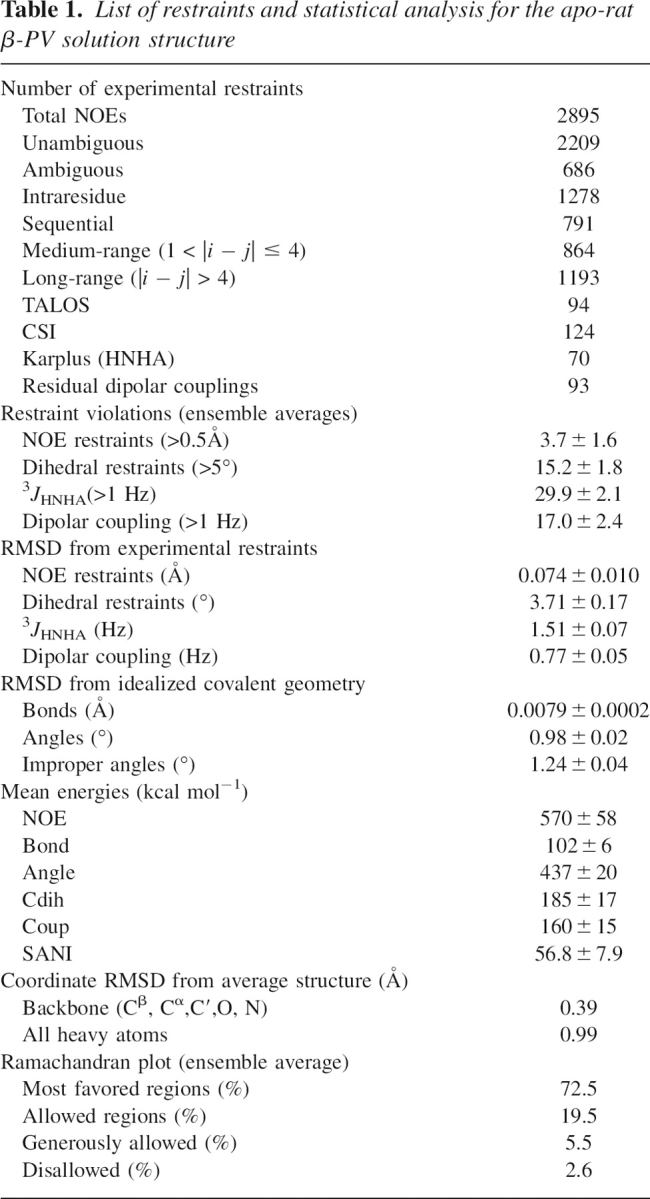
Figure 2.
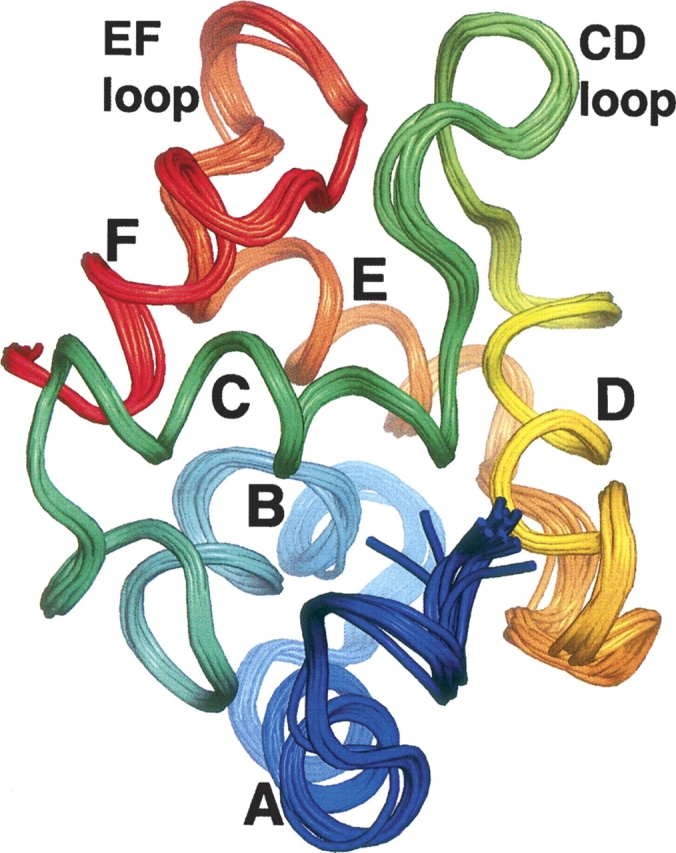
Solution structure of Ca2+-free rat β-PV. An ensemble of the 20 lowest energy structures determined with ARIA-CNS. This figure and ▶, ▶, and ▶ were produced with PyMOL (DeLano 2002).
Comparison of the Ca2+-bound and Ca2+-free β-PV structures
The representative Ca2+-free structure is shown superimposed on the crystal structure of the Ca2+-bound protein (PDB 1RR0) in ▶. Removal of Ca2+ evidently provokes significant structural alterations. Although the relative positions of helices A, B, and F remain largely unchanged in the apo-protein, the C, D, and E helices have undergone substantial reorientation. There has also been some reshuffling of the side chains comprising the hydrophobic core, which results in modification of the interface between the AB and CD-EF domains.
Figure 3.
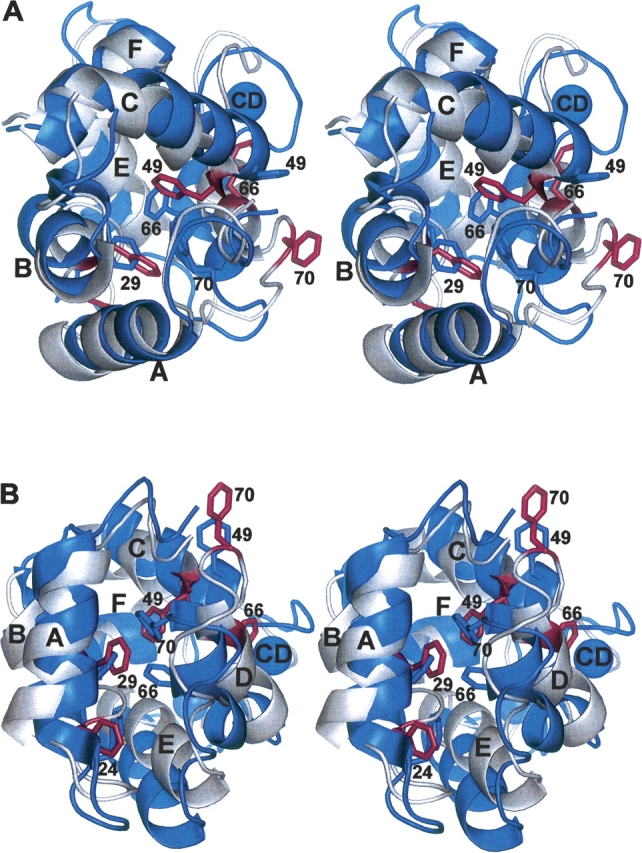
Stereoviews of the superimposed structures of Ca2+-free (silver) and Ca2+-bound (blue) rat β-PV. The two structures were superimposed so as to minimize the RMSD of the AB domain. The view in panel B represents an approximate 90° rotation about the horizontal axis of the view in panel A. Select phenylalanine side chains have been colored blue in the Ca2+-loaded protein and magenta in the apo-protein. The coordinates for the Ca2+-bound structure were obtained from a 1.3 Å crystal structure (PDB 1RRO) (Ahmed et al. 1993).
▶ displays the changes in the interhelical contact area that accompany Ca2+ removal. Helix D exhibits sharply reduced contact with the A and B helices and significantly reduced contact with helix F. Conversely, increased interaction is observed between the BC, BE, and CE helix pairs. The F helix displays perceptibly greater association with helices C and E and modestly diminished association with helix B. The interhelical contact values for the apo- and Ca2+-loaded forms are listed in Supplemental Table S1.
Figure 4.
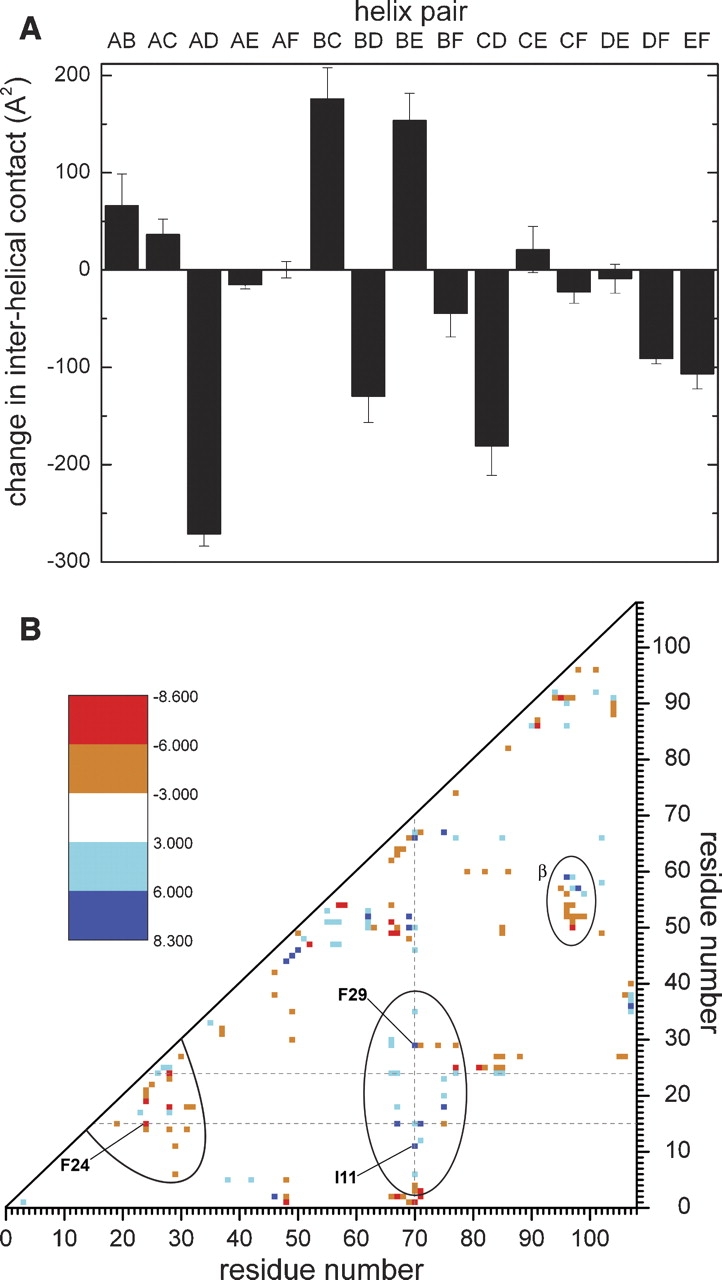
(A) Interhelical contacts in the Ca2+-free and Ca2+-bound forms of rat β-PV. The change in interhelical contact area that accompanies the removal of Ca2+ is plotted for each of the helix pairs. (B) Difference contact matrix. Orange/red symbols represent residue pairs with significantly increased contact in the apo-protein; cyan/blue symbols represent residue pairs with decreased contact in the apo-protein. For clarity, only differences that exceed the variance by at least a factor of three are shown. Details of the calculations are provided in Materials and Methods.
▶ offers further insight into the extent of the structural rearrangement, displaying alterations in pairwise residue contacts. For clarity, only the more prominent changes have been displayed. Cyan and blue represent decreases in the contact surface area that accompany Ca2+ removal; orange and red represent increased interresidue contact. Three regions of the graph have been emphasized. The central ellipse highlights interactions between the AB and CD-EF domains that are significantly diminished in the apo-protein. The bounded region near the lower left corner underscores interactions within the AB domain that increase with Ca2+ removal. The small ellipse near the right edge corresponds to altered pairwise interactions at the interface of the CD and EF metal ion-binding loops.
Total contact between the AB and CD-EF domains, 1959 Å2 in the crystal structure, is essentially unchanged in the apo-protein (1987 ± 60 Å2). However, the agreement of these two values is misleading. In fact, the apolar interdomain contact area has decreased from 1501 Å2 to 1363 ± 38 Å2 with removal of Ca2+, a reduction of 9.2% ± 2.5%. This decrease is masked by a compensatory change in polar surface area, the latter occurring almost entirely at the periphery of the protein.
F70 evidently occupies a strategic position in the Ca2+-bound protein, anchoring the C terminus of helix D to the AB domain. This interdomain association, which requires substantial bending of the D helix, is apparently absent in the Ca2+-free state. As shown in ▶ and ▶, F70 and F66 have both withdrawn from the hydrophobic core. Their displacement is accompanied by straightening of helix D. Relative to its position in the Ca2+-bound protein, the α-carbon of F70 is displaced by 9 Å. As shown in ▶, F70 experiences loss of contact with L6, I11, L15, F29, and L35. Significantly diminished contact is also observed between the AB domain and residues 66, 67, and 75.
Figure 5.
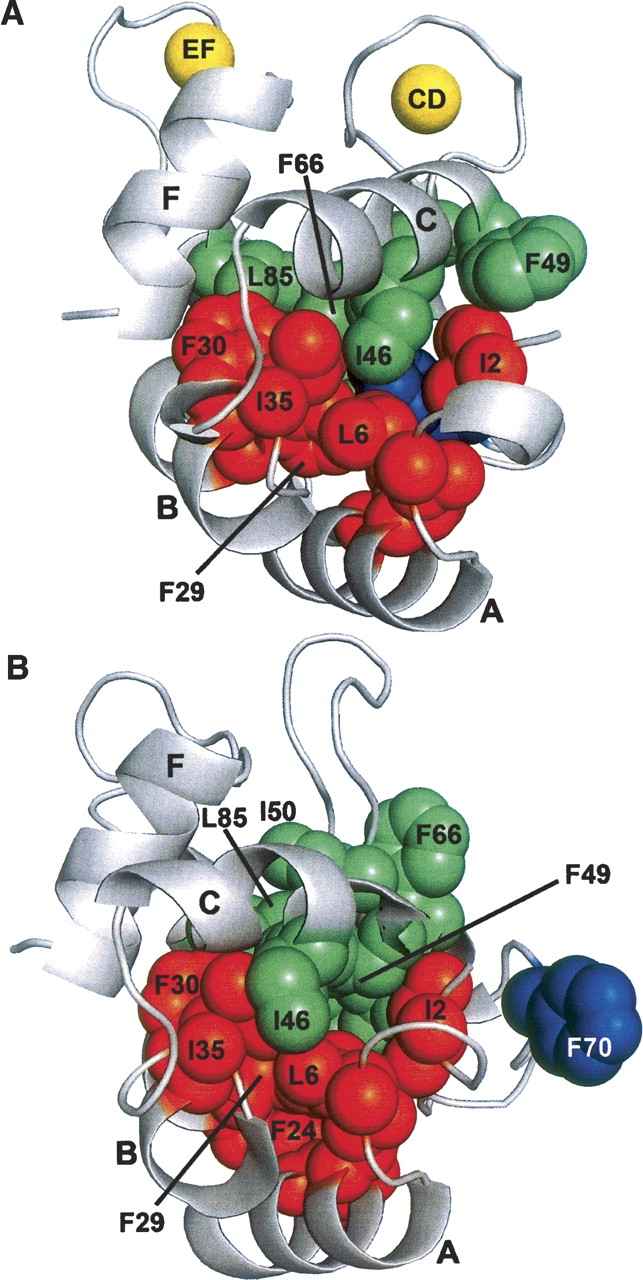
Ca2+ removal provokes rearrangement of the hydrophobic core. (A) In the Ca2+-bound protein, F70 is deeply buried in the protein interior, intimately associated with apolar side chains from the AB domain. (B) In the Ca2+-free state, F70 has withdrawn from the core, and the interactions between F70 and the AB domain have been broken. I46, F49, I50, F66, and L85 have also experienced significant displacements.
Interestingly, residues 66, 67, 68, 70, and 71 display increased contact with residues at the N terminus. The backbone atoms of S1 and I2 are not observed in 3D NMR spectra of Ca2+-bound rat β-PV, presumably due to exchange broadening. The putative interaction between the N terminus and the D/E loop in the apo-protein may limit mobility sufficiently to permit their detection.
In contrast to F66 and F70, F49 assumes a more interior position in the apo-protein. The side chains of I46, I50, and L85 likewise exhibit significant displacements. Apparently, Ca2+ removal provokes substantial reorganization of the hydrophobic core. As a result, the AB/CD-EF interface undergoes substantial remodeling. In the Ca2+-bound protein, L6, I11, L15, F24, F29, and L35 participate in numerous interdomain contacts. In the apo-protein, however, the hydrophobic interactions involving these side chains are primarily intradomain (▶).
Figure 6.

Ca2+ removal modifies hydrophobic contacts in the AB domain. The conformations of residues 6, 11, 15, 24, 29, and 35 are displayed for the Ca2+-free (A) and Ca2+-bound (B) states of the protein. The interactions between F24 and L15, F29 and I11, and L35 and L6 in the apo-protein are either less pronounced or absent in the presence of Ca2+.
Although rat β-PV does not spontaneously form disulfide-linked dimers, either in the presence or absence of Ca2+, dimer formation can be induced by treatment with Cu2+ (Clayshulte et al. 1990). Interestingly, the apo-protein undergoes Cu2+-facilitated dimerization far more rapidly than the Ca2+-bound form. This finding suggests that accessibility of the C18 sulfhydryl increases upon removal of Ca2+. Consistent with the observed reactivity, solvent exposure of the sulfhydryl group is increased in the apo-protein (data not shown).
In the Ca2+-bound state, paired EF-hand motifs are related by a pseudo-twofold symmetry axis and are physically linked by a short segment of antiparallel β structure. In rat β-PV, the fragment of β structure joining the CD and EF loops is created by hydrogen bonds between the main-chain carbonyl and amide groups of L58 and I97. With Ca2+ removal, these bonds are broken, and the orientations of the binding loops change perceptibly. The accompanying alterations in pairwise interaction are displayed in ▶, bounded by the ellipse labeled β; whereas Y57 and D59 exhibit diminished contact with residues K96 and I97, residues 50–54 display increased interaction with 96 and 97.
Compared to the structural changes observed in the CD site (residues 41–70), the perturbations in the EF site (residues 81–108) provoked by Ca2+ removal appear fairly modest. As ▶ illustrates, the placement of the F helix is essentially unchanged. And although the E helix has moved, the displacement has evidently occurred with virtually no rotation of the helix or reorientation of its axis.
15N relaxation data analysis
Relaxation data were collected on the Ca2+-free protein at 20°C. The T 1 and T 2 data, acquired with the appropriate series of relaxation delays, display acceptable experimental uncertainties and are well accommodated by a two-parameter exponential decay model. Representative results are displayed in Supplemental Figure S4. R 1 and R 2 values were determined for 92 of 105 amide vectors. They are plotted in ▶, respectively, and listed in Supplemental Table S2.
Figure 7.
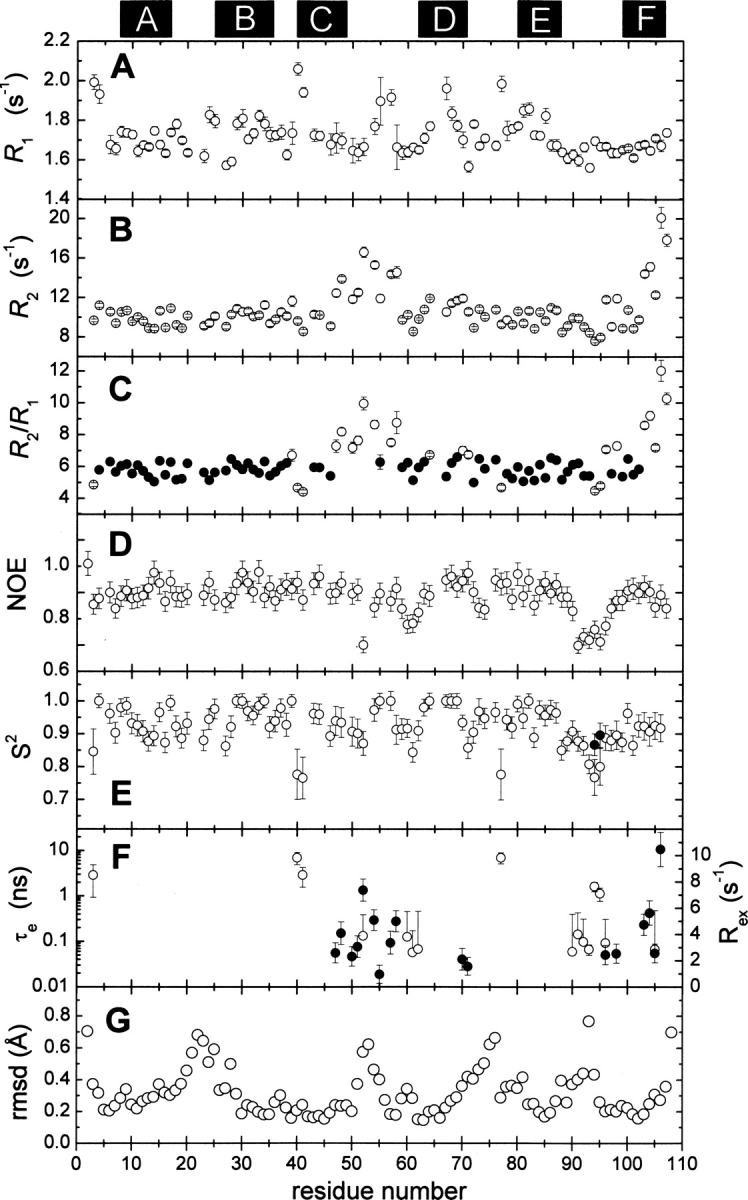
Summary of 15N relaxation data and internal mobility analysis. (A) Experimental R 1 values. (B) Experimental R 2 values. (C) R 2/R 1 ratios. Filled circles (•) denote amide vectors included in the calculation of the mean value. (D) Experimental {1H}15N NOE values. (E) Generalized order parameter (S 2) determined by model-free analysis, as described in the text. D94 and G95 required inclusion of a second order parameter (•), corresponding to motion on a slower timescale, to satisfactorily reproduce their relaxation behavior. (F) τ e (○) and R ex (•) values for those residues displaying motion on a timescale exceeding 20 ps. The locations of the six helical elements are indicated at the top of the figure. (G) Average RMSD for the backbone atom positions for each residue in the ensemble.
The overall rotational correlation time (τ c) was estimated from a subset of the amide vectors (▶, •), those exhibiting an R 2/R 1 ratio within one standard deviation of the mean. Presumably, their relaxation behavior is largely determined by the overall tumbling of the molecule, with little influence from internal motions. These data are well accommodated by a spherically symmetric rotational diffusion model, yielding a rotational correlation time of 6.96 ± 0.04 ns. Axially symmetric and fully symmetric models yielded insignificant reductions in χ2.
The {1H}15N NOE values (▶) exhibit a high degree of uniformity. Significant reductions in the NOE, indicating motion on a nanosecond timescale, are confined to residues 52, 60, and 61 in the CD loop, residues 91–96 in the EF loop, and the extreme C terminus. Excluding these outliers, the average NOE value is 0.81.
Internal mobility and model-free analysis
The Lipari–Szabo model-free formalism was used to examine main-chain flexibility in Ca2+-free rat β-PV. Relaxation data for 92 amide vectors were included in the analysis, employing a spherically symmetric diffusion model. The results are displayed in ▶, and the model-free parameters are listed in Supplemental Table S3.
The majority of signals (62/92) can be modeled with the overall rotational correlation time (τ c) and a generalized order parameter (S 2) (Model 1). Eleven amide vectors require a τ e term to describe internal motion on the 20 ps–10 ns timescale. An additional 15 require an R ex term to describe internal motion on the microsecond–millisecond timescale. (In this context, one reviewer noted that, due to the high CPMG field strength typically employed in R 2 measurements, the Lipari–Szabo analysis may fail to detect motion on the millisecond timescale.) Two amides (residues 52 and 96) can be accommodated only by inclusion of both τ e and R ex terms. Finally, two NH vectors (D94, G95) exhibit behavior consistent with motion on two timescales shorter than the overall rotational correlation time. Except for T3, A40, S41, F70, S71, and S77, all of the amide vectors incompatible with Model 1 reside in the CD and EF loops or at the C terminus. The relaxation behavior of the I2 vector was not reproduced by any of the models.
Discussion
Whereas typical parvalbumin CD and EF sites behave equivalently in titrations with divalent ions, the binding sites in rat β-PV are conspicuously nonequivalent. The Ca2+- and Mg2+-binding constants for the EF site, 2.5 × 10⁷ and 9.0 × 10³ M−1, approach those of the rat α isoform (1.2 × 10⁸ and 1.8 × 10⁴ M−1, respectively). By contrast, the CD site exhibits sharply attenuated divalent ion affinity, with Ca2+- and Mg2+-binding constants of 1.5 × 10⁶ and 1.6 × 10² M−1 (Hapak et al. 1989; Cox et al. 1990; Henzl et al. 2004b).
The CD loop in rat β-PV differs from the PV consensus at residues 57–59, with Tyr-Leu-Asp replacing the otherwise invariant Phe-Ile-Glu sequence triad. However, divalent ion-binding behavior is relatively insensitive to mutations at these positions (Golden et al. 1989; Hapak et al. 1989; Palmisano et al. 1990; Trevino et al. 1991; Pauls et al. 1996b), suggesting that remote structural determinants contribute to the atypical divalent ion-binding signature of the CD site.
We recently replaced residues 49, 50, 57, 58, 59, and 60 with the corresponding residues from chicken parvalbumin 3 (CPV3). Although the resulting CD site is identical to that in CPV3 at 27 of 30 positions, the Ca2+ and Mg2+ affinities remain 1.5 and 2.9 kcal/mol, respectively, less favorable than those displayed by CPV3 (Henzl and Ndubuka 2006). This result further attests to the influence of structural features beyond the binding site.
Several years ago, 15N relaxation data were collected on Ca2+-free and -bound rat β-PV at 37°C (Henzl et al. 2002). Due to substantial exchange broadening at that temperature, it was possible to assign just 60 of the amide signals in the apo-protein. Interestingly, however, for the majority of N-H vectors in the AB and D/E regions, the order parameters were larger in the Ca2+-free state. Apparently, Ca2+ removal decreases flexibility in these regions of the molecule, an indication that they may influence divalent ion-binding behavior.
To assess the potential impact of the AB domain, we studied association of the isolated AB and CD/EF domains from rat α- and β-PV (Henzl et al. 2004a). The interactions, homologous and heterologous, were characterized in two ways: Complex formation was examined in the presence of saturating Ca2+, and the apparent Ca2+ affinity of each complex was examined by titrating an equimolar mixture of the AB and CD-EF fragments. Although the AB fragments from the α and β isoforms differ at 18 of 37 residues, the β CD-EF fragment exhibits higher affinity for the α AB fragment. Moreover, the resulting heterologous αβ complex displays substantially greater Ca2+ affinity. The apparent 2.3 kcal/mol improvement in free energy reflects a more favorable binding enthalpy and less favorable binding entropy.
The improved enthalpic term implies that, relative to β AB, the α AB fragment more readily assumes the conformation required for association with the CD-EF domain. The less favorable entropic term, on the other hand, implies that the isolated α AB fragment is relatively unstructured. Parenthetically, we had intended to produce both AB peptides as fusion proteins. Although successful for β AB, the α AB peptide thus obtained was invariably proteolyzed, necessitating its chemical synthesis. This observation suggests that the AB fragment from rat β-PV, but not from rat α-PV, adopts an ordered, protease-resistant structure in solution.
On the basis of these findings, it was suggested (1) that the β-PV AB domain has an intrinsic structural preference, which it manifests in the unliganded state, and (2) that the attenuated divalent ion affinity of rat β-PV reflects an energetic penalty attendant to placing the AB domain in its liganded conformation. Consistent with these ideas, this study finds that the interface between the AB and CD-EF domains differs significantly in the apo- and Ca2+-bound proteins.
The relative positions of helices A, B, and F are little changed by Ca2+ removal (▶). However, the C, D, and E helices experience significant displacement. Their reorientation substantially alters intramolecular contacts. These changes can be readily appreciated, either at the level of entire helices (▶) or at the level of individual residues (▶). The altered contacts reflect a major reorganization of the hydrophobic core. The withdrawal of F70 and F66 from the protein interior provides the most tangible evidence of this reorganization. However, the side chains of I46, F49, I50, and L85 have also undergone repositioning.
This reshuffling of the apolar side chains results in remodeling of the AB/CD-EF interface. In the Ca2+-loaded protein, residues I2, L6, I11, L15, and F29 make extensive contact with F70, in effect anchoring the C-terminal end of the D helix to the AB domain. These interactions are abolished when F70 vacates the hydrophobic core. Interactions between F66 and L67 and the AB domain are likewise diminished in the Ca2+-free state. Liberated from their interdomain contacts, residues 6, 11, 15, 24, 29, and 35 instead form a network of intradomain hydrophobic interactions (▶).
Contact between the D helix and the A and B helices is sharply decreased in the apo-protein, largely accounting for the 9% reduction in apolar surface area buried at the AB/CD-EF interface. By contrast, F49 and L85 assume more interior positions in the Ca2+-free state, contributing to a significant increase in contact between helix B and the C and E helices.
15N relaxation data suggest that the peptide backbone remains rigid, on the picosecond–nanosecond timescale, in the apo-protein. In the previous 15N relaxation study conducted on Ca2+-free rat β-PV at 37°C (Henzl et al. 2002), the average order parameter (for those 60 residues that were assignable) was 0.90. The magnitude of the order parameter is expected to increase with decreasing temperature (Bracken et al. 1999). In accordance with prediction, the relaxation data presented here, collected at 20°C, yield an average S 2 value of 0.92.
In the present study, two-thirds of the amide vectors show no evidence for internal mobility on timescales exceeding 20 ps. Of the remaining vectors, 11 show evidence for motion on the nanosecond timescale, 15 show evidence for motion on the microsecond timescale, and a handful show evidence of more complex internal motions. With few exceptions, all of these reside within the CD and EF ion-binding loops (see below).
Model-free analysis returned S 2 values of 1.0 for nine amides. Significantly, four of these (K64, L67, Q68, K69) reside in the D helix, which, as noted above, undergoes a major transformation upon Ca2+ removal. Signal degeneracy prevented analysis of the vectors associated with Y65 and F66. The implication, however, is that straightening of the D helix is accompanied by significant rigidification. Residues 4, 34, 39, 77, and 82 also exhibit S 2 values of 1.0. Rat β-PV exhibits no tendency to dimerize in either the apo- or Ca2+-bound forms (Henzl et al. 2002). Thus, the extreme S 2 values are not a consequence of self-association (Schurr et al. 1994; Baryshnikova and Sykes 2006).
Removal of Ca2+ might be expected to produce increased disorder within the CD and EF binding loops. However, the RMSDs within the binding loops are no more pronounced than those observed in the loops joining either the A and B helices or the D and E helices (▶). This minimal conformational heterogeneity could be a reflection of Na+ binding. Solvent cations can occupy vacant parvalbumin EF-hand motifs (Permyakov et al. 1983; Henzl et al. 2000). At a Na+ concentration of 0.24 M, rat β-PV binds approximately two equivalents of the monovalent ion, with an estimated average binding constant of 60 M−1 (Henzl et al. 2000). Under the conditions employed for NMR data collection (170 mM Na+, 4 mM protein), the binding loops would be ∼90% occupied by the monovalent ion.
Although the binding loops exhibit little structural heterogeneity, the 15N relaxation data suggest that residues in the loops, and nearby, are subject to motion on longer timescales. With respect to the CD loop (residues 51–62), significantly elevated R 2/R 1 values are observed for F47, R48, I50, D51, N52, Q54, Y57, and L58. All of these residues, and S55 as well, require an R ex term for satisfactory Lipari–Szabo modeling. These findings are indicative of motion on the microsecond timescale. N52, G60, D61, and E62 exhibit reduced {1H}15N NOE values and require τ e values to model internal mobility—suggestive of motion on the nanosecond timescale.
The EF loop displays less evidence for microsecond motion. There is no comparable elevation of R 2/R 1 values, and only K96 and I97 require the R ex term. However, the EF loop residues apparently experience substantial motion on the nanosecond timescale. N91, D92, G93, D94, G95, and K96 exhibit markedly reduced {1H}15N NOEs. These same residues, plus D90, require τ e in the Lipari–Szabo analysis.
The structural data for rat β-PV were collected in buffered saline because detailed divalent ion-binding studies have been conducted under comparable solution conditions. The identity of the major solvent cation can significantly influence PV divalent ion-binding behavior. Ca2+-free rat α-PV, for example, binds one equivalent of Na+ but has negligible affinity for K+. As a consequence, the average Ca2+-binding constant increases from 1.2 × 10⁸ M−1 in Na+ solution to 1.4 × 10⁹ M−1 in K+ solution (ΔΔG tot = −2.6 kcal/mol) (Henzl et al. 2004b). Monovalent ion identity has a smaller impact on rat β-PV (ΔΔG tot = −0.7 kcal/mol), presumably because the apo-protein is capable of binding either Na+ or K+ (Henzl et al. 2000, 2004b). Although the binding stoichiometries are not identical for the two ions, it is anticipated that the solution structure of rat β-PV in 150 mM K+ would closely resemble the structure described here.
Under resting-state conditions in the cell (pCa = −7, pMg = −3), the predominant form of rat β-PV is predicted to have Mg2+ bound in the EF site and K+ bound at the CD site. The divalent ion-free form of the protein studied here is negligibly populated under physiological conditions. However, ligand affinity reflects the difference in the free energies of the bound and ligand-free states. Thus, the unliganded protein influences binding energetics regardless of the extent to which it is populated in vivo.
The Ca2+-bound structures of rat α- and β-PV are remarkably similar (Ahmed et al. 1993; McPhalen et al. 1994; Bottoms et al. 2004). The RMSD for their superimposed polypeptide backbones is just 0.8–0.9 Å. Inspection of the Ca2+-loaded molecules offers little insight into the source of the apparent 5.5 kcal/mol difference in standard binding free energy observed in 0.15 M KCl at pH 7.4. This discrepancy could merely reflect multiple, minor structural and energetic differences in the metal ion-bound forms. Alternatively, the divergent divalent ion-binding behavior could be dictated at the level of the apo-proteins. In principle, ligand affinity can be modulated by adjusting the stability of the apo-form, with stabilization producing a reduction in affinity.
This study suggests that Ca2+-free rat β-PV adopts a conformation distinct from that of the Ca2+-bound state. Rearrangement of the C, D, and E helices has substantively altered the relative orientation of the AB and CD-EF domains. Because divalent ion binding requires their reversal, structural alterations of the magnitude described here could compromise binding affinity. Moreover, consistent with the divalent ion-binding signature of the protein, the observed differences are predicted to exert their primary effect on the CD site. Because Ca2+ removal has a more modest impact on the E and F helices, the energetic penalty associated with converting the EF site to its bound configuration should be substantially smaller than that associated with isomerizing the CD site.
In conclusion, these findings suggest that the unusual divalent ion-binding behavior of rat β-PV may be strongly influenced by the structural preferences of the apo-protein. If correct, the Ca2+-free state of a more typical PV isoform should more closely resemble that of the Ca2+-loaded state. It will be interesting to learn whether the structure of Ca2+-free rat β-PV differs substantively from the apo-PV norm.
Materials and Methods
Materials
Celtone was obtained from Spectra Stable Isotopes. Pf1 bacteriophage were ordered from ASLA BIOTECH Ltd. All other common chemicals and reagents were obtained from Sigma-Aldrich or Fisher Scientific Co.
Protein expression and purification
Recombinant rat β-PV was expressed and purified as described previously (Hapak et al. 1989). Besides 13C6-d-glucose and/or 15NH4Cl, the medium consisted of M9 salts supplemented with 2.5% (v/v) Celtone, 100 μM FeCl3, trace elements, and ampicillin (300 μg/mL). Each liter yielded 20–25 mg of protein, with purity exceeding 98%.
NMR sample preparation
Sufficient protein to yield a 4 mM sample was concentrated to 5 mL by ultrafiltration, then dialyzed at 4°C for 48 h, against 4 L of 0.15 M NaCl, 0.025 M HEPES, 5.0 mM EDTA (pH 7.4). Dialysis was continued for 48 h against 0.15 M NaCl, 0.01 M Mes, 5.0 mM EDTA (pH 6.0). After adding 0.1 volume of buffer prepared in D2O, as well as sodium azide (final concentration 0.1%), the solution was concentrated to 0.35 mL and loaded into a 5-mm Shigemi microcell (Shigemi, Inc.).
For measurement of residual dipolar couplings, partial alignment was achieved by addition of Pf1 bacteriophage. Prior to combining the phage with the protein, it was dialyzed against 0.15 M NaCl, 0.025 M Mes, 5.0 mM EDTA (pH 6.0). The phage concentration in the resulting sample was estimated at 13 mg/mL, based on an observed 14-Hz splitting of the HOD signal.
NMR spectroscopy
All data were acquired at 20°C with BioPack pulse sequences on a Varian INOVA 600-MHz spectrometer, employing a triple-resonance cryoprobe equipped with pulsed-field z gradient. 1H chemical shifts were referenced relative to DSS; 13C and 15N shifts were referenced indirectly, employing the 1H/X frequency ratios. Data were processed with NMRPipe and analyzed with Sparky (T.D. Goddard and D.G. Kneller, University of California, San Francisco).
Resonance assignments
Backbone resonance assignments were made using the following pairs of 3D experiments: HNCA (Ikura et al. 1990) and HN(CO)CA (Bax and Ikura 1991); HNCACB (Kay et al. 1994; Muhandiram and Kay 1994) and CBCA(CO)NH (Grzesiek and Bax 1992); and HNCO (Ikura et al. 1990) and HCACOCANH (Lohr and Ruterjans 2005). Aliphatic 13C assignments beyond Cβ were collected using the CCONH (Grzesiek et al. 1993) spectrum. Aliphatic side-chain 1H assignments were made with HCCONH (Grzesiek et al. 1993), 15N-edited TOCSY-HSQC (Marion et al. 1989a), and HCCH-TOCSY (Kay et al. 1993) experiments. Two-dimensional HBCBCGCDHD (Yamazaki et al. 1993) and HBCBCGCDCEHE (Yamazaki et al. 1993) spectra provided assignments for the aromatic protons. Stereospecific assignments of the methyl protons in valine and leucine were made by analysis of a fractionally 13C-labeled sample (Neri et al. 1989). Asparagine and glutamine side-chain amides were assigned by matching the α/β (Asn) or β/γ (Gln) carbon shifts in the CBCACONH spectrum with the amide signals.
Structural restraints
For collection of NOE-based distance restraints, a 3D 15N-edited NOESY-HSQC (Marion et al. 1989b) data set was collected on 15N-labeled protein, employing a mixing time of 125 ms. A corresponding 13C-edited experiment was performed on 13C,15N-labeled material, using a mixing time of 100 ms. Cross peaks were picked manually and integrated in Sparky.
ϕ,ψ dihedral angle restraints were obtained from TALOS (Cornilescu et al. 1999) and CSI (Wishart and Sykes 1994). In addition, a 3D HNHA experiment (Vuister and Bax 1993) was conducted on 15N-labeled protein, and the magnitude of J HNHα was used to constrain the ϕ angle.
For the estimation of 1H-15N RDCs, 1H-15N splittings were measured on unaligned and partially aligned samples using the 1H-15N HSQC-IPAP pulse sequence (Ottiger et al. 1998). Peak positions were automatically picked in Sparky. Subtraction of the unaligned splitting from that observed in the aligned sample yielded the value of the 1H-15N RDC.
15N relaxation data were collected on 15N-labeled protein, employing the T 1, T 2, and {1H}15N NOE pulse sequences supplied in BioPack. R 1 data were acquired with relaxation delays of 50, 100, 150, 250, 350, 450, 600, 800, 1000, and 1200 ms. R 2 data were acquired with delays of 10, 30, 50, 70, 90, 110, 130, 150, 170, and 190 ms. Replicate data were obtained at three delay values for evaluation of experimental uncertainty. For the measurement of steady-state heteronuclear {1H}15N-NOEs, HSQC spectra were collected, with or without proton saturation (3.0 sec), employing a total recycle delay period of 5.0 sec. Duplicate experiments were performed to obtain an estimate of the experimental uncertainty.
Structure calculations were performed with ARIA2.0a (Habeck et al. 2004). ARIA (ambiguous restraints for iterative assignment) integrates automated NOE assignments with CNS-based structure calculations (Linge et al. 2001). Supplied with chemical shift assignments and one or more NOE lists, ARIA produces a set of calibrated ambiguous distance restraints (ADRs). These serve as the input for CNS (Brunger et al. 1998) calculations, together with any additional structural restraints. The resulting set of lowest energy structures is used to modify the ADR list. The initial ambiguous restraint list is generated with the assumption of an extended polypeptide chain and a large violation tolerance, e.g., 1000 Å. Under these conditions, there is no discrimination between potential contributions to an ambiguous NOE cross peak, and only unambiguous NOEs influence the structure determination. In subsequent iterations, however, the violation tolerance is reduced, finally to 0.1 Å. As this tolerance shrinks, certain potential assignments are eliminated—reducing the degree of ambiguity associated with a particular cross peak and, in favorable cases, producing unambiguous restraints.
Initial structure calculations included a fairly extensive set of manual 1H-1H NOE assignments (350 total). During the review process, however, it was pointed out that these manual assignments are interpreted as unambiguous restraints by ARIA and can strongly influence the trajectory of the calculation. Thus, the calculations were repeated, omitting manual crosspeak assignments. Besides the 15N- and 13C-edited NOESY peak lists, the initial input included dihedral angle restraints (TALOS, CSI, and estimates of ϕ derived from 3 J HNHα values), and 1H-15N RDC restraints. Preliminary estimates for the rhombicity (R) and magnitude (D a) of the alignment tensor—0.66 and −13.9 Hz, respectively—were obtained from a histogram analysis using EHM (Bryce and Bax 2004). After each round of calculation, the lowest energy structure was examined with PALES (Zweckstetter and Bax 2000) to obtain improved estimates of D a and R. The lowest ARIA energies and minimal SANI violations were obtained with values of −10.7 Hz and 0.59, respectively.
The quality of the final structures was analyzed using PROCHECK (Laskowski et al. 1993). The area of contact between the AB and CD-EF domains in the Ca2+-free state was estimated for each structure in the ensemble using the surface command of CNS, employing a probe radius of 1.4 Å. The interdomain contact area was defined as the sum of the solvent-accessible surface areas of the individual, isolated domains minus the accessible area of the entire protein. Hydrogen atoms were included in the calculations. Similar calculations were performed on the crystal structure of Ca2+-bound rat β-PV (PDB 1RRO), after adding hydrogen atoms. The mean and standard deviation are reported for the NMR-derived structures.
To compare the extent of interhelical contact in the apo- and Ca2+-bound states, we first summed the surface areas of the individual helices in a given helix pair. We then determined the surface area for that pair, in isolation, as oriented in the protein. The difference between these two values provided an estimate of the interhelical contact. These calculations were performed on the Ca2+-bound crystal structure and each conformer of the Ca2+-free ensemble. The mean and standard deviation for the latter are reported in Supplemental Table S1.
Data for the difference contact matrix in ▶ were calculated as follows. First, the interresidue contact area for each pair of residues in a given structure was calculated as the sum of the solvent-accessible surface areas of the individual, isolated residues minus the surface area of the pair, as oriented in the protein. This procedure generated 5778 interresidue contact surface area values per structure. For the apo-protein, the interresidue contact values were averaged over the 20 models in the ensemble. These ensemble-averaged values were then subtracted from the corresponding values for the Ca2+-bound structure to generate 5778 difference-contact-area values. These values were then scaled so as to yield an average value of zero and a variance of 1.0.
15N relaxation analysis
Peak intensities in the T 1, T 2, and {1H}15N NOE data sets were measured automatically in Sparky. R 1 and R 2 values were extracted for each peak by fitting the signal intensities to a two-parameter single-exponential decay, in Origin, version 7.5 (OriginLab). The NOE values represent the ratio of the signal intensities in the presence and absence of proton saturation. These relaxation data were analyzed with Tensor2 (Dosset et al. 2000).
The overall rotational correlation time (τ c) was obtained using data for a subset of the amide vectors having R 2/R 1 values falling within one standard deviation of the mean value (Tjandra et al. 1995). Obvious outliers were excluded from the calculation of the mean. The isotropic rotational diffusion model yielded a τ c value of 6.96 ± 0.04 ns, which corresponds to a rotational diffusion coefficient of 2.40 × 10⁷ sec−1. The axially symmetric model yielded two minima. In one case, the D ∥ and D ⊥ values were 2.44 × 10⁷ sec−1 and 2.26 × 10⁷ sec−1, respectively (D ∥/D ⊥ = 1.08). In the other, D ∥ and D ⊥ were 2.32 × 10⁷ sec−1 and 2.52 × 10⁷ sec−1 (D ∥/ D ⊥ = 0.92). The fully anisotropic model yielded D x, D y, and D z values of 2.26 × 10⁸ sec−1, 2.42 × 10⁸ sec−1, and 2.46 × 10⁸ sec−1. Neither asymmetric model afforded a significant decrease in χ2.
Internal mobilities were examined using the Lipari–Szabo model-free formalism (Lipari and Szabo 1982a,b). Tensor2 employs the five models suggested by Clore et al. (1990a,b) and the model selection strategy described by Mandel et al. (1995). Model 1 assumes that any internal motions are very rapid, with relaxation of the amide vector in question dictated by overall tumbling and a generalized order parameter, S 2. Model 2 includes an internal correlation time (τ e), in addition to S 2, to allow for motion on the nanosecond timescale. Model 3 includes S 2 and R ex, a rate constant that describes microsecond–millisecond motion. Model 4 includes S 2, τ e, and R ex. Model 5 is reserved for NH vectors having internal motions on two timescales shorter than the overall correlation time. It includes two order parameters—S f 2 for rapid motion (≤ 20 ps) and S s 2 for slower motion (20–500 ps). The five models are tested iteratively, in order of increasing complexity, until the data are adequately reproduced by Monte Carlo simulation.
Coordinate and data deposition
The atomic coordinates and structural restraints have been deposited in the Protein Data Bank (PDB 2NLN). 1H, 15N, and 13C assignments have been deposited in BioMagResBank (BMRB 7322).
Electronic supplemental material
Supplemental material for this article includes a comparison of the 1H,15N-HSQC spectra of apo- and Ca2+-bound rat β-PV (Supplemental Fig. S1), a depiction of the sequential Cα and Cβ connectivities between residues 32–41 of Ca2+-free rat β-PV (Supplemental Fig. S2), the sequential distribution of NMR restraints used in the calculation (Supplemental Fig. S3), and representative 15N relaxation data (R 1, R 2) with corresponding least-squares fits (Supplemental Fig. S4). Supplemental Table S1 contains the numerical estimates of interhelical contact in apo- and Ca2+-bound β-PV. Supplemental Table S2 lists the R 1, R 2, and NOE values measured for Ca2+-free rat β-PV. Supplemental Table S3 lists the Lipari–Szabo model-free parameters obtained by fitting the R 1, R 2, and NOE data.
Acknowledgments
The authors thank Dr. Wei Wycoff, staff NMR Spectroscopist for the MU NMR Facility, for her valuable assistance with the acquisition of the NMR data described herein. Matt Stanley, Systems Administrator Expert, is acknowledged for his outstanding technical support of the Linux-based machines in the Biochemistry Department and MU Structural Biology Core Facility. This work was supported by NSF awards MCB0131166 and MCB0543476 (to M.T.H. and J.J.T.).
Footnotes
Supplemental material: see www.proteinscience.org
Reprint requests to: Michael T. Henzl, Department of Biochemistry, 117 Schweitzer Hall, University of Missouri-Columbia, Columbia, MO 65211, USA; e-mail: henzlm@missouri.edu; fax: (573) 884-4812.
Abbreviations: ADR, ambiguous distance restraint; CD site, parvalbumin metal ion-binding site flanked by the C and D helices; CSI, chemical shift index; D a, axial component of the molecular alignment tensor; D ∥, principal axis component of the molecular diffusion tensor; D ⊥, minor axis component of the molecular diffusion tensor in an axially symmetric system; DSS, sodium 2,2-dimethyl-2-silapentane-5-sulfonate; EDTA, ethylenediaminetetraacetic acid; EF site, parvalbumin metal ion-binding site flanked by the E and F helices; HEPES, 4-(2-hydroxyethyl)-1-piperazineethanesulfonic acid; HSQC, heteronuclear single-quantum coherence; Mes, 2-(N-morpholino)ethanesulfonic acid; NMR, nuclear magnetic resonance; NOE, nuclear Overhauser effect; NOESY, NOE spectroscopy; PV, parvalbumin; R, rhombic component of the molecular alignment tensor for partially aligned samples; R 1, longitudinal relaxation rate (1/T 1); R 2, transverse relaxation rate (1/T 2); RDC, residual dipolar coupling; RMSD, root mean square difference; S 2, generalized Lipari–Szabo order parameter; TALOS, torsion angle likelihood obtained from shifts and sequence similarity; τ c, overall rotational correlation time; τ e, internal correlation time; R ex, rate constant for microsecond/millisecond motion resulting from chemical or conformational exchange.
Article and publication are at http://www.proteinscience.org/cgi/doi/10.1110/ps.072837307.
References
- Ahmed F.R., Rose, D.R., Evans, S.V., Pippy, M.E., and To, R. 1993. Refinement of recombinant oncomodulin at 1.30 Å resolution. J. Mol. Biol. 230 1216–1224. [DOI] [PubMed] [Google Scholar]
- Babini E., Bertini, I., Capozzi, F., Del Bianco, C., Hollender, D., Kiss, O.T., Luchinat, C., and Quattrone, A. 2004. Solution structure of human β-parvalbumin and structural comparison with its paralog α-parvalbumin and with their rat orthologs. Biochemistry 43 16076–16085. [DOI] [PubMed] [Google Scholar]
- Baig I., Bertini, I., Del Bianco, C., Gupta, Y.K., Lee, Y.-M., Luchinat, C., and Quattrone, A. 2004. Paramagnetism-based refinement strategy for the solution structure of human α-parvalbumin. Biochemistry 43 5562–5573. [DOI] [PubMed] [Google Scholar]
- Baryshnikova O.K. and Sykes, B.D. 2006. Backbone dynamics of SDF-1α determined by NMR: Interpretation in the presence of monomer-dimer equilibrium. Protein Sci. 15 2568–2578. [DOI] [PMC free article] [PubMed] [Google Scholar]
- Bax A. and Ikura, M. 1991. An efficient 3D NMR technique for correlating the proton and 15N backbone amide resonances with the α-carbon of the preceding residue in uniformly 15N/13C enriched proteins. J. Biomol. NMR 1 99–104. [DOI] [PubMed] [Google Scholar]
- Berchtold M.W. and Means, A.R. 1985. The Ca2+-binding protein parvalbumin: Molecular cloning and developmental regulation of mRNA abundance. Proc. Natl. Acad. Sci. 82 1414–1418. [DOI] [PMC free article] [PubMed] [Google Scholar]
- Berridge M.J. 2004. Calcium signal transduction and cellular control mechanisms. Biochim. Biophys. Acta 1742 3–7. [DOI] [PubMed] [Google Scholar]
- Berridge M.J. 2005. Unlocking the secrets of cell signaling. Annu. Rev. Physiol. 67 1–21. [DOI] [PubMed] [Google Scholar]
- Berridge M.J., Bootman, M.D., and Roderick, H.L. 2003. Calcium signalling: Dynamics, homeostasis and remodelling. Nat. Rev. Mol. Cell Biol. 4 517–529. [DOI] [PubMed] [Google Scholar]
- Bottoms C.A., Schuermann, J.P., Agah, S., Henzl, M.T., and Tanner, J.J. 2004. Crystal structure of rat α-parvalbumin at 1.05 Å resolution. Protein Sci. 13 1724–1734. [DOI] [PMC free article] [PubMed] [Google Scholar]
- Bracken C., Carr, P.A., Cavanagh, J., and Palmer III, A.G. 1999. Temperature dependence of intramolecular dynamics of the basic leucine zipper of GCN4: Implications for the entropy association with DNA. J. Mol. Biol. 285 2133–2146. [DOI] [PubMed] [Google Scholar]
- Brunger A.T., Adams, P.D., Clore, G.M., DeLano, W.L., Gros, P., Grosse-Kunstleve, R.W., Jiang, J.S., Kuszewski, J., Nilges, M., Pannu, N.S., et al. 1998. Crystallography and NMR System: A new software suite for macromolecular structure determination. Acta Crystallogr. D Biol. Crystallogr. 54 905–921. [DOI] [PubMed] [Google Scholar]
- Bryce D.L. and Bax, A. 2004. Application of correlated residual dipolar couplings to the determination of the molecular alignment tensor magnitude of oriented proteins and nucleic acids. J. Biomol. NMR 28 273–287. [DOI] [PubMed] [Google Scholar]
- Celio M.R., Pauls, T., and Schwaller, B. 1996. Guidebook to the calcium-binding proteins. Oxford University Press, Oxford, UK.
- Clayshulte T.M., Taylor, D.F., and Henzl, M.T. 1990. Reactivity of cysteine 18 in oncomodulin. J. Biol. Chem. 265 1800–1805. [PubMed] [Google Scholar]
- Clore G.M., Driscoll, P.C., Wingfield, P.T., and Gronenborn, A.M. 1990a. Analysis of the backbone dynamics of interleukin-1β using two-dimensional inverse detected heteronuclear 15N-1H NMR spectroscopy. Biochemistry 29 7387–7401. [DOI] [PubMed] [Google Scholar]
- Clore G.M., Szabo, A., Bax, A., Kay, L.E., Driscoll, P.C., and Gronenborn, A.M. 1990b. Deviations from the simple two-parameter model-free approach to the interpretation of nitrogen-15 nuclear magnetic relaxation of proteins. J. Am. Chem. Soc. 112 4989–4991. [Google Scholar]
- Cornilescu G., Delaglio, F., and Bax, A. 1999. Protein backbone angle restraints from searching a database for chemical shift and sequence homology. J. Biomol. NMR 13 289–302. [DOI] [PubMed] [Google Scholar]
- Cox J.A., Milos, M., and MacManus, J.P. 1990. Calcium- and magnesium-binding properties of oncomodulin. Direct binding studies and microcalorimetry. J. Biol. Chem. 265 6633–6637. [PubMed] [Google Scholar]
- DeLano W.L. 2002. The PyMOL molecular graphics system. DeLano Scientific, San Carlos, CA.
- Dosset P., Hus, J.-C., Blackledge, M., and Marion, D. 2000. Efficient analysis of macromolecular rotational diffusion from heteronuclear relaxation data. J. Biomol. NMR 16 23–28. [DOI] [PubMed] [Google Scholar]
- Fohr U.G., Weber, B.R., Muntener, M., Staudenmann, W., Hughes, G.J., Frutiger, S., Banville, D., Schafer, B.W., and Heizmann, C.W. 1993. Human α and β parvalbumins. Structure and tissue-specific expression. Eur. J. Biochem. 215 719–727. [DOI] [PubMed] [Google Scholar]
- Gillen M.F., Banville, D., Rutledge, R.G., Narang, S., Seligy, V.L., Whitfield, J.F., and MacManus, J.P. 1987. A complete complementary DNA for the oncodevelopmental calcium-binding protein, oncomodulin. J. Biol. Chem. 262 5308–5312. [PubMed] [Google Scholar]
- Golden L.F., Corson, D.C., Sykes, B.D., Banville, D., and MacManus, J.P. 1989. Site-specific mutants of oncomodulin. 1H NMR and optical stopped-flow studies of the effect on the metal binding properties of an Asp59-Glu59 substitution in the calcium-specific site. J. Biol. Chem. 264 20314–20319. [PubMed] [Google Scholar]
- Goodman M. and Pechere, J.F. 1977. The evolution of muscular parvalbumins investigated by the maximum parsimony method. J. Mol. Evol. 9 131–158. [DOI] [PubMed] [Google Scholar]
- Grzesiek S. and Bax, A. 1992. Correlating backbone amide and side chain resonances in larger proteins by multiple relayed triple resonance NMR. J. Am. Chem. Soc. 114 6291–6293. [Google Scholar]
- Grzesiek S., Anglister, J., and Bax, A. 1993. Correlation of backbone amide and aliphatic side-chain resonances in 13C/15N-enriched proteins by isotropic mixing of carbon-13 magnetization. J. Magn. Reson. 101 114–119. [Google Scholar]
- Habeck M., Rieping, W., Linge, J.P., and Nilges, M. 2004. NOE assignment with ARIA 2.0: The nuts and bolts. Methods Mol. Biol. 278 379–402. [DOI] [PubMed] [Google Scholar]
- Hapak R.C., Lammers, P.J., Palmisano, W.A., Birnbaum, E.R., and Henzl, M.T. 1989. Site-specific substitution of glutamate for aspartate at position 59 of rat oncomodulin. J. Biol. Chem. 264 18751–18760. [PubMed] [Google Scholar]
- Heizmann C.W. and Kagi, U. 1989. Structure and function of parvalbumin. Adv. Ex. Med. Biol. 255 215–222. [DOI] [PubMed] [Google Scholar]
- Henzl M.T. and Ndubuka, K. 2006. Low-affinity signature of the rat β-parvalbumin CD site. Evidence for remote determinants. Biochemistry 46 23–35. [DOI] [PubMed] [Google Scholar]
- Henzl M.T., Shibasaki, O., Comegys, T.H., Thalmann, I., and Thalmann, R. 1997. Oncomodulin is abundant in the organ of Corti. Hear. Res. 106 105–111. [DOI] [PubMed] [Google Scholar]
- Henzl M.T., Larson, J.D., and Agah, S. 2000. Influence of monovalent cations on rat α- and β-parvalbumin stabilities. Biochemistry 39 5859–5867. [DOI] [PubMed] [Google Scholar]
- Henzl M.T., Wycoff, W.G., Larson, J.D., and Likos, J.J. 2002. 15N nuclear magnetic resonance relaxation studies on rat β-parvalbumin and the pentacarboxylate variants, S55D and G98D. Protein Sci. 11 158–173. [DOI] [PMC free article] [PubMed] [Google Scholar]
- Henzl M.T., Agah, S., and Larson, J.D. 2004a. Association of the AB and CD-EF domains from rat α- and β-parvalbumin. Biochemistry 43 10906–10917. [DOI] [PubMed] [Google Scholar]
- Henzl M.T., Larson, J.D., and Agah, S. 2004b. Influence of monovalent cation identity on parvalbumin divalent ion-binding properties. Biochemistry 43 2747–2763. [DOI] [PubMed] [Google Scholar]
- Ikura M., Kay, L.E., and Bax, A. 1990. A novel approach for sequential assignment of 1H, 13C, and 15N spectra of larger proteins: Heteronuclear triple-resonance three-dimensional NMR spectroscopy. Application to calmodulin. Biochemistry 29 4659–4667. [DOI] [PubMed] [Google Scholar]
- Kawasaki H. and Kretsinger, R.H. 1995. Calcium-binding proteins 1: EF-hands. Protein Profile 2 297–490. [PubMed] [Google Scholar]
- Kay L.E., Xu, G.Y., Singer, A.U., Muhandiram, D.R., and Forman-Kay, J.D. 1993. A gradient-enhanced HCCH-TOCSY experiment for recording side-chain proton and carbon-13 correlations in water samples of proteins. J. Magn. Reson. B101 333–337. [Google Scholar]
- Kay L.E., Xu, G.Y., and Yamazaki, T. 1994. Enhanced-sensitivity triple-resonance spectroscopy with minimal H2O saturation. J. Magn. Reson. 109 129–133. [Google Scholar]
- Kretsinger R.H. 1980. Structure and evolution of calcium-modulated proteins. CRC Crit. Rev. Biochem. 8 119–174. [DOI] [PubMed] [Google Scholar]
- Kretsinger R.H. and Nockolds, C.E. 1973. Carp muscle calcium-binding protein. II. Structure determination and general description. J. Biol. Chem. 248 3313–3326. [PubMed] [Google Scholar]
- Laskowski R.A., MacArthur, M.W., Moss, D.S., and Thornton, J.M. 1993. PROCHECK: A program to check the stereochemical quality of protein structures. J. Appl. Crystallogr. 26 283–291. [Google Scholar]
- Linge J.P., O'Donoghue, S.I., and Nilges, M. 2001. Automated assignment of ambiguous nuclear Overhauser effects with ARIA. Methods Enzymol. 339 71–90. [DOI] [PubMed] [Google Scholar]
- Lipari G. and Szabo, A. 1982a. Model-free approach to the interpretation of nuclear magnetic resonance relaxation in macromolecules. 1. Theory and range of validity. J. Am. Chem. Soc. 104 4546–4559. [Google Scholar]
- Lipari G. and Szabo, A. 1982b. Model-free approach to the interpretation of nuclear magnetic resonance relaxation in macromolecules. 2. Analysis of experimental results. J. Am. Chem. Soc. 104 4559–4570. [Google Scholar]
- Lohr F. and Ruterjans, H. 2005. A new triple-resonance experiment for the sequential assignment of backbone resonances in proteins. J. Biomol. NMR 6 189–197. [DOI] [PubMed] [Google Scholar]
- MacManus J.P., Watson, D.C., and Yaguchi, M. 1983. The complete amino acid sequence of oncomodulin—A parvalbumin-like calcium-binding protein from Morris hepatoma 5123tc. Eur. J. Biochem. 136 9–17. [DOI] [PubMed] [Google Scholar]
- Mandel A.M., Akke, M., and Palmer III, A.G. 1995. Backbone dynamics of Escherichia coli ribonuclease HI: Correlations with structure and function in an active enzyme. J. Mol. Biol. 246 144–163. [DOI] [PubMed] [Google Scholar]
- Marion D., Driscoll, P.C., Kay, L.E., Wingfield, P.T., Bax, A., Gronenborn, A.M., and Clore, G.M. 1989a. Overcoming the overlap problem in the assignment of 1H NMR spectra of larger proteins by use of three-dimensional heteronuclear 1H-15N Hartmann-Hahn-multiple quantum coherence and nuclear Overhauser-multiple quantum coherence spectroscopy: Application to interleukin 1β. Biochemistry 28 6150–6156. [DOI] [PubMed] [Google Scholar]
- Marion D., Kay, L.E., Sparks, S.W., Torchia, D., and Bax, A. 1989b. Three-dimensional heteronuclear NMR of nitrogen-15 labeled proteins. J. Am. Chem. Soc. 111 1515–1517. [Google Scholar]
- McPhalen C.A., Sielecki, A.R., Santarsiero, B.D., and James, M.N.G. 1994. Refined crystal structure of rat parvalbumin, a mammalian α-lineage parvalbumin, at 2.0 Å resolution. J. Mol. Biol. 235 718–732. [DOI] [PubMed] [Google Scholar]
- Moncrief N.D., Kretsinger, R.H., and Goodman, M. 1990. Evolution of EF-hand calcium-modulated proteins. I. Relationships based on amino acid sequences. J. Mol. Evol. 30 522–562. [DOI] [PubMed] [Google Scholar]
- Muhandiram D.R. and Kay, L.E. 1994. Gradient-enhanced triple-resonance three-dimensional NMR experiments with improved sensitivity. J. Magn. Reson. 103 203–216. [Google Scholar]
- Neri D., Szyperski, T., Otting, G., Senn, H., and Wuytack, F. 1989. Stereospecific nuclear magnetic resonance assignments of the methyl groups of valine and leucine in the DNA-binding domain of the 434 repressor by biosynthetically directed fractional 13C labeling. Biochemistry 28 7510–7516. [DOI] [PubMed] [Google Scholar]
- Ottiger M., Delaglio, F., and Bax, A. 1998. Measurement of J and dipolar couplings from simplified two-dimensional NMR spectra. J. Magn. Reson. 131 373–378. [DOI] [PubMed] [Google Scholar]
- Palmisano W.A., Trevino, C.L., and Henzl, M.T. 1990. Site-specific replacement of amino acid residues within the CD binding loop of rat oncomodulin. J. Biol. Chem. 265 14450–14456. [PubMed] [Google Scholar]
- Pauls T.L., Cox, J.A., and Berchtold, M.W. 1996a. The Ca2+-binding proteins parvalbumin and oncomodulin and their genes: New structural and functional findings. Biochim. Biophys. Acta 1306 39–54. [DOI] [PubMed] [Google Scholar]
- Pauls T.L., Durussel, I., Clark, I.D., Szabo, A.G., Berchtold, M.W., and Cox, J.A. 1996b. Site-specific replacement of amino acid residues in the CD site of rat parvalbumin changes the metal specificity of this Ca2+/Mg2+-mixed site toward a Ca2+-specific site. Eur. J. Biochem. 242 249–255. [DOI] [PubMed] [Google Scholar]
- Permyakov E.A., Kalinichenko, L.P., Medvedkin, V.N., Burstein, E.A., and Gerday, C. 1983. Sodium and potassium binding to parvalbumins measured by means of intrinsic protein fluorescence. Biochim. Biophys. Acta 749 185–191. [DOI] [PubMed] [Google Scholar]
- Sakaguchi N., Henzl, M.T., Thalmann, I., Thalmann, R., and Schulte, B.A. 1998. Oncomodulin is expressed exclusively by outer hair cells in the organ of Corti. J. Histochem. Cytochem. 46 29–39. [DOI] [PubMed] [Google Scholar]
- Schurr J.M., Babcock, H.P., and Fujimoto, B.S. 1994. A test of the model-free formulas. Effects of anisotropic rotational diffusion and dimerization. J. Magn. Reson. B105 211–224. [DOI] [PubMed] [Google Scholar]
- Strynadka N.C.J. and James, M.N.G. 1989. Crystal structures of the helix-loop-helix calcium-binding proteins. Annu. Rev. Biochem. 58 951–998. [DOI] [PubMed] [Google Scholar]
- Tjandra N., Feller, S.E., Pastor, R.W., and Bax, A. 1995. Rotational diffusion anisotropy of human ubiquitin from 15N NMR relaxation. J. Am. Chem. Soc. 117 12562–12566. [Google Scholar]
- Trevino C.L., Boschi, J.M., and Henzl, M.T. 1991. Interactions between residues in the oncomodulin CD domain influence Ca2+ ion-binding affinity. J. Biol. Chem. 266 11301–11308. [PubMed] [Google Scholar]
- Vuister G.W. and Bax, A. 1993. Quantitative J correlation: A new approach for measuring homonuclear three-bond J(HNHα) coupling constants in 15N-enriched proteins. J. Am. Chem. Soc. 115 7772–7777. [Google Scholar]
- Wishart D.S. and Sykes, B.D. 1994. The 13C chemical-shift index: A simple method for the identification of protein secondary structure using 13C chemical-shift data. J. Biomol. NMR 4 171–180. [DOI] [PubMed] [Google Scholar]
- Yamazaki T., Forman-Kay, J.D., and Kay, L.E. 1993. Two-dimensional NMR experiments for correlating 13Cβ and 1Hδ/ɛ chemical shifts of aromatic residues in 13C-labeled proteins via scalar couplings. J. Am. Chem. Soc. 115 11054–11055. [Google Scholar]
- Yin Y., Henzl, M.T., Lorber, B., Nakazawa, T., Thomas, T.T., Jiang, F., Langer, R., and Benowitz, L.I. 2006. Oncomodulin is a macrophage-derived signal for axon regeneration in retinal ganglion cells. Nat. Neurosci. 9 843–852. [DOI] [PubMed] [Google Scholar]
- Zweckstetter M. and Bax, A. 2000. Prediction of sterically induced alignment in a dilute liquid crystalline phase: Aid to protein structure determination by NMR. J. Am. Chem. Soc. 122 3791–3792. [Google Scholar]