Abstract
The partial molar volume (PMV) change associated with the pressure-induced structural transition of ubiquitin is analyzed by the three-dimensional reference interaction site model (3D-RISM) theory of molecular solvation. The theory predicts that the PMV decreases upon the structural transition, which is consistent with the experimental observation. The volume decomposition analysis demonstrates that the PMV reduction is primarily caused by the decrease in the volume of structural voids in the protein, which is partially canceled by the volume expansion due to the hydration effects. It is found from further analysis that the PMV reduction is ascribed substantially to the penetration of water molecules into a specific part of the protein. Based on the thermodynamic relation, this result implies that the water penetration causes the pressure-induced structural transition. It supports the water penetration model of pressure denaturation of proteins proposed earlier.
Keywords: partial molar volume, pressure denaturation, protein hydration, water penetration, 3D-RISM theory
Pressure-induced denaturation (unfolding or structural transition) of proteins has been continuously attracting the attention of biochemists and biophysicists (Silva and Weber 1993; Balny et al. 2002; Royer 2002; Balny 2006; Meersman et al. 2006) since Bridgman (1914) observed that egg white coagulated under a hydrostatic pressure of several hundred megapascals. In addition to being of scientific interest, the pressure effect has found industrial applications, particularly in the food processing industry (San Martín et al. 2002). Although the molecular mechanism of the pressure denaturation of proteins has not been completely comprehended, it is currently considered that pressure-induced effects in protein may be attributed to the penetration of water molecules into the protein interior, which stimulates the structural change (Silva and Weber 1993; Hummer et al. 1998; Balny et al. 2002; Royer 2002; Lesch et al. 2004; Paliwal et al. 2004; Collins et al. 2005; Harano and Kinoshita 2006; Meersman et al. 2006).
The question, “Why and how does pressure change the structure of a protein?” can be converted into “Why and how is the partial molar volume (PMV) of the high-pressure structure (HPS) smaller than that of the low-pressure structure (LPS) of the protein?” through the following thermodynamic relation (Balny et al. 2002):
 |
where K is the equilibrium constant between LPS and HPS,  is the difference in PMV between the two structures, and the other symbols have the usual meanings in thermodynamics. It is probably easier to answer the latter question rather than the former.
The PMV differences between two structural states of biomolecules have been successfully calculated and analyzed (Harano et al. 2001; Imai et al. 2001, 2005a, b, 2006; Yamazaki et al. 2007) by the molecular liquid theory, also known as the three-dimensional reference interaction site model (3D-RISM) (Beglov and Roux 1997; Kovalenko and Hirata 1998, 2000; Kovalenko 2003). This theory has an advantage over traditional methods based on the geometric volume calculation: Namely, the 3D-RISM theory can uncover the solvation effect on the PMV change as well as the geometric volume change. However, it does not yield the protein structure by itself, unless coupled with the molecular simulation or modeling technique (Imai et al. 2005b; Yamazaki et al. 2007). If both LPS and HPS of a protein are available, we can readily calculate and analyze the PMV change accompanying the pressure-induced structural change by the advanced method of the molecular theory of solvation.
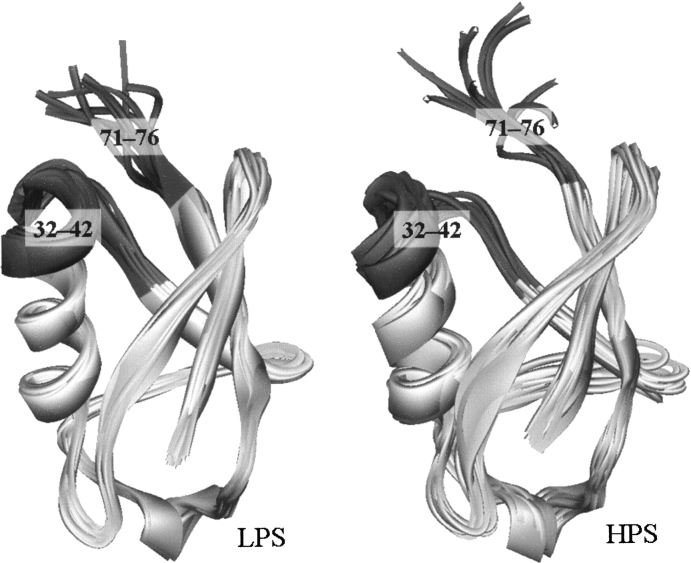
Resolving the three-dimensional (3D) structural data of proteins in aqueous solution under high pressure is currently limited because of the difficulty of the experiment. There are only three reports (Refaee et al. 2003; Williamson et al. 2003; Kitahara et al. 2005) providing us with the 3D coordinates of HPS of proteins in solution, which are determined by the high-pressure NMR technique. Those proteins are bovine pancreatic trypsin inhibitor (BPTI), hen egg-white lysozyme, and ubiquitin. The structural changes of BPTI (Williamson et al. 2003) and lysozyme (Refaee et al. 2003) are, however, very small under applied pressures, both of which are 200 MPa: The root mean square displacements (RMSDs) are ∼0.2 Å in both cases. The HPS of ubiquitin at 300 MPa is found to be significantly different in some local structure from the LPS at 3 MPa (Kitahara et al. 2005), although the secondary structures remain the same, as shown in ▶. Thus, the pressure-induced structural transition of ubiquitin can be a good model for the pressure-denaturation of proteins, at least for its initial stage.
Figure 1.
Solid ribbon representation of low-pressure (3 MPa) and high-pressure (300 MPa) structures (LPS and HPS, respectively) of ubiquitin. Each 10 superimposed structures included in PDB files 1V80 (LPS) and 1V81 (HPS) are displayed. The dark gray residues are the segments that undergo the significant displacement through the LPS-to-HPS transition (see text for details).
In this study, we calculate the PMVs of the LPS and HPS of ubiquitin by using the 3D-RISM theory. We further analyze the PMV change by decomposing it into several geometric and hydration contributions, to clarify the molecular picture of the PMV change associated with the pressure-induced structural transition. We also discuss the relation between the molecular mechanism of the PMV change and the water penetration model of pressure denaturation of proteins.
Results and Discussion
The 3D coordinates of the LPS and HPS of ubiquitin were taken from the Protein Data Bank, codes 1V80 and 1V81, respectively. Each file contains 10 structures of the most probable structures from NMR data (Kitahara et al. 2005). We have calculated the PMVs of all the structures for each of LPS and HPS by using the 3D-RISM theory. It should be noted that the PMVs were calculated under a pressure of 0.1 MPa both for LPS and HPS in order to consider the process based on Equation 1. The calculation assumes the two-state model of LPS-HPS equilibrium. In other words, each structure itself does not depend on the pressure, but the equilibrium constant does. The two-state assumption is also used in the reference data (Kitahara et al. 2001, 2005).
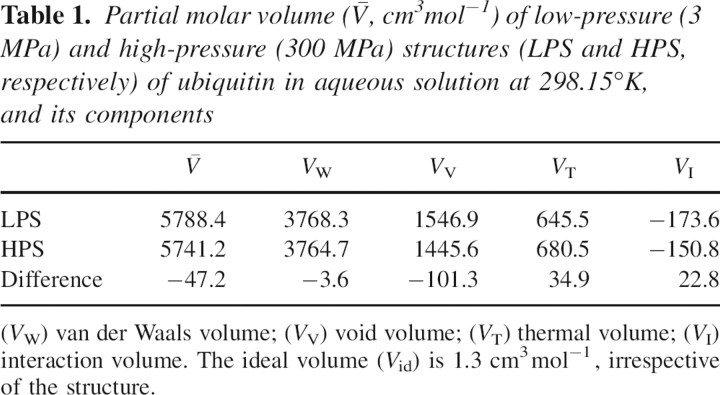
The average values calculated for the LPSs and for the HPSs are 5788.4 cm3mol−1 and 5741.2 cm3mol−1, respectively. The PMV decreases by −47.2 cm3mol−1, accompanying the pressure-induced structural transition. This theoretical result is in fair agreement with the corresponding experimental data, −24 cm3mol−1, estimated from the pressure-induced changes in the amide nitrogen and proton chemical shifts of a selected residue of ubiquitin (Kitahara et al. 2001). Besides, the PMV change is within the range of the PMV changes of pressure-induced unfolding, from 0 to −200 cm3mol−1, observed for different other proteins (Royer 2002).
To find the volume factor causing the PMV reduction, we have theoretically decomposed the PMV into several components: the van der Waals volume (V
W), the void volume (V
V), the thermal volume (V
T), and the interaction volume (V
I), in which the former two and the latter two components are the geometric and hydration contributions, respectively (see the Materials and Methods section for more details). These volume contributions to the PMV change are compiled in ▶. The total PMV decrease,  , is primarily caused by the decrease in the void volume, ΔV
V = −101.3 cm3mol−1, which is partially canceled by the increases in the two hydration terms: the thermal volume change, ΔV
T = 34.9 cm3mol−1, and the interaction volume change, ΔV
I = 22.8 cm3mol−1. The van der Waals volume change is negligible, as the pressure did not cause any unusual van der Waals overlaps. The decrease in the void volume indicates a partial loss of the structural voids in the protein. The increase in the thermal volume implies the generation of additional empty space around the protein, primarily due to the extension of the protein surface. The increment of the interaction volume typically represents the reduction of the protein–water attractive interactions causing the so-called electrostriction (Millero 1971). However, other complicated mechanisms can be involved in the interaction volume change (Imai et al. 2000, 2005a, b). These points are discussed later.
Table 1.
Partial molar volume ( ) of low-pressure (3 MPa) and high-pressure (300 MPa) structures (LPS and HPS, respectively) of ubiquitin in aqueous solution at 298.15°K, and its components
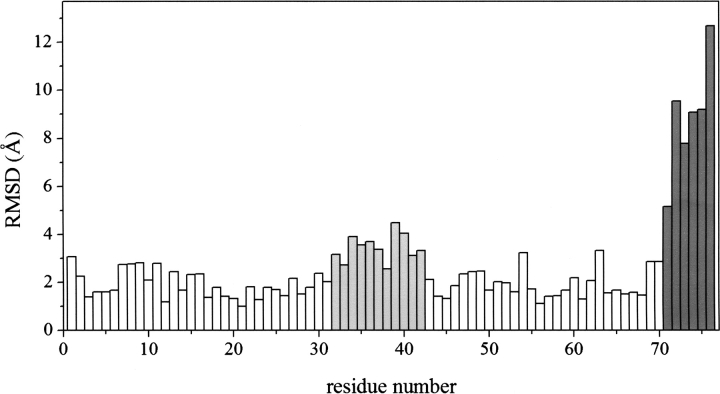
The above result leads to the question: Which parts in the protein have the most substantial effect on the volume changes? A presumable candidate is the protein segment where the structure is most drastically perturbed by the pressure. ▶ shows the RMSD per residue between LPS and HPS. It is apparent that the segment of residues 71–76, which is the N-terminal “tail” of ubiquitin (see ▶), undergoes the most significant displacement through the structural transition.
Figure 2.
Root mean square displacement (RMSD) per residue between low- and high-pressure structures of ubiquitin. Dark gray and light gray indicate the first and second highest RMSD segments, respectively.
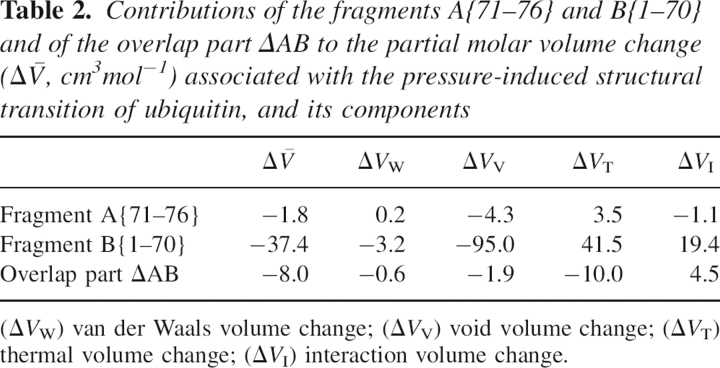
To investigate the contribution of the segment to the total volume changes, we have calculated the PMV and its components of the fragment consisting of residues 71–76 (fragment A{71–76}), as well as the other fragment, B{1–70}. Using the volume of each of the two fragments, V A and V B, the total volume V is expressed by V = V A + V B + V ΔAB, where the last term is the contribution from the overlap region ΔAB. For example, if all the vanished voids described above are located in segment A, the total decrease in the void volume, ΔV V, should be determined solely by the decrease in the void volume of the fragment A, ΔV V A; whereas, if the voids are located in the boundary region between the two segments, ΔV V should be explained by ΔV V ΔAB. ▶ lists the PMV change and its components for the fragments A and B and the contribution from the overlap part ΔAB. The result shows that the volume changes of both fragment A and the overlap part ΔAB are minor. This implies that the significant part we are looking for is located in the residual segment B.
Table 2.
Contributions of the fragments A{71–76} and B{1–70} and of the overlap part ΔAB to the partial molar volume change ( ) associated with the pressure-induced structural transition of ubiquitin, and its components
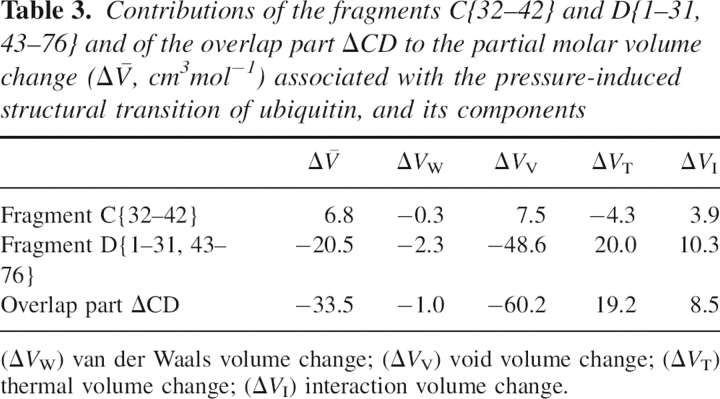
Then we shift our attention to the segment with the secondary outstanding displacement. As is seen from ▶, the segment of residues 32–42 has the secondary highest RMSD. In a similar way as above, we have calculated the volume changes of the fragments C{32–42} and D{1–31, 43–76} and the overlap (ΔCD) contributions, which are given in ▶. It is found by this analysis that the overlap contribution to the PMV change,  , accounts for the major part (71%) of the total PMV change
  , although the contribution of the excised segment
  itself is minor. The PMV decrease of the ΔCD part is primarily determined by the reduction of the void volume, ΔV
V
ΔCD = −60.2 cm3mol−1, much as for the total PMV decrease. The thermal volume of this ΔCD part increases upon the structural transition: ΔV
T
ΔCD = 19.2 cm3mol−1. The interaction volume change, ΔV
I
ΔCD = 8.5 cm3mol−1, contributes less to the PMV change.
Table 3.
Contributions of the fragments C{32–42} and D{1–31, 43–76} and of the overlap part ΔCD to the partial molar volume change ( ) associated with the pressure-induced structural transition of ubiquitin, and its components
This finding, that in the overlap part ΔCD the void volume decreases and the thermal volume increases upon the LPS-to-HPS transition, implies that solvent water molecules penetrate into the boundary region between the segments C and D through the structural transition. That is because the water penetration can eliminate the void space in the region and simultaneously can expand the thermally induced empty space between the protein and water by creating the additional surface. It is most important that the former rather than latter effect governs the total PMV change. The water penetration into the region thus reduces the PMV of ubiquitin.
Based on the increase in the interaction volume, one might be skeptical about the above conclusion, since it has been believed that the exposure of a protein site reduces the PMV of the protein regardless of whether the site is hydrophilic or hydrophobic (Kauzmann 1959; Chalikian and Breslauer 1996; Royer 2002). However, it has been suggested that the exposure of hydrophobic groups can increase the PMV depending on the conditions of its environment (Lee 1983; Imai and Hirata 2005). It is also reported that the polarization of a molecule does not always reduce the PMV (Imai et al. 2000). In fact, a similar volume analysis for the helix–coil transition of an oligo-peptide (Imai et al. 2005b) demonstrates that the interaction volume does not have a simple relation to the solvent-accessible surface area. According to those studies, the increase in the interaction volume does not conflict with the water penetration into the boundary region.
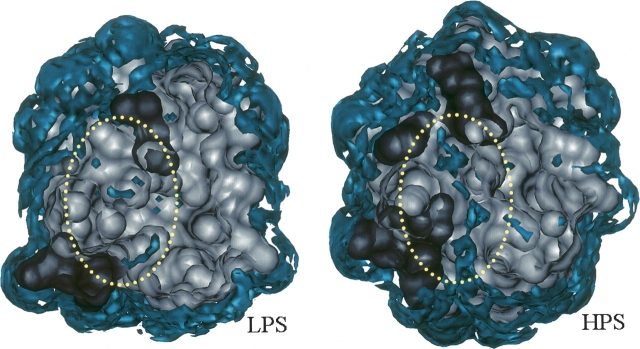
Now, we confirm the water penetration in terms of the water distribution around the protein. ▶ shows an isosurface representation of the 3D distribution functions of water oxygen g O(r) = h O(r) + 1 for LPS and HPS, which is obtained by the 3D-RISM theory. It is apparent from the figure that a structural channel is created in the boundary region between the segments C and D of HPS so that the water distribution is enhanced there. This change in the water distribution obviously indicates the water penetration predicted above by the volume analysis. Here, we should recall that the PMV is calculated from the correlation functions obtained by the 3D-RISM theory (see Materials and Methods). This means that the change in the water distribution naturally affects the PMV change through the statistical mechanical relation in our calculation. Therefore, the consistency in the two theoretical results proves that the water penetration decreases the PMV by eliminating the structural voids against the volume expansion due to additional hydration. This is the molecular mechanism of the PMV reduction associated with the pressure-induced structural transition of ubiquitin.
Figure 3.
Isosurface representation of the three-dimensional distribution function of water oxygen around low-pressure (3 MPa) and high-pressure (300 MPa) structures (LPS and HPS, respectively) of ubiquitin. The blue surfaces show the area where the distribution function is >2. The dark gray and light gray surfaces indicate the molecular surfaces of the segments C (residues 32–42) and D (residues 1–31 and 43–76) of ubiquitin, respectively. This is a top-view representation, in which the upper parts (the front parts in the figure) are clipped in order to bring the boundary region between C and D (marked by the yellow dotted circle) into view. LPS is represented by the sixth structure of 1V80, which indicates the largest void volume in the boundary region V V ΔCD, and HPS is represented by the second structure of 1V81, which indicates the smallest V V ΔCD. ▶ was produced with the visualization program VMD (Humphrey et al. 1996).
It should be emphasized that the consistency between the volume analysis and the water distribution analysis is crucial to make a conclusion on the cause of the pressure-induced structural change. If we observed only the water distribution change implying the water penetration, we could not conclude whether the water penetration was the cause or the result of the structural transition. In this study, we have found that the water penetration reduces the PMV of the protein. In addition, the thermodynamic relation Equation 1 shows that the PMV reduction induces the structural transition. Therefore, we can now conclude that the water penetration is the driving force of the pressure-induced structural transition of ubiquitin.
Here, it is worthwhile to discuss our results from the quantitative aspect. In general, the 3D-RISM theory yields a relatively lower and broader distribution function of solvent, compared to the molecular simulation (Imai et al. 2007). Nevertheless, the integral of the distribution function, which corresponds to the hydration number, is in rather quantitative agreement with that of the simulation with special treatment to reproduce the experimental observation (Imai et al. 2007). In that sense, the water penetration found in ▶ cannot be the artifact of the theory, but represents the real event, at least qualitatively. On the other hand, it has been demonstrated that the theoretical values of PMV of proteins are in quantitative agreement with the corresponding experimental data (Imai et al. 2004, 2005a). Even for the PMV difference, the theoretical results are always consistent with the experimental data, at least qualitatively (Imai et al. 2001, 2005a,b). Even if each theoretical value obtained in this study could be changed slightly in quantity, the results could not be changed in quality, and therefore the conclusions are not affected.
In conclusion, this study has demonstrated two significant findings for the pressure-induced structural transition of ubiquitin by the volume decomposition analysis and the hydration structure analysis. One is that the PMV reduction upon the transition is primarily caused by the decrease in the void volume of a specific part of the protein, which is partially canceled by the increase in the thermal volume of the same part. The other finding is that the water molecules penetrate into the region involved with the volume change accompanying the structural transition. A logical link between the two findings leads to our final conclusion: The water penetration reduces the PMV by eliminating the structural voids in the region against the volume expansion due to the additional hydration effect. According to Equation 1, we can also conclude that the water penetration causes the pressure-induced structural transition by reducing the PMV in that way. Our conclusion supports the water penetration model of the pressure denaturation of proteins (Silva and Weber 1993; Hummer et al. 1998; Balny et al. 2002; Royer 2002; Lesch et al. 2004; Paliwal et al. 2004; Collins et al. 2005; Harano and Kinoshita 2006; Meersman et al. 2006).
We believe that our conclusion for this specific protein could be generalized to other proteins. However, to make a more general conclusion on the pressure-induced denaturation of proteins, similar analysis should be applied to other proteins. This can be achieved by collecting a wide variety of protein structures under high pressure, which are expected to be determined by experimental and simulation methods in the near future.
Materials and Methods
PMV calculation by the 3D-RISM theory
The PMV of a solute molecule is calculated by the 3D-RISM theory, coupled with the Kirkwood-Buff (KB) solution theory (Kirkwood and Buff 1951) extended to the 3D-RISM description (Harano et al. 2001). First, we obtain the 3D spatial correlation functions of solvent around the solute from the intermolecular potentials and the thermodynamic conditions by using the 3D-RISM theory. Then, we calculate the PMV from the correlation functions through the KB theory. Here, we provide only a brief outline of the theoretical methods.
For a solute–solvent system at infinite dilution, the 3D-RISM integral equation
 |
is solved simultaneously with the 3D spatial generalization of the hypernetted chain (HNC) approximation
in order to obtain the total and direct correlation functions h
γ(r) and c
γ(r) of solvent site γ in the 3D space (Beglov and Roux 1997; Kovalenko and Hirata 1998, 2000; Kovalenko 2003). In the above equations, u
γ(r) is the interaction potential function between solvent site γ and the whole solute specified on the 3D grid; 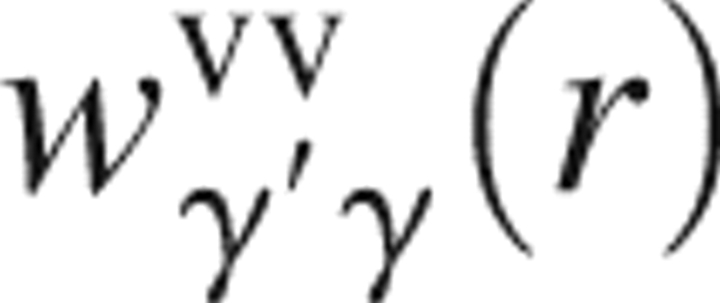 and
and 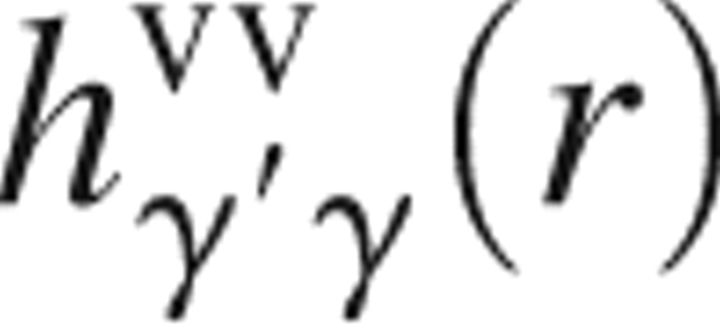 are, respectively, the site–site intramolecular and total correlation functions of solvent; ρ is the number density of the solvent; and β = 1/(k
B
T) is the inverse of the Boltzmann constant times temperature; all of which are the input to the 3D-RISM theory. The site–site total correlation functions of solvent,
  , are obtained in advance from a single-component RISM theory for pure solvent. In this study, we adopt the dielectrically consistent RISM (DRISM) theory (Perkyns and Pettitt 1992) for bulk solvent.
The 3D potential function u γ(r) is calculated on the supercell grid using the minimum image convention and the Ewald summation methods, from the conventional site–site pair potential, which consists of the Lennard-Jones and Coulomb terms. The convolution integral in Equation 2 is calculated by the 3D fast Fourier transform technique. The long-range electrostatic asymptotics of all the correlation functions in Equations 2 and 3 are separated out and treated analytically, including the special corrections for the 3D supercell finiteness, which is critical to provide accurate calculation for solutes containing site charges (Kovalenko and Hirata 2000; Kovalenko 2003).
The PMV  is calculated from the 3D direct correlation functions c
γ(r) through the 3D-RISM-KB equation (Harano et al. 2001):
 |
where χT is the isothermal compressibility of pure solvent, which is obtained from the site–site correlation functions of the pure solvent (Imai et al. 2000).
Volume decomposition in the theoretical manner
The PMV can be decomposed into several contributions including the geometric and hydration terms of the molecular description. Based on the idea of Chalikian and Breslauer (1996), we decompose the PMV into five terms:
where V id is the ideal contribution to PMV from the translational degrees of freedom of solute, V W is the van der Waals volume, V V is the volume of structural voids within the solvent-inaccessible core, V T is the so-called thermal volume that results from thermally induced molecular fluctuations between the solute and solvent and is considered as average empty space around the solute due to imperfect packing of the solvent, and V I is the change in the solvent volume induced by the intermolecular interaction between the solute and solvent.
All the volume terms can be defined and calculated within the theoretical framework (Imai et al. 2001, 2005a,b, 2006). The ideal volume V
id = k
B
TχT is naturally included in the KB equation. This term does not depend on the solute conformation, since it is determined only by the solvent property. The van der Waals volume V
W is the volume occupied by the atomic spheres. The void volume V
V is defined as void space inside the solute molecule and at its surface the solvent probe cannot access it. The two geometric terms are obtained from the conventional volume calculation, using the atomic diameters converted from the Lennard-Jones parameters employed in the 3D-RISM calculation. The thermal volume V
T is defined by  , where
  is the PMV of a hypothetical molecule whose atomic charges are completely removed. Thus, V
T is the solvent-packing effect other than the effect due to the solute–solvent electrostatic interaction. The interaction volume
  is defined as the contribution of the electrostatic interaction. The PMVs
  and
and  are calculated from the 3D-RISM-KB theory as described above.
Models and parameters
We used Amber99 parameters (Wang et al. 2000) for ubiquitin and the SPC/E model (Berendsen et al. 1987) for water, with a correction concerning the Lennard-Jones parameters of the hydrogen sites (Pettitt and Rossky 1982) (σ = 0.4 Å and ɛ = 0.05 kcal/mol−1). The ubiquitin–water Lennard-Jones potential parameters were obtained from the Lorentz-Berthelot mixing rules. We calculated the PMV in ambient water at the temperature 298.15°K, and with the number density 0.033329 Å−3 and dielectric constant 78.4 taken from experiment. The 3D-RISM/HNC equations were solved on a grid of 128 × 128 × 128 points in a cubic supercell of size 64 × 64 × 64 Å3, which is sufficiently large to accommodate the protein molecule with enough solvation space.
In the geometric volume calculation for V
W and V
V, the diameter of each atom was set to the distance 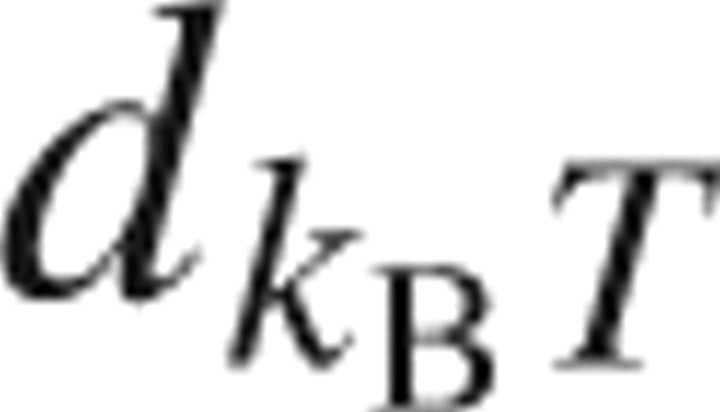 where the Lennard-Jones potential energy reaches the thermal energy k
B
T. The diameter of the solvent probe was determined from the parameters of the SPC/E oxygen in the same manner. This definition is reasonable when we convert the Lennard-Jones parameter into the atomic diameter (Imai et al. 2005a). The geometric calculation was carried out by using the Alpha Shapes program (Edelsbrunner et al. 1995).
Root mean square displacement between low- and high-pressure structures
The RMSD per residue between LPS (PDB code 1V80) and HPS (1V81), each of which contains 10 probable structures, is defined by
 |
where i and j indicate, respectively, the residue number and the heavy-atom number in the residue, which consists of ni heavy atoms; a and b represent the structure number of LPS and HPS, respectively; and x is the 3D coordinate of a specified heavy atom after being superimposed onto each other among the 20 structures.
Acknowledgments
This work was supported in part by Grant-in-Aid for Scientific Research on Priority Areas (No. 15076212) from the Ministry of Education, Culture, Sports, Science and Technology (MEXT), Japan and by the Next Generation Super Computing Project, Nanoscience Program, MEXT, Japan. T.I. acknowledges the support of the “High-Tech Research Center” Project for Private Universities, MEXT, Japan. A.K. acknowledges support from the National Research Council of Canada.
Footnotes
Reprint requests to: Takashi Imai, Department of Bioscience and Bioinformatics, Ritsumeikan University, Kusatsu, Shiga 525-8577, Japan; e-mail: t-imai@is.ritsumei.ac.jp; fax: 81-77-561-5281.
Article published online ahead of print. Article and publication date are at http://www.proteinscience.org/cgi/doi/10.1110/ps.072909007.
References
- Balny C. 2006. What lies in the future of high-pressure bioscience? Biochim. Biophys. Acta 1764 632–639. [DOI] [PubMed] [Google Scholar]
- Balny C., Masson, P., and Heremans, K. 2002. High pressure effects on biological macromolecules: From structural changes to alteration of celluar processes. Biochim. Biophys. Acta 1595 3–10. [DOI] [PubMed] [Google Scholar]
- Beglov D. and Roux, B. 1997. An integral equation to describe the solvation of polar molecules in liquid water. J. Phys. Chem. B 101 7821–7826. [Google Scholar]
- Berendsen H.J.C., Grigera, J.R., and Straatsma, T.P. 1987. The missing term in effective pair potentials. J. Phys. Chem. 91 6269–6271. [Google Scholar]
- Bridgman P.W. 1914. The coagulation of albumen by pressure. J. Biol. Chem. 19 511–512. [Google Scholar]
- Chalikian T.V. and Breslauer, K.J. 1996. On volume changes accompanying conformational transition of biopolymers. Biopolymers 39 619–626. [DOI] [PubMed] [Google Scholar]
- Collins M.D., Hummer, G., Quillin, M.L., Matthews, B.W., and Gruner, S.M. 2005. Cooperative water filling of a nonpolar protein cavity observed by high-pressure crystallography and simulation. Proc. Natl. Acad. Sci. 102 16668–16671. [DOI] [PMC free article] [PubMed] [Google Scholar]
- Edelsbrunner H., Facello, M., Fu, P., and Liang, J. 1995. Proceedings of the 28th annual Hawaii international conference on system sciences, Los Alamitos, CA.
- Harano Y. and Kinoshita, M. 2006. Crucial importance of translational entropy of water in pressure denaturation of proteins. J. Chem. Phys. 125 024910. doi: 10.1063/1.2217011. [DOI] [PubMed] [Google Scholar]
- Harano Y., Imai, T., Kovalenko, A., Kinoshita, M., and Hirata, F. 2001. Theoretical study for partial molar volume of amino acids and polypeptides by the three-dimensional reference interaction site model. J. Chem. Phys. 114 9506–9511. [Google Scholar]
- Hummer G., Garde, S., García, A.E., Paulaitis, M.E., and Pratt, L.R. 1998. The pressure dependence of hydrophobic interactions is consistent with the observed pressure denaturation of proteins. Proc. Natl. Acad. Sci. 95 1552–1555. [DOI] [PMC free article] [PubMed] [Google Scholar]
- Humphrey W., Dalke, A., and Schulten, K. 1996. VMD: Visual molecular dynamics. J. Mol. Graph. 14 33–38. [DOI] [PubMed] [Google Scholar]
- Imai T. and Hirata, F. 2005. Hydrophobic effects on partial molar volume. J. Chem. Phys. 22 094509. doi: 10.1063/1.1854626. [DOI] [PubMed] [Google Scholar]
- Imai T., Kinoshita, M., and Hirata, F. 2000. Theoretical study for partial molar volume of amino acids in aqueous solution: Implication of ideal fluctuation volume. J. Chem. Phys. 112 9469–9478. [Google Scholar]
- Imai T., Harano, Y., Kovalenko, A., and Hirata, F. 2001. Theoretical study for volume changes associated with the helix-coil transition of peptides. Biopolymers 59 512–519. [DOI] [PubMed] [Google Scholar]
- Imai T., Kovalenko, A., and Hirata, F. 2004. Solvation thermodynamics of protein studied by the 3D-RISM theory. Chem. Phys. Lett. 395 1–6. [Google Scholar]
- Imai T., Kovalenko, A., and Hirata, F. 2005a. Partial molar volume of proteins studied by the three-dimensional reference interaction site model theory. J. Phys. Chem. B 109 6658–6665. [DOI] [PubMed] [Google Scholar]
- Imai T., Takekiyo, T., Kovalenko, A., Hirata, F., Kato, M., and Taniguchi, Y. 2005b. Theoretical study of volume changes associated with the helix-coil transition of an alanine-rich peptide in aqueous solution. Biopolymers 79 97–105. [DOI] [PubMed] [Google Scholar]
- Imai T., Isogai, H., Seto, T., Kovalenko, A., and Hirata, F. 2006. Theoretical study of volume changes accompanying xenon-lysozyme binding: Implications for the molecular mechanism of pressure reversal of anesthesia. J. Phys. Chem. B 110 12149–12154. [DOI] [PubMed] [Google Scholar]
- Imai T., Hiraoka, R.T., Kovalenko, A., and Hirata, F. 2007. Locating missing water molecules in protein cavities by the three-dimensional reference interaction site model theory of molecular solvation. Proteins Struct. Funct. Bioinformat. 66 804–813. [DOI] [PubMed] [Google Scholar]
- Kauzmann W. 1959. Some factors in the interaction of protein denaturation. Adv. Protein Chem. 14 1–63. [DOI] [PubMed] [Google Scholar]
- Kirkwood J.G. and Buff, F.P. 1951. The statistical mechanical theory of solutions. I. J. Chem. Phys. 19 774–777. [Google Scholar]
- Kitahara R., Yamada, H., and Akasaka, K. 2001. Two folded conformers of ubiquitin revealed by high-pressure NMR. Biochemistry 40 13556–13563. [DOI] [PubMed] [Google Scholar]
- Kitahara R., Yokoyama, S., and Akasaka, K. 2005. NMR snapshots of a fluctuating protein structure: Ubiquitin at 30 bar–3 kbar. J. Mol. Biol. 347 277–285. [DOI] [PubMed] [Google Scholar]
- Kovalenko A. 2003. Three-dimensional RISM theory for molecular liquids and solid-liquid interface. In Molecular theory of solvation (ed. F. Hirata), pp. 169–275. Kluwer Academic Publishers, Dordrecht, Netherlands.
- Kovalenko A. and Hirata, F. 1998. Three-dimensional density profiles of water in contact with a solute of arbitrary shape: A RISM approach. Chem. Phys. Lett. 290 237–244. [Google Scholar]
- Kovalenko A. and Hirata, F. 2000. Potentials of mean force of simple ions in ambient aqueous solution. I. Three-dimensional reference interaction site model approach. J. Chem. Phys. 112 10391–10402. [Google Scholar]
- Lee B. 1983. Partial molar volume from the hard-sphere mixture model. J. Phys. Chem. 87 112–118. [Google Scholar]
- Lesch H., Schlichter, J., Friedrich, J., and Vanderkooi, J.M. 2004. Molecular probes: What is the range of their interaction with the environment? Biophys. J. 86 467–472. [DOI] [PMC free article] [PubMed] [Google Scholar]
- Meersman F., Dobson, C.M., and Heremans, K. 2006. Protein unfolding, amyloid fibril formation and configurational energy landscapes under high pressure conditions. Chem. Soc. Rev. 35 908–917. [DOI] [PubMed] [Google Scholar]
- Millero F.J. 1971. The molar volume of electrolytes. Chem. Rev. 71 147–176. [Google Scholar]
- Paliwal A., Asthagiri, D., Bossev, D.P., and Paulaitis, M.E. 2004. Pressure denaturation of staphylococcal nuclease studied by neutron small-angle scattering and molecular simulation. Biophys. J. 87 3479–3492. [DOI] [PMC free article] [PubMed] [Google Scholar]
- Perkyns J.S. and Pettitt, B.M. 1992. A dielectrically consistent interaction site theory for solvent-electrolyte mixtures. Chem. Phys. Lett. 190 626–630. [Google Scholar]
- Pettitt B.M. and Rossky, P.J. 1982. Integral equation predictions of liquid state structure for waterlike intermolecular potentials. J. Chem. Phys. 77 1451–1457. [Google Scholar]
- Refaee M., Tezuka, T., Akasaka, K., and Williamson, M.P. 2003. Pressure-dependent changes in the solution structure of hen egg-white lysozyme. J. Mol. Biol. 327 857–865. [DOI] [PubMed] [Google Scholar]
- Royer C.A. 2002. Revisiting volume changes in pressure-induced protein folding. Biochim. Biophys. Acta 1595 201–209. [DOI] [PubMed] [Google Scholar]
- San Martín M.F., Barbosa-Cánovas, G.V., and Swanson, B.G. 2002. Food processing by high hydrostatic pressure. Crit. Rev. Food Sci. Nutr. 42 627–645. [DOI] [PubMed] [Google Scholar]
- Silva J.L. and Weber, G. 1993. Pressure stability of proteins. Annu. Rev. Phys. Chem. 44 89–113. [DOI] [PubMed] [Google Scholar]
- Wang J., Cieplak, P., and Kollman, P.A. 2000. How well does a restrained electrostatic potential (RESP) model perform in calculating conformational energies of organic and biological molecules? J. Comput. Chem. 21 1049–1074. [Google Scholar]
- Williamson M.P., Akasaka, K., and Refaee, M. 2003. The solution structure of bovine pancreatic trypsin inhibitor at high pressure. Protein Sci. 12 1971–1979. [DOI] [PMC free article] [PubMed] [Google Scholar]
- Yamazaki T., Imai, T., Hirata, F., and Kovalenko, A. 2007. Theoretical study of the cosolvent effect on the partial molar volume change of staphylococcal nuclease associated with pressure denaturation. J. Phys. Chem. B 111 1206–1212. [DOI] [PubMed] [Google Scholar]


