Abstract
Intestinal fatty acid binding protein (IFABP) interacts with biological membranes and delivers fatty acid (FA) into them via a collisional mechanism. However, the membrane-bound structure of the protein and the pathway of FA transfer are not precisely known. We used molecular dynamics (MD) simulations with an implicit membrane model to determine the optimal orientation of apo- and holo-IFABP (bound with palmitate) on an anionic membrane. In this orientation, the helical portal region, delimited by the αII helix and the βC-βD and βE-βF turns, is oriented toward the membrane whereas the putative β-strand portal, delimited by the βB-βC, βF-βG, βH-βI turns and the N terminus, is exposed to solvent. Starting from the MD structure of holo-IFABP in the optimal orientation relative to the membrane, we examined the release of palmitate via both pathways. Although the domains can widen enough to allow the passage of palmitate, fatty acid release through the helical portal region incurs smaller conformational changes and a lower energetic cost.
Keywords: molecular dynamics simulation, implicit membrane, fatty acid binding protein, palmitate, fatty acid exit site, free energy of binding
Fatty acid binding proteins (FABPs) belong to a family of small cytosolic lipid-binding proteins, comprising at least nine proteins: liver (L), intestinal (I), heart (H), adipocyte (A), epidermal (E), brain (B), myelin (M), and testicular (T) FABPs and ileal lipid binding protein (ILBP) (Zimmerman and Veerkamp 2002). Although they are named after the tissue they were initially isolated or identified from, it is not uncommon that different FABPs are found in the same tissue. The molecular mass of FABPs is 14–15 kDa and each of them consists of 126–134 amino acids. It is believed that they engage in the uptake and trafficking of long fatty acids (Storch and Thumser 2000; Wolfrum et al. 2001; van Bilsen et al. 2002; Zimmerman and Veerkamp 2002; Massolini and Calleri 2003), though their precise physiological roles have yet to be established.
While the overall amino acid sequences of the nine FABPs exhibit 22%–73% similarity (Zimmerman and Veerkamp 2002), their three-dimensional structure is highly conserved. The common structural motif consists of 10 antiparallel β-strands forming a β-barrel capped by a helix–turn–helix motif (Sacchettini et al. 1989; Xu et al. 1992; Cowan et al. 1993; Lassen et al. 1995; Lücke et al. 1996; Thompson et al. 1997; Hohoff et al. 1999; Balendiran et al. 2000). Each β-barrel contains an internal cavity, filled with ordered water molecules and able to bind fatty acids and other hydrophobic ligands. Ligand binding displaces some of the water molecules, but a few of them remain in the cavity. The volume of the cavity varies between 300 and 700 Å3 (Massolini and Calleri 2003). The unique feature of LFABP is its large-size cavity (Thompson et al. 1999a,b), which can accommodate two fatty acids simultaneously (Thompson et al. 1997) or a variety of more bulky nonpolar anionic ligands, such as fatty-acyl CoAs, lysophospholipids, and bile acids (Thompson et al. 1999a,b; Hagan et al. 2002). ILBP has the tendency to bind larger ligands but has no affinity for FAs (Zimmerman et al. 2001).
In the crystal structure of IFABP bound with palmitate (Sacchettini et al. 1989), the carboxyl group of FA is held in the center of the β-barrel via electrostatic interactions with R106 and hydrogen bonds involving Q115 and two ordered water molecules, whereas its hydrocarbon tail, stabilized by hydrophobic interactions, is bent and extends toward the helical region of the protein. It has been hypothesized that the fatty acid enters and/or exits the cavity of FABPs through the helical portal region (Zanotti et al. 1994; Cistola et al. 1996; Glatz and van der Vusse 1996; Herr et al. 1996; Hodsdon and Cistola 1997a,b; Ory et al. 1997; Córsico et al. 1998; Richieri et al. 1999; Likic and Prendergast 2001; Bakowies and van Gunsteren 2002; Jenkins et al. 2002; Friedman et al. 2006) or the putative β-strand (“alternative”) portal (Sacchettini et al. 1989).
The FA transfer from/to FABPs either involves collisional interaction of FABPs with membranes or occurs by aqueous diffusion (Storch et al. 1996; Storch and Thumser 2000). The former is observed in fluorescent anthroyloxy-labeled fatty acid (AOFA) transfer by AFABP, IFABP, and HFABP; its transfer by LFABP follows the latter mechanism (Storch et al. 1996, 2002; Gericke et al. 1997; Córsico et al. 1998; Liou and Storch 2001; Liou et al. 2002). It seems that the transfer mechanism depends strongly on electrostatic interactions between positively charged lysine residues on the protein surface and an anionic membrane, but also, though to a lesser extent, on hydrophobic interactions. Acetylation of all surface lysine residues of AFABP (Herr et al. 1995) or of HFABP (Herr et al. 1996) switched the transfer mechanism from collisional to diffusional. In contrast, acetylation of lysine residues of IFABP did not alter the transfer mechanism and increased the transfer rate of FA to zwitterionic SUVs (Córsico et al. 2005), implying that hydrophobic interactions play a role.
The goal of this computational study was to determine the optimal orientation of apo- and holo-IFABP on a planar anionic membrane and the pathway of FA transfer into the membrane. Although simulations of proteins in explicit solvent and/or membrane are most realistic, they cannot be used when the orientation of the protein relative to the membrane is not known because of high computational cost, long timescales for protein reorientation, and the difficulty of computing relative free energies. Therefore we employed an implicit membrane model, IMM1 (Lazaridis 2003). This model is an extension of the EEF1 model for soluble proteins (Lazaridis and Karplus 1999) and treats the membrane as a hydrophobic slab. Charges on the membrane are accounted for using the Gouy–Chapman theory (IMM1-GC model; Lazaridis 2005), which assumes that charges are uniformly smeared on the membrane surface and thus neglects discrete charge effects and local charge fluctuations (McLaughlin 1989). Implicit treatment of the membrane leads to at least one order of magnitude savings in CPU time and shortens the timescale for large configurational or conformational changes. Limitations of the model are the neglect of membrane deformations, lipid rearrangements, or specific protein–membrane interactions. However, these limitations are not considered serious for the study at hand. Using IMM1-GC, MD simulations were performed on the membrane-interacting holo-IFABP to select between the helical portal and putative β-strand portal hypotheses of FA release, based on the calculated conformational changes and energy barriers.
Results
IFABP in water
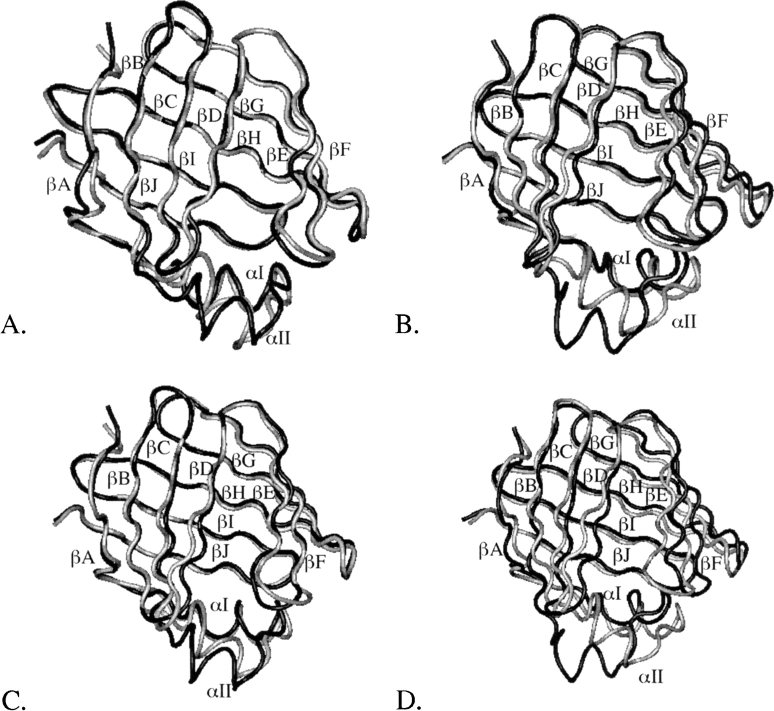
Two-nanosecond MD simulations of apo-IFABP were run in implicit water using four different random numbers to initialize velocities. The average energies calculated from the last 1.6 ns of simulations differ by less than 3 kcal/mol. The average root mean square deviations (RMSD) of backbone (β-barrel only) atoms from the crystal structure range between 1.8 and 2.7 (1.6 and 2.5) Å. When superimposed on the crystal structure, the largest deviations are in the αII helix, βD-βE gap, and in loop regions (see ▶). Similarly, the average energies of IFABP bound with palmitate calculated from four MD simulations in water differ by less than ∼7 kcal/mol. The average backbone (β-barrel only) RMSD from the crystal structure is between 1.8 and 2.2 (1.6 and 1.9) Å, thus smaller than in the apo-IFABP. The largest deviations from the crystal structure are in the αII helix, βB-βC, βC-βD, and βE-βF turns, as can be seen in ▶.
Figure 1.
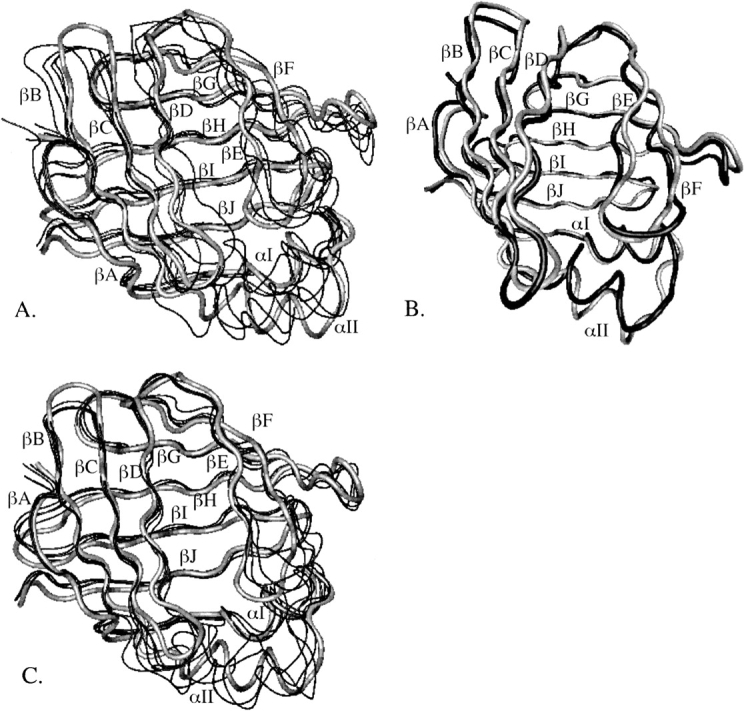
The crystal structure of apo-IFABP superimposed on four MD structures obtained from simulations in water (A) or the lowest energy MD structure on an anionic membrane (B). The crystal structure of holo-IFABP superimposed on four MD structures from simulations in water (C). The crystal structure is shown in gray. The structures in water are the energy-minimized average structures calculated from the last 1.6 ns of four MD simulations; the MD structure on the membrane is the energy-minimized structure obtained at the end of 2-ns MD simulations.
The structural differences between the crystal structures of apo- and holo-IFABP are minute, as shown in ▶. The backbone (β-barrel only) RMSD between the two structures is 0.6 (0.6) Å. The energy-minimized average structures of apo- and holo-IFABP, obtained from the four 2-ns MD simulations in water, however, show more prominent deviations, especially in the αII helix, αII-βB, βB-βC, βC-βD, and βE-βF loops and βD-βE gap, as depicted in ▶. Interestingly, it was observed in NMR studies that the αII helix and αII-βB and βC-βD loops of apo-IFABP have higher rates of amide 1H exchange, low order parameters, and sizable conformational exchange terms (Hodsdon and Cistola 1997a,b). The MD structures of apo-IFABP also showed more significant deviations from the crystal structure than the holo-IFABP (Bakowies and van Gunsteren 2002). Higher structural fluctuations in the αII helix and βE-βF turn of apo-form than in the holo-form or in the crystal structure were observed in MD simulations of AFABP in water (Rich and Evans 1996) as well, and thus are not specific only to IFABP.
Figure 2.
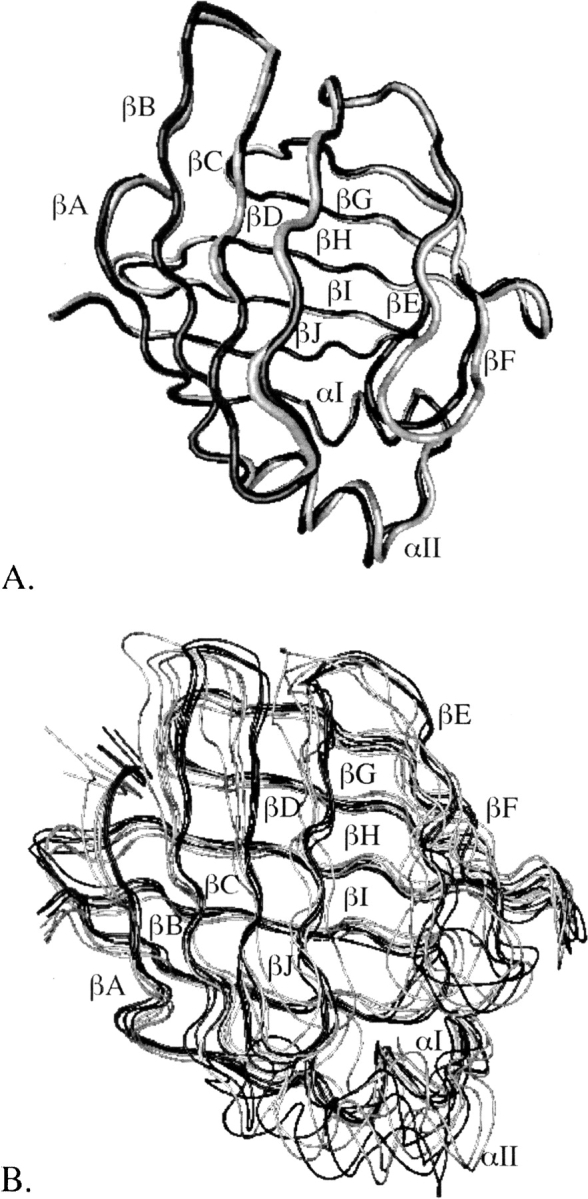
The holo-IFABP structure (shown in black) superimposed on the apo-IFABP structure (shown in gray). (A) Crystal structures. (B) Energy-minimized average structures obtained over the last 1.6 ns of four MD simulations in water.
The optimal orientation
Twenty-four 2-ns MD simulations of apo-IFABP were run on an anionic membrane, starting from the six orientations of the protein relative to the membrane and with four different random number seeds. Out of the 24 simulations, binding to the membrane took place in 13 simulations, with the orientation shown in ▶. In the other 11 simulations, the protein did not bind to the membrane. The effective energy of the shown conformation is at least 11 kcal/mol lower than that of the other 12 structures and ∼1.3 kcal/mol lower than the energy of the same conformation in water. The GC energy is about −1.7 kcal/mol, implying that binding of IFABP to the membrane is entirely driven by favorable electrostatic interactions between positively charged residues on the protein surface and the negatively charged headgroups of the membrane. The center of mass of the protein is at z ∼40 Å (i.e., ∼40 Å from the membrane center and ∼24 Å above the plane of the phosphates). The RMSD of the backbone (β-barrel only) atoms from the crystal structure is 1.9 (1.4) Å; the RMSD of distances between the Cα atoms in βD and βE strands (“gap RMSD”) is 0.6 Å. The structure superimposes well on the crystal structure, as shown in ▶. Compared to the structure in water (▶), it appears that the presence of the membrane reduces the disorder in the αII helix.
Figure 3.
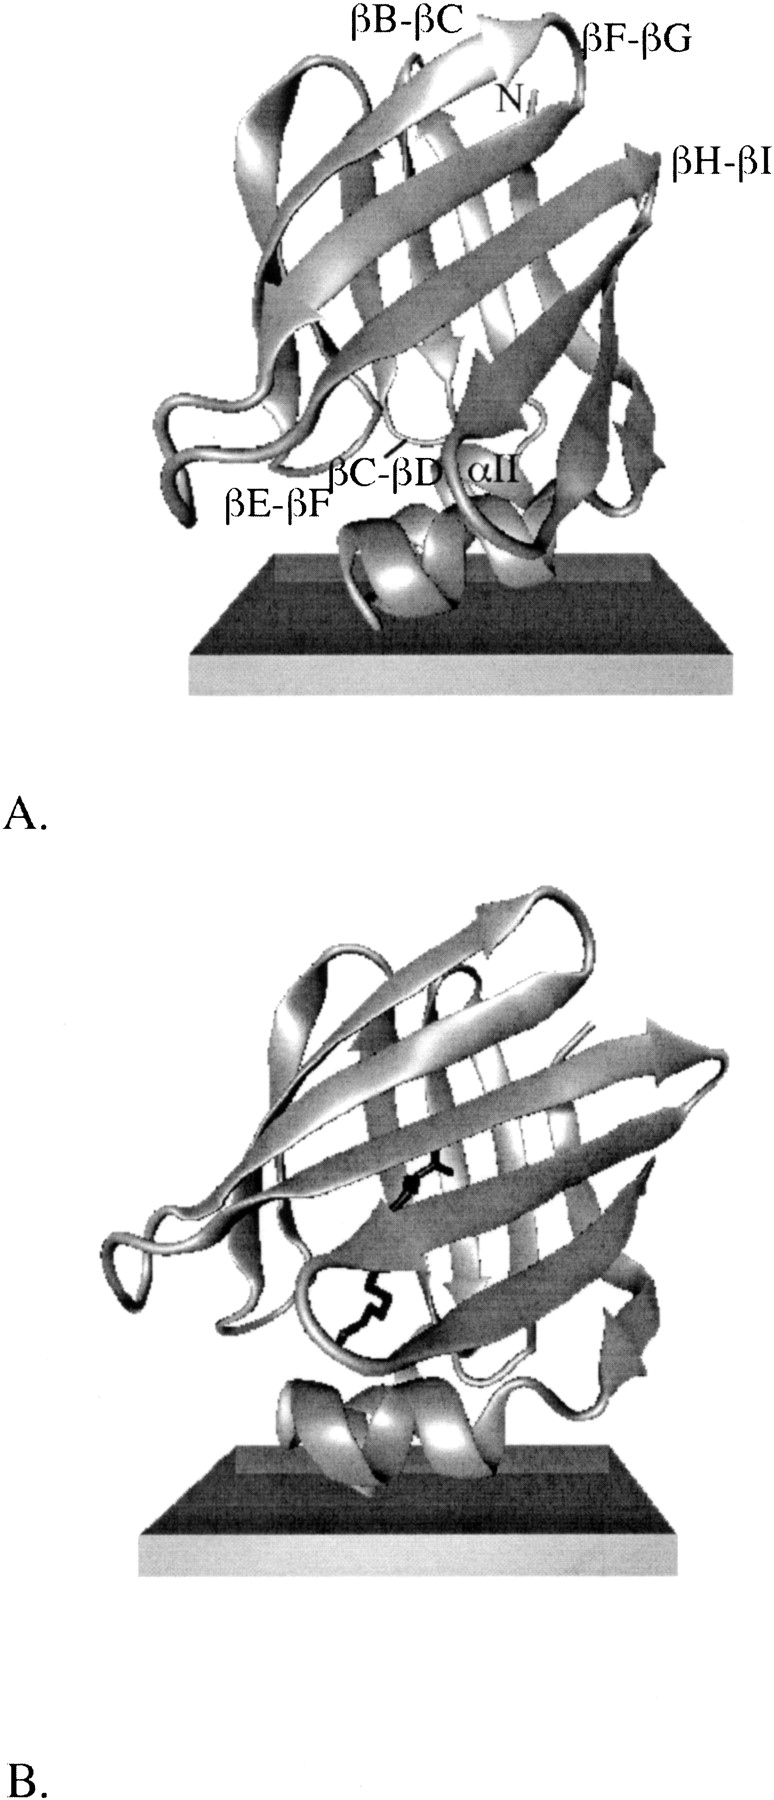
The optimal orientation of apo-IFABP (A) and of IFABP bound with palmitate (B) relative to an anionic membrane. The structures are obtained at the end of 2-ns MD simulations, after energy minimization. The membrane is depicted by the rectangular box; the upper surface represents the plane of smeared charge (located at z = 16 Å); the lower surface represents the hydrophobic tail/headgroup boundary (located at z = 13 Å).
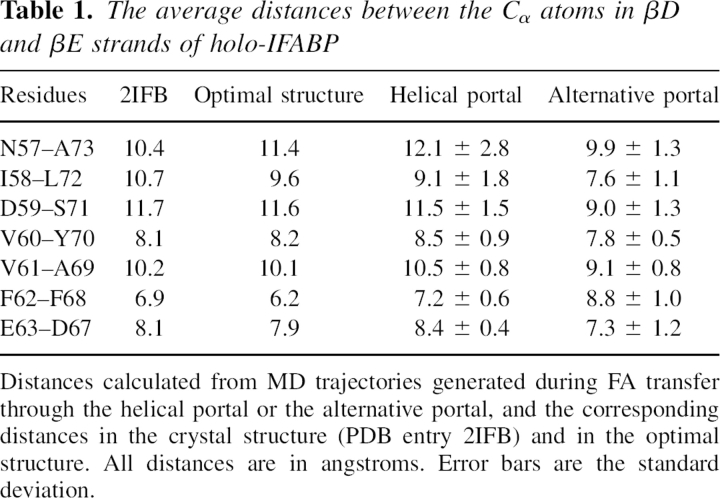
Twenty-four 2-ns MD simulations were also run on holo-IFABP. Binding of the holo-IFABP to the anionic membrane was observed in half of them, with the same orientation at the end of the simulations (see ▶), regardless of the initial orientation, and similar effective binding energy (between −0.85 and −1.68 kcal/mol); in the other 12 orientations the protein moved away from the membrane. The lowest energy structures exhibit large backbone, β-barrel only, and gap RMSD from the crystal structure, so we selected the structure with the smallest RMSD as the initial structure for the FA transfer simulations. This structure is shown in ▶, and, henceforth, it will be referred to as the optimal structure. The backbone (β-barrel only) RMSD from the crystal structure is 2.0 (1.5) Å, the gap RMSD is 0.7 Å, and the distances between the Cα atoms in βD and βE strands are given in ▶.
Table 1.
The average distances between the Cα atoms in βD and βE strands of holo-IFABP
The center of mass of the protein is at 40 Å (i.e., 24 Å above the plane of the phosphates). The energy of the structure in ▶ is ∼1.4 kcal/mol lower than that of the same structure in water. As in the case of apo-IFABP, binding to the membrane is driven by electrostatic interactions between positively charged amino acids and negatively charged membrane surface (the GC energy term is −1.8 kcal/mol). Among positively charged residues, R28 and K29, located in the αII helix, and H33, located in the αII-βB loop, are closest to the membrane and contribute favorably to membrane binding (their charges are within 1 Debye length, which for a 0.1 M monovalent solution is ∼10 Å, from the plane of smeared charge). This is consistent with the finding that charge reversal on K29 (K29E) dramatically reduces sensitivity to membrane surface charges and significantly decreases 12-(9-anthroyloxy)oleic acid transfer rate to anionic membranes, suggesting that K29 is involved in protein–membrane interactions (Falomir-Lockhart et al. 2006).
It is questionable whether and to what extent two glutamates located in the αI helix, namely E15 and E19, interfere with membrane binding. Their CD atoms are at z = 25 Å and 23 Å in the apo-IFABP and at z = 26 Å and 24 Å in the holo-IFABP, thus at the outer boundary of 1 Debye length. Given their positions and the pH ∼7, the ionization states of the glutamates should not be strongly affected by the membrane. A procedure for calculating ionization states of acidic residues in the proximity of anionic membranes has been detailed in our previous paper (Mihajlovic and Lazaridis 2006), but this was deemed unnecessary in the present situation and a standard, ionized form was used for the glutamates.
It should be noted in ▶ that the helical portal region, demarcated by the αII helix and the βC-βD and βE-βF turns, is oriented toward the membrane. The alternative portal, located on the opposite side of the protein and delimited by the βB-βC, βF-βG, and βH-βI turns and the N-terminus, is exposed to solvent. The position of palmitate is also of interest. If the fatty acid exits the cavity through the helical portal region, the hydrocarbon tail likely goes out first, followed by the carboxyl group. On the other hand, if the exit takes place through the alternative portal, the carboxyl group should exit before the tail.
FA transfer from IFABP through the helical portal region
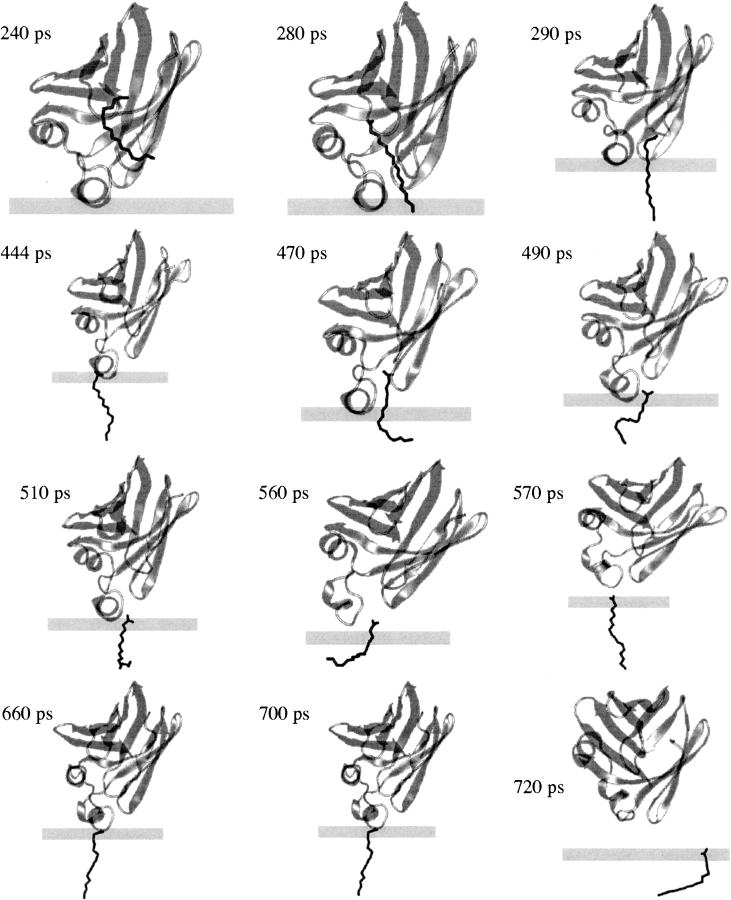
After a 100-ps equilibration of the optimal structure at T = 298°K, a 1-ns MD simulation was performed with an external force applied on the fatty acid to bring it out of the protein. To simulate the exit through the helical portal region, a force of 15 pN was applied on the C16 atom (the tail) of palmitate, which, in the initial structure, is already located within the helical portal (see ▶). The force is applied in the −z-direction, i.e., toward the membrane. ▶ shows snapshots from the simulation and ▶ shows the difference in the position of center of mass of IFABP and that of palmitate. To trail the pathway of the carboxyl group during the transfer, we calculated transient hydrogen bonds between the carboxyl oxygens of FA and IFABP from the MD trajectory. The hydrogen bond donors are shown in ▶.
Figure 4.
The transfer of palmitate from the membrane bound holo-IFABP to the membrane via the helical portal region. The membrane is represented by the rectangle; the upper surface corresponds to the plane of smeared charge; the lower surface is the hydrocarbon/headgroup boundary.
Figure 5.
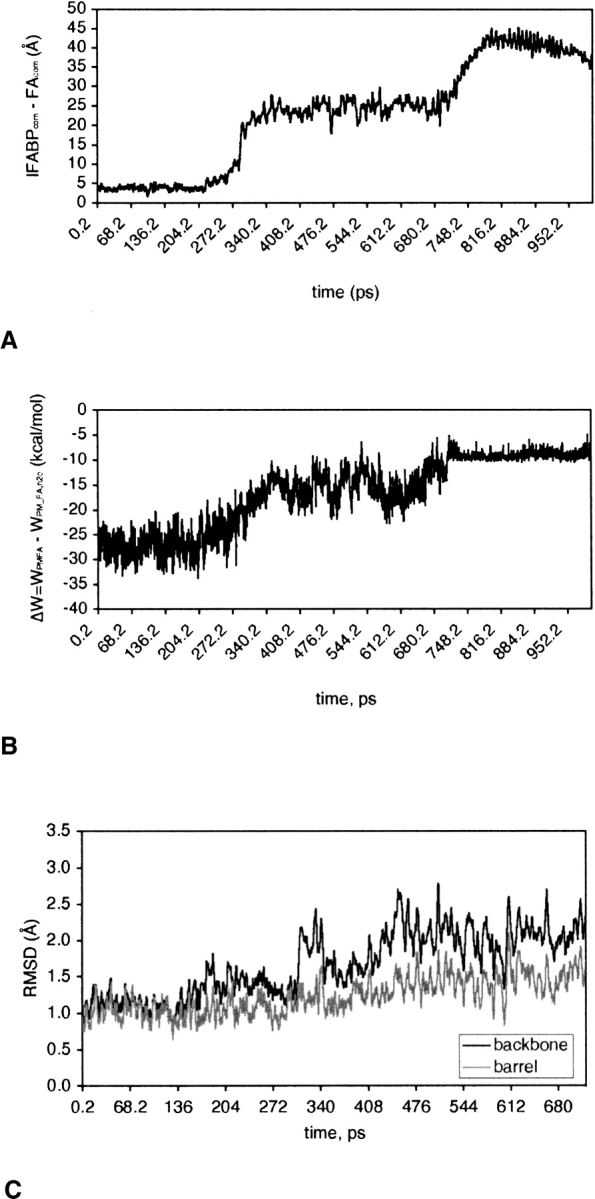
(A) The distance between the center of mass of IFABP (IFABPcom) and that of palmitate (FAcom) during FA transfer from the holo-IFABP to an anionic membrane through the helical portal region. (B) The change in effective energy of FA during its release, calculated as the difference in the effective energy of the IFABP-FA-membrane complex (WPMFA) and of the same conformation but with FA transferred to water, away from the membrane and IFABP (WPM_FA,H2O). (C) The RMSD of IFABP from the optimal structure during FA transfer.
Figure 6.
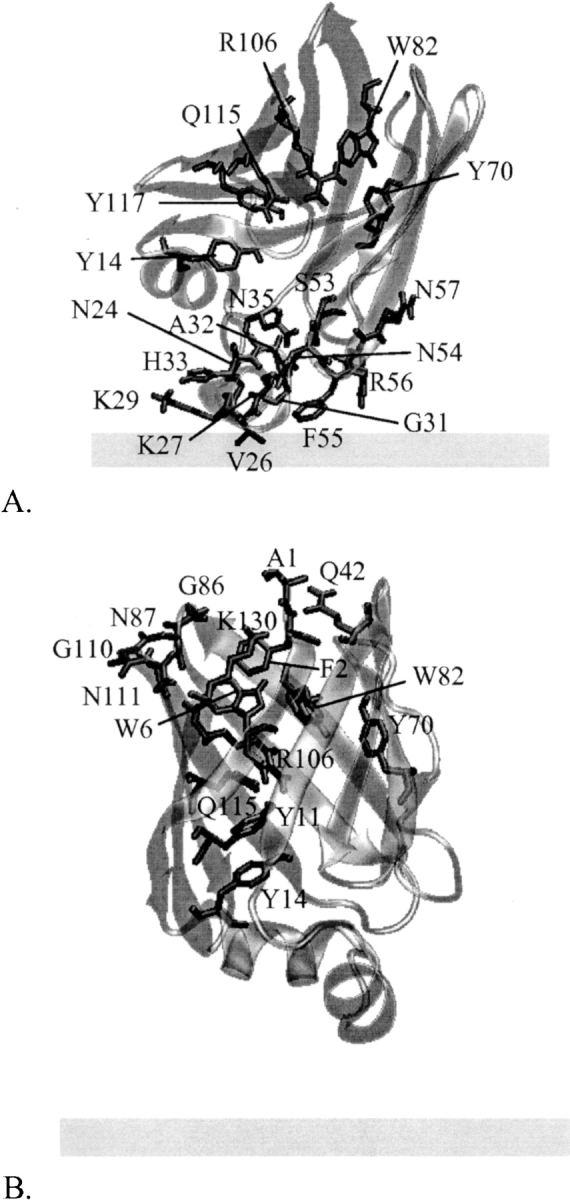
The position of residues with which the carboxyl group of palmitate makes hydrogen bonds as palmitate travels from the center of IFABP toward the helical portal (A) or alternative portal (B). The protein conformations are the energy minimized average structures calculated from MD trajectories for the first 720 ps (A) or the first 6300 ps (B). Hydrogen bonds are calculated for the same time periods.
Up to ∼220 ps, FA mostly stays in its place in the cavity, with the carboxyl group interacting with R106. At ∼280 ps the carboxyl group moves downward and starts interactions with Y117; at the same time, the FA tail senses the headgroup region of the membrane, followed by a swift detachment of the carboxyl group from the hydrogen bond/electrostatic interaction network and a deeper intercalation of the hydrocarbon tail into the membrane (at ∼290 ps). In the next ∼400 ps, the tail is buried in the membrane whereas the carboxyl group interacts with residues within the αII helix and the βC-βD turn, especially with R56. Later, palmitate withdraws from IFABP and diffuses away. In their 5-ns explicit MD simulation of the holo-IFABP in water, Bakowies and van Gunsteren (2002) also observed that, after interacting with R106, the carboxyl group of FA moves 3–4 Å downward and starts interacting with Y117. Furthermore, Richieri et al. (1999) suggested that, during the FA exit from IFABP through the helical portal region, interactions between the carboxyl group and R56 slow down the transfer, as confirmed by our simulation.
Based on kinetic measurements, transfer of palmitate from IFABP to aqueous solution involves an activation free energy of 17.2 ± 0.2 kcal/mol (Richieri et al. 1996). Similarly, Hsu and Storch (1996) reported that the activation free energy for 12-(9-anthroyloxy)stearic acid transfer from IFABP to neutral membranes is 19.3 ± 0.1 kcal/mol.
Although the simulations are not detailed enough to provide precise transition states, a rough estimate of the energy barriers involved in FA transfer can be obtained by plotting the effective energy along the trajectory. If the free energy profile is reasonably smooth (no localized high energy transition states) this method could give values comparable to the experimental activation energy. To reduce noise, we calculated the difference in effective energy of two states: one in which FA is either bound to the membrane-interacting IFABP or to the membrane and the other in which the same conformation of FA is transferred to water (keeping the conformation of IFABP the same). Thus, ΔW represents the difference in energy between FA bound to the protein or to the membrane and FA in water. This approach neglects the intraprotein energies, which, when included, make the results too noisy. ▶ shows ΔW as a function of time, calculated during the release of palmitate from IFABP. The plot indicates two energy barriers that FA has to overcome on its way from the protein cavity to the membrane via the helical portal region. The energies are given in ▶. The first energy barrier, corresponding to the detachment of the carboxyl group of FA from the center of the protein and its movement toward the portal region, accompanied by the penetration of its tail into the membrane core, is ∼12 kcal/mol. The largest opposition comes from the van der Waals energy (∼27 kcal/mol), whereas the solvation energy favors the move (∼−16 kcal/mol). The change in electrostatic energy is small, ∼1.8 kcal/mol, and its magnitude is on par with a previous estimate for the carboxyl group of oleate interactions with R106, −2.0 kcal/mol (Jakoby et al. 1993).
Table 2.
The energy barriers involved in the fatty acid transfer from IFABP to an anionic membrane
To completely detach from IFABP, FA has to surmount the second energy barrier of ∼6 kcal/mol (barrier II in ▶), with the change in van der Waals energy of ∼10 kcal/mol, electrostatic energy of ∼2 kcal/mol, and solvation energy of ∼−7 kcal/mol. Thus, it costs ∼18 kcal/mol to transfer palmitate from the membrane bound IFABP to the anionic membrane. This value is close to the activation energies determined experimentally. The unfavorable change in van der Waals energy (∼37 kcal/mol) is partially counterbalanced by favorable solvation energy (∼−23 kcal/mol) due to the presence of the membrane. The effective energy of palmitate in the membrane is ∼9 kcal/mol more favorable than that of palmitate in water.
The average distances within the βD-βE gap calculated during FA release from IFABP are included in ▶. The distances are close to those in the crystal structure and in the optimal structure. However, the distances between N57 and A73, I58 and L72, and D59 and S71 have large standard deviations that indicate increased flexibility of the region. Additionally, the N57–A73 distance is on average significantly larger than that in the crystal structure. This domain of the protein is close to the membrane and is a constituent of the helical portal region, involved in FA transfer. The increased flexibility is in agreement with the suggestion of Zanotti et al. (1994) that the lack of hydrogen bonds between βD and βE strands might serve to increase flexibility of the protein and hence exert the release of fatty acid.
The evolution of backbone and β-barrel only RMSD from the optimal structure during the FA transfer simulation implies that conformational changes take place during the transfer (see ▶). This is especially so at times at which FA moves from the center of IFABP toward the membrane (∼300 ps). At this instance, conformational changes are most obvious in the α-helical region of the protein, as illustrated in ▶. The figure shows the energy-minimized average structure from the simulation (colored in black) superimposed on the optimal structure (colored in gray). The average structures before and after the transition at ∼300 ps are shown in ▶, respectively. At later times, the structure again becomes similar to the optimal structure (▶), and then the αII helix reverts to its “deformed” position whereas the positions of βB through βF strands and involved turns slightly shift (▶).
Figure 7.
The energy-minimized average structure of IFABP from the FA-transfer-through-the-helical-portal-region MD simulation (colored in black) superimposed on the optimal structure (colored in gray). The average structure was calculated between 272 and 292 ps (A), 312 and 335 ps (B), 350 and 404 ps (C), and 450 and 456 ps (D).
FA transfer from IFABP through the putative β-strand portal region
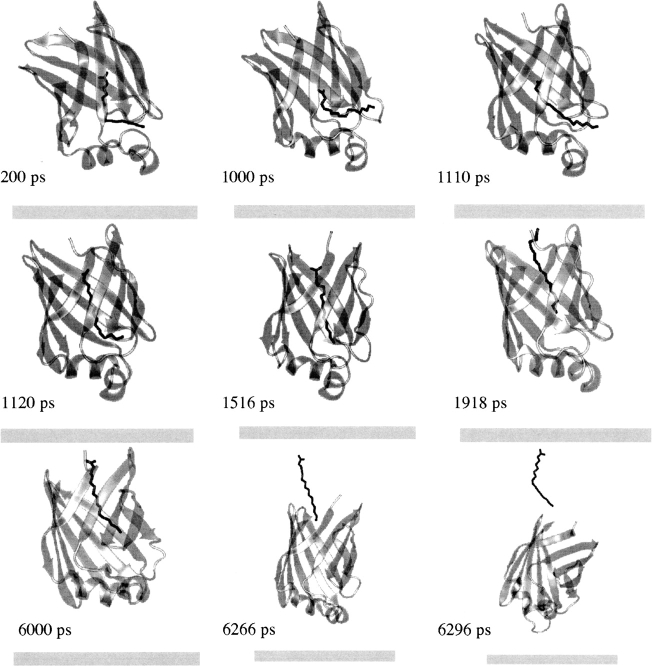
Following the equilibration of the optimal structure at T = 298°K (see above), an external force of 15 pN that acts in the z-direction was applied on the C1 atom (the carboxyl group) of palmitate. MMFP was used to prevent the center of mass of IFABP from exiting a cylinder of 41 Å radius (with the axis of the cylinder along the x-axis), which might happen as an artifact of the pulling force. During a 6-ns MD simulation the carboxyl group of FA moved from the center of IFABP (notably at ∼1120 ps) to the alternative portal, but FA did not leave the protein completely (see ▶). To force it to leave, we increased the external force to 80 pN and ran an additional 4 ns. This points toward high-energy barriers that FA has to overcome in order to be completely released from IFABP.
Figure 8.
The transfer of palmitate from the membrane bound holo-IFABP to the membrane via the alternative portal region. See the caption of ▶ for the description of the membrane.
The effective energy change involved in FA transfer from IFABP to water via the alternative portal is shown in ▶ along with the difference in the position of center of mass of IFABP and that of FA (▶). At ∼800 ps, palmitate faces an energy barrier of ∼8 kcal/mol, mostly due to the van der Waals energy (see ▶) but also the penalty for the removal of the carboxyl group from the hydrogen bond/electrostatic interaction network formed by R106, Y117, Q115, W82, and Y70 (see ▶). Afterward, FA moves toward the alternative portal region, where it stays up to ∼6000 ps. Here, the carboxyl group of FA interacts mostly with the N terminus, Q42, or points into solvent, and occasionally with residues within the βF-βG (G86, N87) and βH-βI turns (G110, N111) and K130. After increasing the external force (see above), palmitate gets out of the protein at ∼6266 ps, with its tail still dangling above the alternative portal, and leaves the protein at ∼6296 ps. As expected, this transition is accompanied by an increase in energy. To accomplish its release from IFABP through the alternative portal, palmitate has to surmount an energy barrier of ∼31 kcal/mol (see ▶), much higher than that when the release takes place through the helical portal region.
Figure 9.
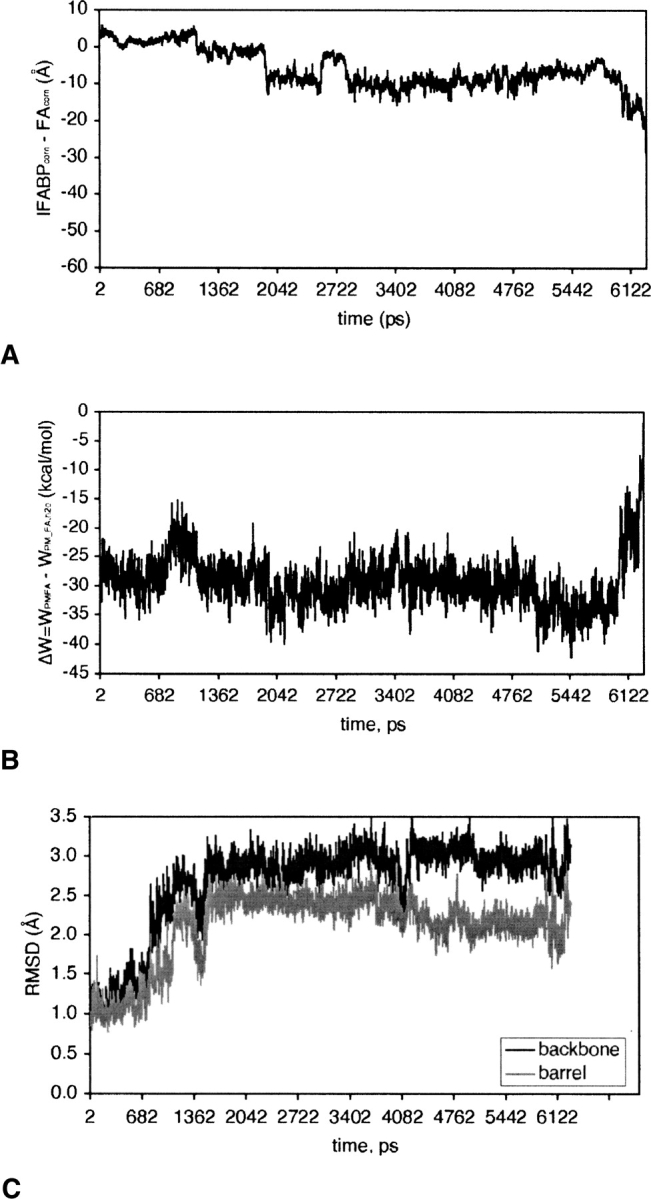
(A) The distance between the center of mass of IFABP (IFABPcom) and that of palmitate (FAcom) during FA release from holo-IFABP through the alternative portal region. (B) The change in effective energy of FA during the release (see the caption of ▶ for details). (C) The RMSD of IFABP from the optimal structure during FA transfer.
Table 3.
The energy barriers involved in the fatty acid release from IFABP via the alternative portal
Release of FA from IFABP through the alternative portal involves large conformational changes. The overall RMSD of the average distances between the Cα atoms in βD and βE strands is twice that when FA transfer takes place through the helical portal (1.8 vs. 0.9 Å). Instead of expanding, this domain now contracts (for the distances, see ▶; also see ▶). Besides, the backbone and β-barrel only RMSD from the optimal structure are higher than in the former case. As ▶ shows, their evolution in time diverges significantly from that in ▶. ▶ depicts the energy-minimized average structure of IFABP obtained during FA release via the alternative portal region superimposed on the optimal structure. To liberate FA from the center of IFABP, the β-barrel undergoes conformational changes (see the step at ∼800 ps in ▶ and compare ▶) as opposed to FA transfer via the helical portal region when the α-helical domain was almost solely affected (the sudden increase in the backbone RMSD at ∼300 ps in ▶). As can be seen in ▶, the back of the barrel (βG through βJ strands) is not significantly affected by the FA movements; however, the front of the barrel (βB through βF strands) and the helical domain are highly perturbed.
Figure 10.
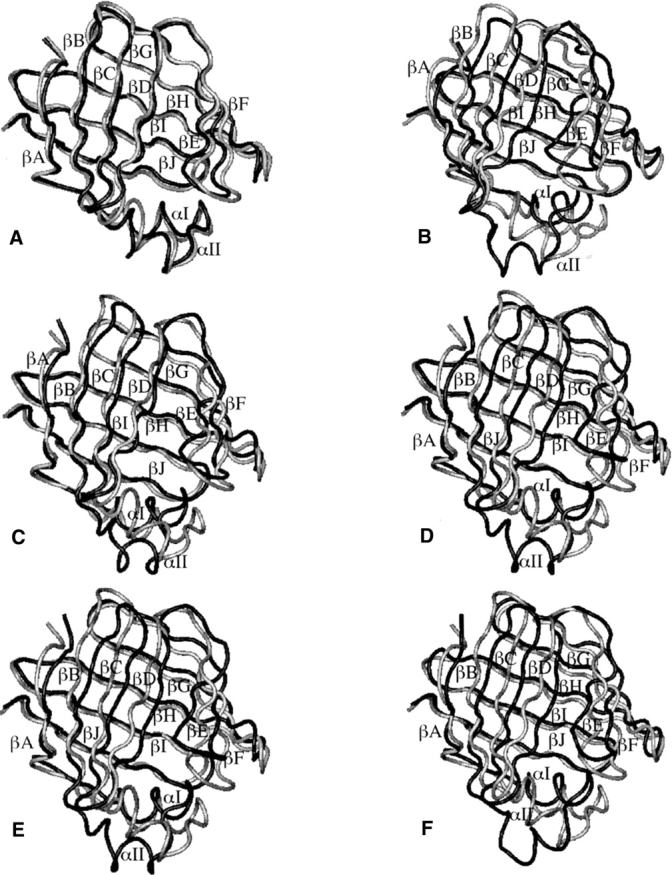
The energy-minimized average structure of IFABP from the FA-transfer-through-the-alternative-portal-region MD simulation (colored in black) superimposed on the optimal structure (colored in gray). The average structure was calculated between 2 and 300 ps (A), 1166 and 1360 ps (B), 1442 and 1486 ps (C), 1580 and 3700 ps (D), 4078 and 4116 ps (E), and 4510 and 6000 ps (F).
Discussion
Our simulations confirm that the α-helical region is essential for membrane binding of IFABP to the anionic membrane, as suggested by experiments (Córsico et al. 1998, 2004; Falomir-Lockhart et al. 2006). Binding is driven by protein–membrane electrostatic interactions mediated by positively charged residues. Under the simulation conditions, hydrophobic interactions did not contribute to binding. However, the snapshots shown in ▶ suggest that the protein might approach the membrane closer during FA transfer, bringing hydrophobic interactions into play. Indeed, during FA transfer through the portal region, the average position of the center of mass of IFABP is at z = 34.0 ± 1.3 Å, thus ∼6 Å closer to the membrane than the optimal structure (calculated between 200 and 510 ps of a MD simulation). In our simulations this is likely a result of the pulling force, but it could presumably result from spontaneous fluctuations as well. The effective binding energy of −2.9 ± 0.7 kcal/mol contains a small contribution from hydrophobic interactions (−0.6 kcal/mol). That both electrostatic and hydrophobic interactions are involved in FA transfer from IFABP to membranes is in agreement with an experimental study by Córsico et al. (2005).
The calculated difference between the effective energy of FA in water and when bound to IFABP is ΔW plm ifabp->w = W plm w − W plm ifabp ∼ 28 kcal/mol. This quantity does not include translational, rotational, and configurational entropies. The entropy loss due to the reduction of translational degrees of freedom upon binding of palmitate to IFABP is not exactly known, but, for the 1 M standard state and at T = 300°K, it can be approximated as −TΔS trans ∼2–3 kcal/mol (Murphy et al. 1994; Richieri et al. 1995; Lazaridis et al. 2002). Using a formula based on the covariance matrix of atomic positional coordinates with quantum mechanical equations to compute entropy (Schlitter 1993; Schäfer et al. 2000), Bakowies and van Gunsteren (2002) calculated that the rotational and conformational entropy loss upon transfer of palmitate from water to IFABP is −TΔS rot = 7 kcal/mol and −TΔS conf = 9 kcal/mol, at T = 300°K. The calculated rotational entropy loss seems to be rather high compared to other estimates. Considering fatty acid as a rodlike rotor and using the approach by Finkelstein and Janin (1989), Richieri et al. (1995) calculated that −TΔS rot is ∼1 kcal/mol. Lazaridis et al. (2002) computed that the rotational entropy loss upon binding of biotin to avidin or streptavidin is 2–3 kcal/mol. The calculated conformational entropy loss upon ligand binding is close to that approximated as −NRT ln Nc, ∼7 to 10 kcal/mol, where N is the number of rotatable bonds (N = 16 for palmitate) and Nc is the number of possible conformers per bond, usually between 2 and 3 (Finkelstein and Janin 1989). The translational, rotational, and conformational entropy loss upon fatty acid binding is thus between 10 and 20 kcal/mol. Using TΔS trans,rot,conf ∼15 kcal/mol, the calculated free energy change is ΔG plm ifabp->w = ΔW plm ifabp->w − TΔS trans,rot,conf ∼13 kcal/mol, which is comparable to the measured free energy of transfer of palmitate from IFABP to water, ∼11 kcal/mol (Richieri et al. 1995).
In our simulations, the effective energy of palmitate in an anionic membrane is ∼9 kcal/mol lower than in water (ΔW plm w->mem = W plm mem − W plm w ∼ −9 kcal/mol). Assuming that the translational, rotational, and conformational entropy change is negligible (Peitzsch and McLaughlin 1993), ΔG plm w->mem = −9 kcal/mol and the calculated difference in free energy upon transfer of palmitate from IFABP to the anionic membrane is ΔG plm ifabp->mem = ΔG plm ifabp->w + ΔG plm w->mem ∼4 kcal/mol. Given the experimentally determined free energy of partition of palmitate between aqueous solution and neutral membranes, ΔG plm w->mem, of ∼−10 kcal/mol (Richieri et al. 1995), the free energy of transfer of palmitate from IFABP to the neutral membrane, ΔG plm ifabp->mem, is ∼1 kcal/mol.
It appears that both portals can accommodate the release of palmitate. However, the position of a portal relative to the membrane has an important role in the energetics of FA release. In our computed optimal orientation of IFABP, the helical portal is located just above the membrane surface whereas the putative β-strand portal is on the opposite side, exposed to solvent. The calculated free energies show that direct FA transfer from the protein to the membrane has a lower energy penalty than FA transfer via the alternative portal. The energy cost of the latter can be somewhat reduced by altering the properties of FA that influence its aqueous solubility, such as the degree of unsaturation (Richieri et al. 1994). Nevertheless, FA release through the alternative portal involves more severe conformational changes in the protein than release through the helical portal. Taking the results together, we conclude that the helical portal is a more likely FA exit site than the alternative portal. Thus, our work corroborates the helical portal hypothesis (Zanotti et al. 1994; Córsico et al. 1998; Richieri et al. 1999; Likic and Prendergast 2001; Bakowies and van Gunsteren 2002; Falomir-Lockhart et al. 2006).
Materials and Methods
Implicit membrane model
Molecular dynamics simulations were carried out using the program CHARMM (Brooks et al. 1983). The effective energy of a solute is calculated using an implicit model, IMM1-GC (Lazaridis 2005) on an anionic membrane or EEF1 (Lazaridis and Karplus 1999) in water. The effective energy equals the sum of the intramolecular energy of the solute (Neria et al. 1996), the implicit solvation free energy accounting for interactions of each atom with solvent, and, in the case of anionic membranes, the lipid headgroup-solute electrostatic interaction energy, obtained from the Gouy–Chapman theory for the electrical double layer (McLaughlin 1989).
Simulation protocols
In IMM1-GC, the membrane is taken to be parallel to the xy-plane, with its center located at z = 0. The hydrocarbon core of the membrane was 26 Å wide, with area 70 Å2 per lipid. The hydrophobic/hydrophilic interface is thus at z = ±13 Å and the plane of smeared charge (i.e., the plane of the phosphates) is at z = ±16 Å. The valence of lipids was 1. The anionic membrane consisted of 25 mol% of anionic lipids. The ionic strength was 0.1 M. All simulations were performed at 298°K. All energy minimizations were done using the adopted basis Newton–Raphson algorithm (ABNR) for 300 steps. The numerical integration of the equations of motion was carried out using the Verlet integrator with a time step of 2 fs. All bonds involving hydrogen atoms were fixed using SHAKE constraints. The N, H, Cα, C, and O atoms were considered as the backbone atoms. The RMSD values of the β-barrel only are calculated for the backbone atoms from βB through βJ strand (residues 37–131). Gap RMSD refers to the RMSD of distances between the Cα atoms in βD and βE strands in a MD structure from those in the crystal structure. The distances are calculated for the following pairs: N57–A73, I58–L72, D59–S71, V60–Y70, V61–A69, F62–F68, and E63–D67.
Initial structures
The crystal structures corresponding to the apo- and holo-forms of rat IFABP were obtained from the Protein Data Bank, entries 1IFC (Scapin et al. 1992) and 2IFB (Sacchettini et al. 1989), respectively. The holo-IFABP is complexed with palmitate. The N terminus was protonated and the C terminus was deprotonated. All acidic residues were also deprotonated, as well as the carboxyl group of palmitate, corresponding to pH ∼7. The initial structure for the FA transfer simulations was the MD structure of the holo-IFABP in optimal orientation relative to the membrane, described below and shown in ▶.
Simulations in water
The crystal structure was energy minimized before a 400-ps equilibration. The first 200 ps were run with harmonic constraints placed on the backbone atoms (the initial force of 0.1 was gradually released in decrements of 0.02), followed by an unconstrained 200-ps simulation. After equilibration, the protein was subjected to a 1.6-ns MD simulation, during which the coordinates were saved every 2 ps. The simulation was repeated using three additional sets of random numbers to initialize velocities.
Determination of the optimal orientation
Six simulations were run starting from the crystal structure at six arbitrary orientations: four obtained by rotating the protein 90° around the x-axis and two obtained by rotating the protein 90° around the y-axis. The protein was placed on the membrane surface (its center of mass at 30 Å, i.e., 14 Å above the plane of the phosphates) and its energy was minimized. During the first 200 ps of a 400-ps equilibration the miscellaneous mean field potential (MMFP) was used to prevent the center of mass of the protein from exiting a cylinder of 40.0 Å radius (with the axis of the cylinder along the x-axis), with harmonic constraints applied on the backbone atoms (the initial force of 0.1 was gradually released in decrements of 0.02); the last 200 ps of equilibration was run without constraints. The equilibration was followed by a 1.6-ns MD simulation. The six simulations were repeated using three different random numbers. The energy of the last structure after 2 ns was minimized and compared with the energies of the structures obtained from the other simulations.
Acknowledgments
We thank Dr. Ruth Stark and Dr. Judith Storch for fruitful discussions. This work was supported by the National Science Foundation (MCB-0615552) and a CUNY Collaborative Incentive Grant. Infrastructure support was provided in part by an RCMI grant RR03060 from NIH.
Footnotes
Reprint requests to: Themis Lazaridis, Department of Chemistry, City College of New York/CUNY, 138th Street and Convent Avenue, New York, NY 10031, USA; e-mail: tlazaridis@ccny.cuny.edu; fax: (212) 650-6107.
Article published online ahead of print. Article and publication date are at http://www.proteinscience.org/cgi/doi/10.1110/ps.072875307.
References
- Bakowies D. and van Gunsteren, W.F. 2002. Simulations of apo and holo-fatty acid binding protein: Structure and dynamics of protein, ligand and internal water. J. Mol. Biol. 315 713–736. [DOI] [PubMed] [Google Scholar]
- Balendiran G.K., Schnütgen, F., Scapin, G., Börchers, T., Xhong, N., Lim, K., Godbout, R., Spener, F., and Sacchettini, J.C. 2000. Crystal structure and thermodynamic analysis of human brain fatty acid-binding protein. J. Biol. Chem. 275 27045–27054. [DOI] [PubMed] [Google Scholar]
- Brooks B.R., Bruccoleri, R.E., Olafson, B.D., States, D.J., Swaminathan, S., and Karplus, M. 1983. Charmm—A program for macromolecular energy, minimization, and dynamics calculations. J. Comput. Chem. 4 187–217. [Google Scholar]
- Cistola D.P., Kim, K., Rogl, H., and Frieden, C. 1996. Fatty acid interactions with a helix-less variant of intestinal fatty acid-binding protein. Biochemistry 35 7559–7565. [DOI] [PubMed] [Google Scholar]
- Córsico B., Cistola, D.P., Frieden, C., and Storch, J. 1998. The helical domain of intestinal fatty acid binding protein is critical for collisional transfer of fatty acids to phospholipid membranes. Proc. Natl. Acad. Sci. 95 12174–12178. [DOI] [PMC free article] [PubMed] [Google Scholar]
- Córsico B., Liou, H.L., and Storch, J. 2004. The α-helical domain of liver fatty acid binding protein is responsible for the diffusion-mediated transfer of fatty acids to phospholipid membranes. Biochemistry 43 3600–3607. [DOI] [PubMed] [Google Scholar]
- Córsico B., Franchini, G.R., Hsu, K.-T., and Storch, J. 2005. Fatty acid transfer from intestinal fatty acid binding protein to membranes: Electrostatic and hydrophobic interactions. J. Lipid Res. 46 1765–1772. [DOI] [PubMed] [Google Scholar]
- Cowan S.W., Newcomer, M.E., and Jones, T.A. 1993. Crystallographic studies on a family of cellular lipophilic transport proteins. Refinement of P2 myelin protein and the structure determination and refinement of cellular retinol-binding protein in complex with all-trans-retinol. J. Mol. Biol. 230 1225–1246. [DOI] [PubMed] [Google Scholar]
- Falomir-Lockhart L.J., Laborde, L., Kahn, P.C., Storch, J., and Córsico, B. 2006. Protein-membrane interaction and fatty acid transfer from intestinal fatty acid-binding protein to membranes. Support for a multistep process. J. Biol. Chem. 281 13979–13989. [DOI] [PubMed] [Google Scholar]
- Finkelstein A.V. and Janin, J. 1989. The price of lost freedom: Entropy of bimolecular complex formation. Protein Eng. 3 1–3. [DOI] [PubMed] [Google Scholar]
- Friedman R., Nachliel, E., and Gutman, M. 2006. Fatty acid binding proteins: Same structure but different binding mechanisms? Molecular dynamics simulations of intestinal fatty acid binding protein. Biophys. J. 90 1535–1545. [DOI] [PMC free article] [PubMed] [Google Scholar]
- Gericke A., Smith, E.R., Moore, D.J., Mendelsohn, R., and Storch, J. 1997. Adipocyte fatty acid-binding protein: Interaction with phospholipid membranes and thermal stability studied by FTIR spectroscopy. Biochemistry 36 8311–8317. [DOI] [PubMed] [Google Scholar]
- Glatz J.F. and van der Vusse, G.J. 1996. Cellular fatty acid-binding proteins: Their function and physiological significance. Prog. Lipid Res. 35 243–282. [DOI] [PubMed] [Google Scholar]
- Hagan R.M., Davies, J.K., and Wilton, D.C. 2002. The effect of charge reversal mutations in the α-helical region of liver fatty acid binding protein on the binding of fatty-acyl CoAs, lysophospholipids and bile acids. Mol. Cell. Biochem. 239 55–60. [PubMed] [Google Scholar]
- Herr F.M., Matarese, V., Bernlohr, D.A., and Storch, J. 1995. Surface lysine residues modulate the collisional transfer of fatty acid from adipocyte fatty acid binding protein to membranes. Biochemistry 34 11840–11845. [DOI] [PubMed] [Google Scholar]
- Herr F.M., Aronson, J., and Storch, J. 1996. Role of portal region lysine residues in electrostatic interactions between heart fatty acid binding protein and phospholipid membranes. Biochemistry 35 1296–1303. [DOI] [PubMed] [Google Scholar]
- Hodsdon M.E. and Cistola, D.P. 1997a. Discrete backbone disorder in the nuclear magnetic resonance structure of apo intestinal fatty acid-binding protein: Implications for the mechanism of ligand entry. Biochemistry 36 1450–1460. [DOI] [PubMed] [Google Scholar]
- Hodsdon M.E. and Cistola, D.P. 1997b. Ligand binding alters the backbone mobility of intestinal fatty acid-binding protein as monitored by 15N NMR relaxation and 1H exchange. Biochemistry 36 2278–2290. [DOI] [PubMed] [Google Scholar]
- Hohoff C., Börchers, T.B.R., Spener, F., and van Tilbeurgh, H. 1999. Expression, purification, and crystal structure determination of recombinant human epidermal-type fatty acid binding protein. Biochemistry 38 12229–12239. [DOI] [PubMed] [Google Scholar]
- Hsu K.-T. and Storch, J. 1996. Fatty acid transfer from liver and intestinal fatty acid-binding proteins to membranes occurs by different mechanisms. J. Biol. Chem. 271 13317–13323. [DOI] [PubMed] [Google Scholar]
- Jakoby M.G., Miller, K.R., Toner, J.J., Bauman, A., Cheng, L., Li, E., and Cistola, D.P. 1993. Ligand–protein electrostatic interactions govern the specificity of retinol- and fatty acid-binding proteins. Biochemistry 32 872–878. [DOI] [PubMed] [Google Scholar]
- Jenkins A.E., Hockenberry, J.A., Nguyen, T., and Bernlohr, D.A. 2002. Testing of the portal hypothesis: Analysis of a V32G, F57G, K58G mutant of the fatty acid binding protein of the murine adipocyte. Biochemistry 41 2022–2027. [DOI] [PubMed] [Google Scholar]
- Lassen D., Lucke, C., Kveder, M., Mesgarzadeh, A., Schmidt, J.M., Specht, B., Lezius, A., Spener, F., and Ruterjans, H. 1995. Three-dimensional structure of bovine heart fatty-acid-binding protein with bound palmitic acid, determined by multidimensional NMR spectroscopy. Eur. J. Biochem. 230 266–280. [DOI] [PubMed] [Google Scholar]
- Lazaridis T. 2003. Effective energy function for proteins in lipid membranes. Proteins 52 176–192. [DOI] [PubMed] [Google Scholar]
- Lazaridis T. 2005. Implicit solvent simulations of peptide interactions with anionic lipid membranes. Proteins 58 518–527. [DOI] [PubMed] [Google Scholar]
- Lazaridis T. and Karplus, M. 1999. Effective energy function for proteins in solution. Proteins 35 133–152. [DOI] [PubMed] [Google Scholar]
- Lazaridis T., Masunov, A., and Gandolfo, F. 2002. Contributions to the binding free energy of ligands to avidin and streptavidin. Proteins 47 194–208. [DOI] [PubMed] [Google Scholar]
- Likic V.A. and Prendergast, F.G. 2001. Dynamics of internal water in fatty acid binding protein: Computer simulations and comparison with experiments. Proteins 43 65–72. [DOI] [PubMed] [Google Scholar]
- Liou H.-L. and Storch, J. 2001. Role of surface lysine residues of adipocyte fatty acid-binding protein in fatty acid transfer to phospholipid vesicles. Biochemistry 40 6475–6485. [DOI] [PubMed] [Google Scholar]
- Liou H.-L., Kahn, P.C., and Storch, J. 2002. Role of the helical domain in fatty acid transfer from adipocyte and heart fatty acid-binding proteins to membranes. Analysis of chimeric proteins. J. Biol. Chem. 277 1806–1815. [DOI] [PubMed] [Google Scholar]
- Lücke C., Zhang, F., Rüterjans, H., Hamilton, J.A., and Sacchettini, J.C. 1996. Flexibility is a likely determinant of binding specificity in the case of ileal lipid binding protein. Structure 4 785–800. [DOI] [PubMed] [Google Scholar]
- Massolini G. and Calleri, E. 2003. Survey of binding properties of fatty acid-binding proteins. Chromatographic methods. J. Chromatogr. B Analyt. Technol. Biomed. Life Sci. 797 255–268. [DOI] [PubMed] [Google Scholar]
- McLaughlin S. 1989. The electrostatic properties of membranes. Annu. Rev. Biophys. Biophys. Chem. 18 113–136. [DOI] [PubMed] [Google Scholar]
- Mihajlovic M. and Lazaridis, T. 2006. Calculations of pH-dependent binding of proteins to biological membranes. J. Phys. Chem. B 110 3375–3384. [DOI] [PubMed] [Google Scholar]
- Murphy K.P., Xie, D., Thompson, K.S., Amzel, L.M., and Freire, E. 1994. Entropy in biological binding processes: Estimation of translational entropy loss. Proteins 18 63–67. [DOI] [PubMed] [Google Scholar]
- Neria E., Fischer, S., and Karplus, M. 1996. Simulation of activation free energies in molecular systems. J. Chem. Phys. 105 1902–1921. [Google Scholar]
- Ory J., Kane, C.D., Simpson, M.A., Banaszak, L.J., and Bernlohr, D.A. 1997. Biochemical and crystallographic analyses of a portal mutant of the adipocyte lipid-binding protein. J. Biol. Chem. 272 9793–9801. [DOI] [PubMed] [Google Scholar]
- Peitzsch R.M. and McLaughlin, S. 1993. Binding of acylated peptides and fatty acids to phospholipid vesicles: Pertinence to myristoylated proteins. Biochemistry 32 10436–10443. [DOI] [PubMed] [Google Scholar]
- Rich M.R. and Evans, J.S. 1996. Molecular dynamics simulations of adipocyte lipid-binding protein: Effect of electrostatics and acyl chain unsaturation. Biochemistry 35 1506–1515. [DOI] [PubMed] [Google Scholar]
- Richieri G.V., Ogata, R.T., and Kleinfeld, A.M. 1994. Equilibrium constants for the binding of fatty acids with fatty acid-binding proteins from adipocyte, intestine, heart, and liver measured with the fluorescent probe AlXFAB. J. Biol. Chem. 269 23918–23930. [PubMed] [Google Scholar]
- Richieri G.V., Ogata, R.T., and Kleinfeld, A.M. 1995. Thermodynamics of fatty acid binding to fatty acid-binding proteins and fatty acid partition between water and membranes measured using the fluorescent probe ADIFAB. J. Biol. Chem. 270 15076–15084. [DOI] [PubMed] [Google Scholar]
- Richieri G.V., Ogata, R.T., and Kleinfeld, A.M. 1996. Kinetics of fatty acid interactions with fatty acid binding proteins from adipocyte, heart, and intestine. J. Biol. Chem. 271 11291–11300. [DOI] [PubMed] [Google Scholar]
- Richieri G.V., Low, P.J., Ogata, R.T., and Kleinfeld, A.M. 1999. Binding kinetics of engineered mutants provide insight about the pathway for entering and exiting the intestinal fatty acid binding protein. Biochemistry 38 5888–5895. [DOI] [PubMed] [Google Scholar]
- Sacchettini J.C., Gordon, J.I., and Banaszak, L.J. 1989. Crystal structure of rat intestinal fatty-acid-binding protein. Refinement and analysis of the Escherichia coli-derived protein with bound palmitate. J. Mol. Biol. 208 327–339. [DOI] [PubMed] [Google Scholar]
- Scapin G., Gordon, J.I., and Sacchettini, J.C. 1992. Refinement of the structure of recombinant rat intestinal fatty acid-binding apoprotein at 1.2-A resolution. J. Biol. Chem. 267 4253–4269. [DOI] [PubMed] [Google Scholar]
- Schäfer H., Mark, A.E., and van Gunsteren, W.F. 2000. Absolute entropies from molecular dynamics simulation trajectories. J. Chem. Phys. 113 7809–7817. [Google Scholar]
- Schlitter J. 1993. Estimation of absolute and relative entropies of macromolecules using the covariance matrix. Chem. Phys. Lett. 215 617–621. [Google Scholar]
- Storch J. and Thumser, A.E.A. 2000. The fatty acid transport function of fatty acid-binding proteins. Biochim. Biophys. Acta 1486 28–44. [DOI] [PubMed] [Google Scholar]
- Storch J., Veerkamp, J.H., and Hsu, K.-T. 2002. Similar mechanisms of fatty acid transfer from human anal rodent fatty acid-binding proteins to membranes: Liver, intestine, heart muscle, and adipose tissue FABPs. Mol. Cell. Biochem. 239 25–33. [PubMed] [Google Scholar]
- Storch J., Herr, F.M., Hsu, K.T., Kim, H.K., Liou, H.L., and Smith, E.R. 1996. The role of membranes and intracellular binding proteins in cytoplasmic transport of hydrophobic molecules: Fatty acid-binding proteins. Comp. Biochem. Physiol. 115B 333–339. [Google Scholar]
- Thompson J.J.O., Reese-Wagoner, A., and Banaszak, L. 1999a. The liver fatty acid binding protein—Comparison of cavity properties of intracellular lipid-binding proteins. Mol. Cell. Biochem. 192 9–16. [PubMed] [Google Scholar]
- Thompson J., Reese-Wagoner, A., and Banaszak, L. 1999b. Liver fatty acid binding protein: Species variation and the accommodation of different ligands. Biochim. Biophys. Acta 1441 117–130. [DOI] [PubMed] [Google Scholar]
- Thompson J., Winter, N., Terwey, D.J.B., and Banaszak, L. 1997. The crystal structure of the liver fatty acid-binding protein. A complex with two bound oleates. J. Biol. Chem. 272 7140–7150. [DOI] [PubMed] [Google Scholar]
- van Bilsen M., van der Vusse, G.J., Gilde, A.J., Lindhout, M., and van der Lee, K.A.J.M. 2002. Peroxisome proliferator-activated receptors: Lipid binding proteins controling gene expression. Mol. Cell. Biochem. 239 131–138. [PubMed] [Google Scholar]
- Wolfrum C., Borrmann, C.M., Börchers, T., and Spener, F. 2001. Fatty acids and hypolipidemic drugs regulate peroxisome proliferator-activated receptors α- and γ-mediated gene expression via liver fatty acid binding protein: A signaling path to the nucleus. Proc. Natl. Acad. Sci. 98 2323–2328. [DOI] [PMC free article] [PubMed] [Google Scholar]
- Xu Z., Bernlohr, D.A., and Banaszak, L.J. 1992. Crystal structure of recombinant murine adipocyte lipid-binding protein. Biochemistry 31 3484–3492. [DOI] [PubMed] [Google Scholar]
- Zanotti G., Feltre, L., and Spadon, P. 1994. A possible route for the release of fatty acid from fatty acid-binding protein. Biochem. J. 301 459–463. [DOI] [PMC free article] [PubMed] [Google Scholar]
- Zimmerman A.W. and Veerkamp, J.H. 2002. New insights into the structure and function of fatty acid-binding proteins. Cell. Mol. Life Sci. 59 1096–1116. [DOI] [PMC free article] [PubMed] [Google Scholar]
- Zimmerman A.W., Van Moerkerk, H.T.B., and Veerkamp, J.H. 2001. Ligand specificity and conformational stability of human fatty acid-binding proteins. Int. J. Biochem. Cell Biol. 33 865–876. [DOI] [PubMed] [Google Scholar]


