

Abstract
Purpose
Lymph node status is a strong predictor of outcome for lung cancer patients. Recently, several reports have hinted that gene expression profiles of primary tumor may be able to predict node status. The goals of this study were to determine if microarray data could be used to accurately classify patients with regard to pathologic lymph node status, and to determine if this analysis could identify patients at risk for occult disease and worse survival.
Experimental Design
Two previously published lung adenocarcinoma microarray data sets were reanalyzed. Patients were separated into two groups based on pathologic lymph node positive (pN+) or negative (pN0) status, and prediction analysis of microarray (PAM) was used for training and validation to classify nodal status. Overall survival analysis was performed based on PAM classifications.
Results
In the training phase, a 318-gene set gave classification accuracy of 88.4% when compared with pathology. Survival was significantly worse in PAM-positive compared with PAM-negative patients overall (P < 0.0001) and also when confined to pN0 patients only (P = 0.0037). In the validation set, classification accuracy was again 94.1% in the pN+ patients but only 21.2% in the pN0 patients. However, among the pN0 patients, recurrence rates and overall survival were significantly worse in the PAM-positive compared with PAM-negative patients (P = 0.0258 and 0.0507).
Conclusions
Analysis of gene expression profiles from primary tumor may predict lymph node status but frequently misclassifies pN0 patients as node positive. Recurrence rates and overall survival are worse in these “misclassified” patients, implying that they may in fact have occult disease spread.
Non–small cell lung cancer is the leading cause of cancer death in the United States and overall 5-year survival is ∼14% (1). Even in stage I (lymph node negative) patients, recurrence rates range from 25% to 50% and result in poor (50-70%) 5-year survival in this group (2). Current staging methods are unable to identify those patients who will ultimately have poor outcome, and we are therefore in need of a clinically useful approach to better stratify patients with respect to the risk of recurrence and survival. One much studied approach is to enhance the detection of tumor spread to lymph nodes using either immunohistochemistry for tumor cells or molecular detection of cancer-related RNA. A review of this literature indicates that occult lymph node metastases (micro-metastases) are indeed clinically relevant in non–small cell lung cancer and confer worse prognosis (3). Recently, however, Beer et al. reported that microarray analysis of gene expression in lung adenocarcinomas can also predict outcome in stage I patients (4). In this study, survival of the low-risk stage I patients was almost 90%, whereas in the high-risk group, survival was similar to that expected for pathologic N1 (pN1) lung cancer patients (42%; ref. 5). Also interesting was the fact that the stage III patients did not show a significant survival difference between the high-risk and low-risk groups. Whereas this may be attributable to the small sample size, an alternative hypothesis is that the microarray data identifies patients at high risk for occult lymph node disease in the stage I group and that this is irrelevant in the stage III patients who already have overtly positive lymph nodes. Although this hypothesis is very tenuous based solely on the data from Beer et al., two recent articles lend some support (6, 7). In the first article by Ramaswamy et al., the authors analyzed gene expression in primary adenocarcinoma samples and compared this with gene expression in metastatic tumors derived from unmatched primary adenocarcinomas. Using this data, a 128-gene signature was identified that distinguished reasonably well between primary tumors and metastases. When applied to 62 lung adenocarcinomas, the authors found that survival was significantly worse in patients whose tumors bore the metastasis-associated gene expression signature (P = 0.009). The authors, however, did not report on correlation of the microarray data with pathologic nodal status in these 62 patients. From their data, Ramaswamy et al. concluded that some primary tumors are preconfigured to metastasize, and that this propensity is detectable at the time of initial diagnosis. In the second study, Huang et al. analyzed breast cancer samples and identified separate gene sets that seem to predict lymph node metastasis and overall patient outcome. Specifically relating to lymph node status, the authors identified a “metagene” signature that predicted pathologic nodal involvement with ∼90% accuracy. From these articles, it seems that while metastatic potential and patient outcome are clearly interrelated events, they may be the result of distinct biological processes, the signatures for which can be identified by analysis of the primary tumor.
The goals of this study were to reanalyze publicly available gene expression data from lung adenocarcinoma samples and identify gene expression patterns that correlated with lymph node metastases. These gene expression patterns were then applied to pathologically node-negative patients to determine if the primary tumor microarray data could identify patients at risk for occult disease and worse survival.
Materials and Methods
Microarray data
Analysis was done on two independent, publicly available lung adenocarcinoma microarray data sets. Data set 1 was previously published by Beer et al. (4) from the University of Michigan, and both gene expression data and patient outcome information were downloaded from the web site http://dot.ped.med.umich.edu:2000/ourimage/pub/Lung/index.html. This data set was originally obtained using Affymetrix HuFL arrays and included a total of 86 adenocarcinomas consisting of 69 pN0 and 17 pN+ (either pN1 or pN2) patients. The second data set was that previously published by Bhattacharjee et al. (8) from Harvard University, and was used as a test data set in Beer's study. The Harvard data was downloaded from the web site http://dot.ped.med.umich.edu:2000/ourimage/pub/Lung/index.html. This set consisted of data from 84 lung adenocarcinoma samples and was obtained using Affymetrix HG-U95A arrays. Of the 84 patients in this data set, 52 were pN0, 17 were pN+, and the remaining 15 were listed as having unknown lymph node status. These patients were excluded from our analysis, leaving 69 patients with definitive lymph node staging by pathology.
Data compilation and preanalysis
There were 7,129 Affymetrix probe sets (genes) in the first data set and 12,625 probe sets in the second set. Data for NULL gene name (EST) were excluded and a total of 5,377 genes were subsequently identified as being common to both data sets (Supplementary data). Expression values for the same gene from multiple probe sets were average of values generated from all probe sets. To assess data quality and to identify any differences between data sets or between pN0 and pN+ patients, a variety of data visualization and data quality measurements were employed. These included data quality graphs (mean versus variance; multiplicative-additive plots; correlograms) and measures (confounding index; among-array coefficient of variation; mean group correlations). All methods were done using the University of Pittsburgh Cancer Institute web application for microarray analysis (caGEDA; cancer gene expression data analyzer), located at http://bioinformatics.upmc.edu/GE2/GEDA.html (9).
Data analysis and prediction of lymph node status
Prediction of lymph node status was done in a training set (Michigan data) and test set (Harvard data) approach using prediction analysis of microarray (PAM) software available free from the url http://www-stat.stanford.edu/~tibs/PAM. This software uses a variation of shrunken-centroid classification with an automated gene selection step integrated into the algorithm. During 10-fold cross-validation, a shrinkage factor Δ is varied in search of optimal classifier performance. The value that returns the lowest classification error with the fewest genes is favored as optimal. The variable Δ is a soft-thresholding variable that is reported to usually produce more reliable estimates of the true means (10). The Δ value obtained from training on the entire data set from the Michigan study was subsequently used for predicting the lymph node status of each sample in the Harvard data set. Survival comparisons between the predicted classes were done using Kaplan-Meier survival estimates and the log-rank test for determining survival differences.
Results
Evaluation of data set quality and compatibility
To evaluate the quality of the expression data from the 5,377 overlapping genes, confounding index (see footnote to Table 1), among-array coefficient of variation, and mean group correlation coefficients were calculated for each data set using caGEDA (Table 1). This analysis indicated overall high data quality, and no further normalization was done. To determine comparability of data from pN0 and pN+ patients, box-whisker plots were generated. No apparent difference in the mean or distribution of total expression of the 5,377 genes was identified between pN+ and pN0 groups within each data set (Fig. 1A and B). However, box-whisker plots indicated large differences in the global expression distributions between the two data sets (Fig. 1C). Rather than attempting to combine the two data sets by performing additional normalization, we instead treated the two data sets independently using one as a training set and the other as a validation or test set.
Table 1.
Data quality measurement between pN0 and pN+ groups in both data sets
| Measurement | Michigan data set | Harvard data set |
|---|---|---|
| Confounding index* | 1.007 | 0.997 |
| Among-array coefficient of variation | 0.034 | 0.028 |
| Mean group correlation (r2) | 0.984 | 0.994 |
A confounding index for global expression compares the average within-group correlation with the average between-group correlation. It should be as close to 1.0 as possible. Values higher than 1.0 may indicate incidental confounding factors in the experimental design. For equation and more details, see ref. 9.
Fig. 1.
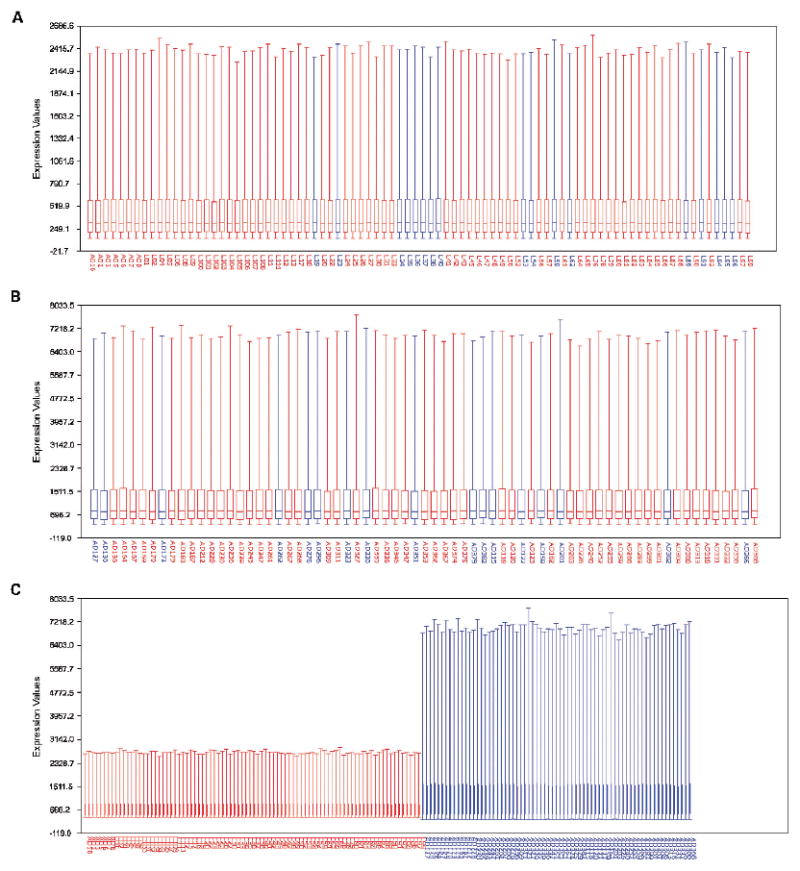
Box-and-whisker plots with sample names on the X axis and expression values on the Y axis. A, data from pN+ (
 ) and pN0 (
 ) groups in Michigan data set. B, data from pN+ and pN0 groups in Harvard data set. C, data from both data sets plotted together;
, Harvard;
, Michigan.
) groups in Michigan data set. B, data from pN+ and pN0 groups in Harvard data set. C, data from both data sets plotted together;
, Harvard;
, Michigan.
Prediction of lymph node status in the training set
Analysis of the training data set using PAM identified a group of 318 genes that appeared to correlate with pathologic lymph node status (all 318 genes are listed in Supplementary data). The top 50 of these genes are listed in Table 2. Because the output from the PAM software is in the form of continuous probability values, comparison with pathology was facilitated by transforming the PAM output into binary data (lymph node positive or negative) using P = 0.5 as the cutoff. When compared with pathologic nodal status, lymph node classification by PAM was correct in 76 of 86 (88.4%) cases overall. PAM correctly classified 16 of 17 (94.1%) pN+ samples and 60 of 69 (87.0%) pN0 samples in this set. Furthermore, on individual samples, the classification probability reported from PAM was 100% for 73 samples, 80% to 99% for 11 samples, and 50% to 80% for only 2 samples (Fig. 2A).
Table 2.
Top 50 genes associated with nodal metastases from PAM classification
| Rank in PAM output | Gene symbol | Gene name | Function |
|---|---|---|---|
| Overexpressed genes | |||
| 1 | COL5A2 | collagen, typeV, α2 | Extracellular matrix |
| 4 | COL1A1 | collagen, type I, α1 | |
| 9 | COL3A1 | collagen, type III, α1 | |
| 14 | COL1A2 | collagen, type I, α2 | |
| 18 | TGFBI | transforming growth factor β induced, 68 kDa | |
| 19 | OSF-2 | periostin, osteoblast-specific factor | |
| 10 | LGALS1 | lectin, galactoside binding, soluble, 1 | Cytoskeletal/cell adhesion |
| 22 | SPARC | SPARC-like 1 | |
| 27 | CSPG2 | chondroitin sulfate proteoglycan 2 | |
| 37 | VIM | vimentin | |
| 38 | TAGLN | transgelin | |
| 45 | KRT15 | keratin 15 | |
| 46 | FN1 | fibronectin1 | |
| 5 | RPLP1 | ribosomal protein, large, P1 | Protein synthesis/degradation |
| 6 | RPS23 | ribosomal protein S23 | |
| 23 | RPL37 | ribosomal protein L37 | |
| 29 | RPS26 | ribosomal protein S26 | |
| 20 | CSTB | cystatin B | |
| 33 | CTSL | cathepsin L | |
| 13 | S100A10 | S100 calcium binding protein A10 | Calcium |
| 17 | S100A11 | S100 calcium binding protein A11 | |
| 35 | S100A4 | S100 calcium binding protein A4 | |
| 39 | S100A2 | S100 calcium binding protein A2 | |
| 15 | HSPA8 | heat shock 70 kDa protein 8 | Chaperones |
| 28 | CEBPB | CCAAT/enhancer binding protein, β | Transcription/translation |
| 43 | SUI1 | putative translation initiation factor | |
| 3 | GAPD | glyceraldehyde-3-phosphate dehydrogenase | Enzymes, cellular metabolism |
| 11 | GPI | glucose phosphate isomerase | |
| 25 | PGK1 | phosphoglycerate kinase 1 | |
| 26 | TPI1 | triosephosphate isomerase 1 | |
| 36 | LDHB | lactate dehydrogenase B | |
| 7 | H2AFZ | H2A histone family, member Z | Other |
| 34 | HNRPA2B1 | heterogeneous nuclear ribonucleoprotein A2/B1 | |
| 42 | PLP2 | proteolipid protein 2 | |
| 49 | RAB31 | RAB31, member RAS oncogene family | |
| Underexpressed genes | |||
| 2 | HLA-B | MHC, class I, B | Other |
| 8 | OAZ1 | ornithine decarboxylase antizyme 1 | |
| 12 | JUND | jun D proto-oncogene | |
| 16 | USP11 | ubiquitin specific protease 11 | |
| 21 | KIAA0220 | KIAA0220-like protein | |
| 24 | RPS8 | ribosomal protein S8 | |
| 30 | PTGDS | prostaglandin D2 synthase 21kDa | |
| 31 | CST3 | cystatin C | |
| 32 | MGP | matrix Gla protein | |
| 40 | SLU7 | step II splicing factor SLU7 | |
| 41 | CIRBP | cold inducible RNA binding protein | |
| 44 | ARHA | ras homolog gene family, member A | |
| 47 | HU-K5 | monoglyceride lipase | |
| 48 | CAP | adenylate cyclase – associated protein 1 | |
| 50 | SFTPD | surfactant, pulmonary-associated protein D |
Fig. 2.

Classification probability by PAM with 10-fold cross-validation for training set (A) and for test set (B). Original sample names and pathologic lymph node status are labeled on the top of each graph. PAM-classified nodal status is indicated by ◆, (pN0);
 , (pN+) with the Y axis indicating the probability associated with the classification of each patient.
Prediction of lymph node status in the validation set
The 318-gene classification algorithm generated on the training set was next applied to the data from Harvard as a validation test. In this data set, the classification accuracy for PAM in pN+ cases remained high (94.1%; 16 of 17) but accuracy in the pN0 group was only 21.2% (11 of 52). Overall, classification accuracy for PAM in the validation set was 39.1% (27 of 69) when compared with pathology. The classification probabilities for individual samples were similar to those in the test set with 100% probability for 54 samples, 80% to 99% for 11 samples, and 50% to 80% for 4 samples (Fig. 2B).
Correlation of prediction analysis of microarray nodal classification with recurrence and survival
In the training data set, Kaplan-Meier survival estimates showed that survival was significantly worse in PAM-positive cases than in PAM-negative cases (P < 0.0001) for all 86 patients. Furthermore, when the survival analysis was restricted to the pN0 patients only, we found that survival was worse in 9 PAM-positive cases compared with 60 PAM-negative cases (P = 0.0037; Fig. 3A). Thus, PAM successfully identified a subgroup (13%) of patients with worse outcome within the pN0 patients based on the microarray nodal status classification.
Fig. 3.

Kaplan-Meier survival curves for pathologic node-negative patients classified as positive or negative by PAM analysis. Michigan data set (A) and Harvard data set (B).
In the validation data set, survival analysis of all 69 patients showed that PAM-negative and PAM-positive patients again differed significantly in overall survival (P = 0.0258) although the stratification was not as strong as in the training set. In the 52 pN0 patients only, disease recurrence was significantly higher (19 of 41, 46.3%) in PAM-positive patients than in PAM-negative patients (1 of 11, 9%; Table 3) and survival analysis showed that survival was worse in 41 PAM-positive patients compared with 11 PAM-negative patients (P = 0.0507; Fig. 3B).
Table 3.
Patients relapse/metastasis status in Harvard data set
| Node status | Site of relapse/metastasis* | ||||||
|---|---|---|---|---|---|---|---|
| Pathology | No. patients | PAM predicted | No. patients | Lymph node | Lung only | Other site | Total (%) |
| Negative | 52 | N0 | 11 | 0 | 1 | 0 | 1 (9.0) |
| N+ | 41 | 5 | 2 | 12 | 19 (46.3) † | ||
| Positive | 17 | N0 | 1 | 0 | 0 | 0 | 0 |
| N+ | 16 | 3 | 3 | 6 | 12 (75.0) | ||
Data was from http://research.dfci.harvard.edu/meyersonlab/lungca/.
Significantly higher than PAM predicted N0 patients within pathologic negative group (P = 0.024).
Discussion
Treatment options for patients with non–small cell lung cancer are largely dictated by the status of local and regional lymph nodes. Node-negative patients are typically treated with surgery alone whereas patients with lymph node involvement will frequently receive adjuvant or neoadjuvant chemotherapy, as well as surgery, in the belief that their tumor has spread and that surgery alone is less likely to result in a cure. Identification of lymph node metastases therefore plays a critical part in the current management of non–small cell lung cancer patients. Unfortunately, however, current methods for clinical and pathologic staging of lymph nodes are not very sensitive and many patients are understaged. As a result, many studies have been undertaken in attempts to improve the sensitivity of lymph node metastasis detection using either immunohistochemistry or molecular methods such as reverse transcription-PCR (3). In both cases, these assays directly identify metastatic disease in the lymph nodes.
More recently, analysis of gene expression in the primary tumor has been shown to correlate with patient outcome (4). Thus, it is possible that surgical removal and pathologic evaluation of lymph nodes may not be necessary to accurately predict a patients' survival probability. However, because survival is linked to effective treatment, and effective treatment is currently determined by nodal stage, it is unclear whether predicting patient outcome alone will be sufficient to avoid the need for accurate lymph node assessment. With this in mind, other recent studies have also shown that it may be possible to predict metastatic potential (6) and specifically lymph node metastases (7, 11) using analysis of gene expression in the primary tumor. For example, Huang et al. used microarrays to determine gene expression in 89 primary breast tumors and then used complex statistical approaches to identify patterns and interactions between genes that correlated with patient outcome. The authors identified patterns of gene expression that were associated with either lymph node involvement or survival, indicating that these two end points represent distinct biological processes, involving different gene sets. Interestingly, the genes that correlated with survival were the ‘classic’ oncogenes associated with cell cycle, growth, cell signaling, etc., whereas the genes associated with lymph node involvement tended to be chemokines, chemokine receptors, and IFN-associated genes. This is very similar to the data reported by Ramaswamy et al. and raises the hypothesis that the ability of a tumor to metastasize is dependent on the host response to the tumor, and that this is what can actually be detected by analysis of the primary tumor. Thus, it is possible that analysis of the primary tumor may provide information on both the probability of survival and lymph node metastasis. Understanding the genomic differences between these closely related end points may prove useful for determining the appropriate treatment of non-small cell lung cancer patients.
In the current study, we specifically aimed to determine whether analysis of gene expression in primary non–small cell lung cancer could predict lymph node status and, if so, predict outcome in lymph node–negative patients, many of whom are presumed to have occult lymph node metastases (3). For our study, we used pathologic lymph node status as the training classifier, and used microarray analysis software (PAM) to identify gene patterns that specifically correlate with pathologic nodal status. PAM identified 318 significant genes that were associated with nodal metastases. Of the top 50 genes (Table 2), 35 are overexpressed in tumors with lymph node metastases and the remaining 15 genes are underexpressed. These genes are involved in a wide spectrum of biological functions including extracellular matrix, protein synthesis/degradation, cell adhesion and structure, and regulation of transcription/translation. Interestingly, among the 35 overexpressed genes, four genes are from the collagen gene family and four are from the S100 calcium binding protein family. The up-regulation of collagen genes in tumors with nodal metastasis is consistent with observations that interactions between tumor cells and the surrounding stroma are critical for tumor cell invasion (12–14). High levels of collagen gene expression have also been observed in advanced gastric and ovarian cancers using cDNA microarrays and serial analysis of gene expression, and in colorectal cancer using differential display reverse transcription-PCR (15–17). Overexpression of S100A4 and S100A2 has also been associated with metastasis and survival in patients with early-stage breast cancer (18) and non–small cell lung cancer (19). Of the underexpressed genes, down-regulation of the HLA-B gene may allow tumor cells to escape the T-cell response and this is a potential mechanism for tumor cells to escape immune surveillance (20–22). Down-regulation of the another gene, MGP, has also been seen in colon cancer (23) and has been associated with metastasis in prostate adenocarcinoma (24). Therefore, capture of these genes as the top genes associated with nodal metastases by PAM classification probably reflects the biological pathways contributing to the nodal metastases phenotype.
One clear weakness in our study is that many of the pN0 patients may actually have occult nodal involvement and, therefore, our gold standard for the training classifier is not necessarily accurate in pathologically node-negative cases. However, it should be 100% accurate in the case of node-positive tumors. Indeed, in both the training and validation data sets, we found extremely high (94%) concordance between microarray analysis and pathologic node status for tumors with pathologically positive lymph nodes. In node-negative tumors, however, microarray analysis of the training set data predicted that 9 of 69 (13%) pN0 tumors were actually node positive. This finding agrees quite well with estimates on the prevalence of occult lymph node disease in non–small cell lung cancer (3) and survival of these nine patients was significantly worse than for the remaining 60 pN0 patients (P = 0.0037). In the validation set, however, an unexpectedly high number (41 of 52, 79%) of pN0 tumors were classified as positive by PAM. Clearly, this is too high to be explained by the presence of occult disease alone and, therefore, we considered the following alternative possibilities: (1) Average expression values from the Harvard data set were much higher than that from Michigan data. This might cause prediction bias when the training algorithm generated with the Michigan data set was applied to the Harvard data. To make the differences smaller between the two data sets, we normalized the data using Z transformation but did not find any improvement in the performance of training and testing. (2) PAM was overtrained with the training data set. To test this hypothesis, a simulated data set that included 5,377 values (randomly assigned from −10 to 2,000) in 86 samples with two classes (randomly assigned with 1 or 2) was generated and applied to PAM for classification training. The overall classification error with cross-validation was 40% to 50% and classification probabilities for individual samples were from 40% to 60% (Supplementary Fig. 1). This shows that PAM classified the simulated data randomly (as it should) and indicates that the method does not overtrain for classification. (3) The population of patients between the two data sets was significantly different in terms of staging and/or outcome. Comparison of patient survival between the two data sets was analyzed and the results showed that patients from the Harvard data set had a significantly worse survival than the patients from the Michigan data set (P = 0.0245). Interestingly, this difference was completely due to differences in survival among the pN0 patients in the two data sets (P = 0.058), whereas there was no difference in survival of the pN+ patients between the two data sets (P = 0.9499; Supplementary Fig. 2).
When we analyzed survival in PAM-negative and PAM-positive patients within Harvard pN0 patients, 46.3% of PAM-positive patients suffered disease recurrence compared with only 9% in the PAM-negative patients. Thus, we believe that the poor outcome in the pN0 Harvard patients reflects understaging (possibly occult nodal disease) in a higher than normal percentage of patients, and to some degree this is responsible for the high number of patients called node positive in the microarray analysis. Furthermore, when we used the Harvard data set for training, 70% of the pathology-positive and 38% of the pathology-negative patients were incorrectly classified by PAM. Overall, cross-validated classification accuracy when training with the Harvard data set was only 54%. Again, we hypothesize that this inability to attain good classification accuracy (even within the training set itself) may be a result of a high frequency of occult lymph node disease in this patient set. Despite this, however, 22 patients who did not suffer disease recurrence were still called node positive in our analysis (when training with the Michigan data set), implying that many patients who were probably truly node negative were misclassified in the test set. This may be a result of differences between the two microarray data sets or may reflect the need to refine the analysis tools used for prediction. Another possibility is that some of the misclassified tumors do actually have the potential to metastasize but have not yet done so. Presumably, metastasis requires not only metastatic ability but also time, and it is therefore possible that the actual detection of lymph node disease (overt or occult) will prove to be a more powerful predictor of outcome than the primary tumor gene expression. Conversely, however, one could envision a scenario where tumor cells have spread to lymph nodes (or distant sites) but are unable to divide, grow, and/or evade the host immune system. This may be encoded in the genetics of the primary tumor in which case the gene expression data may be the more powerful predictor.
In summary, our analysis of gene expression in primary tumors correlated very highly in pathologically node-positive patients. Furthermore, recurrence rates and overall survival were worse in the pN0 patients who were “misclassified” as positive by microarray analysis, and it seems likely that the analysis may be identifying patients whose tumors have already metastasized or have the potential to do so. However, one problem with this interpretation of the data is that we do not have actual data on occult lymph node disease (detected by immunohistochemistry or reverse transcription-PCR) in pN0 patients. Instead, we are using recurrence and overall survival as surrogates for occult disease and this end point may reflect not only lymph node spread but also hematogenous spread and clinically occult metastases to other organs. Furthermore, because lymph node metastasis and survival are closely correlated, it is possible that despite training based on lymph node status, our analysis is actually identifying genes that correlate with overall outcome and not specifically with the ability to metastasize. Thus, we realize that our explanation for the unexpectedly high false-positive results from microarray analysis may in fact be somewhat circular. This issue can only be resolved in a situation where tumor gene expression, accurate clinical and surgical staging, and presence of occult nodal disease are determined in the same set of patients.
Supplementary Material
Acknowledgments
Grant support: University of Pittsburgh Lung Cancer Specialized Programs of Research Excellence and Claude Worthington Benedum Foundation (to Drs. M.J. Becich and R. Herberman, in support of Dr. Lyons-Weilers' recruitment to University of Pittsburgh Cancer Institute).
Footnotes
Note: Supplementary data for this article are available at Clinical Cancer Research Online (http://clincancerres.aacrjournals.org/) or (http://www.mssm.edu/labs/godfrt01/publications/supp.htm).
References
- 1.Boring CC, Squires TS, Tong T, Montgomery S. Cancer statistics, 1994. CA Cancer J Clin. 1994;44:7–26. doi: 10.3322/canjclin.44.1.7. [DOI] [PubMed] [Google Scholar]
- 2.De Vita VT, Jr, Hellman S, Rosenberg SA. Cancer: principles and practice of oncology. 6. Philadelphia: Lippincott Williams & Wilkins; 2001. [Google Scholar]
- 3.Coello MC, Luketich JD, Litle VR, Godfrey TE. Prognostic significance of micrometastasis in non-small-cell lung cancer. Clin Lung Cancer. 2004;5:214–25. doi: 10.3816/CLC.2004.n.002. [DOI] [PubMed] [Google Scholar]
- 4.Beer DG, Kardia SL, Huang CC, et al. Gene-expression profiles predict survival of patients with lung adenocarcinoma. Nat Med. 2002;8:816–24. doi: 10.1038/nm733. [DOI] [PubMed] [Google Scholar]
- 5.Naruke T, Goya T, Tsuchiya R, Suemasu K. Prognosis and survival in resected lung carcinoma based on the new international staging system. J Thorac Cardiovasc Surg. 1988;96:440–7. [PubMed] [Google Scholar]
- 6.Ramaswamy S, Ross KN, Lander ES, Golub TR. A molecular signature of metastasis in primary solid tumors. Nat Genet. 2003;33:49–54. doi: 10.1038/ng1060. [DOI] [PubMed] [Google Scholar]
- 7.Huang E, Cheng SH, Dressman H, et al. Gene expression predictors of breast cancer outcomes. Lancet. 2003;361:1590–6. doi: 10.1016/S0140-6736(03)13308-9. [DOI] [PubMed] [Google Scholar]
- 8.Bhattacharjee A, Richards WG, Staunton J, et al. Classification of human lung carcinomas by mRNA expression profiling reveals distinct adenocarcinoma subclasses. Proc Natl Acad Sci U S A. 2001;98:13790–5. doi: 10.1073/pnas.191502998. [DOI] [PMC free article] [PubMed] [Google Scholar]
- 9.Patel S, Lyons-Weiler J. caGEDA: a web application for the integrated analysis of global expression patterns in cancer. Applied Bioinformatics. 2004;3:49–62. doi: 10.2165/00822942-200403010-00007. [DOI] [PubMed] [Google Scholar]
- 10.Tibshirani R, Hastie T, Narasimhan B, Chu G. Diagnosis of multiple cancer types by shrunken centroids of gene expression. Proc Natl Acad Sci U S A. 2002;99:6567–72. doi: 10.1073/pnas.082099299. [DOI] [PMC free article] [PubMed] [Google Scholar]
- 11.Kikuchi T, Daigo Y, Katagiri T, et al. Expression profiles of non-small cell lung cancers on cDNA microarrays: identification of genes for prediction of lymph-node metastasis and sensitivity to anti-cancer drugs. Oncogene. 2003;22:2192–205. doi: 10.1038/sj.onc.1206288. [DOI] [PubMed] [Google Scholar]
- 12.Jensen BV, Johansen JS, Skovsgaard T, Brand J, Teisner B. Extracellular matrix building marked by the N-terminal propeptide of procollagen type I reflect aggressiveness of recurrent breast cancer. Int J Cancer. 2002;98:582–9. doi: 10.1002/ijc.10187. [DOI] [PubMed] [Google Scholar]
- 13.Olumi AF, Grossfeld GD, Hayward SW, Carroll PR, Tlsty TD, Cunha GR. Carcinoma-associated fibroblasts direct tumor progression of initiated human prostatic epithelium. Cancer Res. 1999;59:5002–11. doi: 10.1186/bcr138. [DOI] [PMC free article] [PubMed] [Google Scholar]
- 14.Skobe M, Fusenig NE. Tumorigenic conversion of immortal human keratinocytes through stromal cell activation. Proc Natl Acad Sci USA. 1998;95:1050–5. doi: 10.1073/pnas.95.3.1050. [DOI] [PMC free article] [PubMed] [Google Scholar]
- 15.Fischer H, Stenling R, Rubio C, Lindblom A. Colorectal carcinogenesis is associated with stromal expression of COL11A1 and COL5A2. Carcinogenesis. 2001;22:875–8. doi: 10.1093/carcin/22.6.875. [DOI] [PubMed] [Google Scholar]
- 16.Tapper J, Kettunen E, El Rifai W, Seppala M, Andersson LC, Knuutila S. Changes in gene expression during progression of ovarian carcinoma. Cancer Genet Cytogenet. 2001;128:1–6. doi: 10.1016/s0165-4608(01)00386-7. [DOI] [PubMed] [Google Scholar]
- 17.Oue N, Hamai Y, Mitani Y, et al. Gene expression profile of gastric carcinoma: identification of genes and tags potentially involved in invasion, metastasis, and carcinogenesis by serial analysis of gene expression. Cancer Res. 2004;64:2397–405. doi: 10.1158/0008-5472.can-03-3514. [DOI] [PubMed] [Google Scholar]
- 18.Lee WY, Su WC, Lin PW, Guo HR, Chang TW, Chen HH. Expression of S100A4 and Met: potential predictors for metastasis and survival in early-stage breast cancer. Oncology. 2004;66:429–38. doi: 10.1159/000079496. [DOI] [PubMed] [Google Scholar]
- 19.Diederichs S, Bulk E, Steffen B, et al. S100 family members and trypsinogens are predictors of distant metastasis and survival in early-stage non-small cell lung cancer. Cancer Res. 2004;64:5564–9. doi: 10.1158/0008-5472.CAN-04-2004. [DOI] [PubMed] [Google Scholar]
- 20.Cabrera T, Maleno I, Lopez-Nevot MA, et al. High frequency of HLA-B44 allelic losses in human solid tumors. Hum Immunol. 2003;64:941–50. doi: 10.1016/s0198-8859(03)00164-2. [DOI] [PubMed] [Google Scholar]
- 21.Bodmer WF, Browning MJ, Krausa P, Rowan A, Bicknell DC, Bodmer JG. Tumor escape from immune response by variation in HLA expression and other mechanisms. Ann N Y Acad Sci. 1993;690:42–9. doi: 10.1111/j.1749-6632.1993.tb43994.x. [DOI] [PubMed] [Google Scholar]
- 22.Garrido F, Ruiz-Cabello F, Cabrera T, et al. Implications for immunosurveillance of altered HLA class I phenotypes in human tumours. Immunol Today. 1997;18:89–95. doi: 10.1016/s0167-5699(96)10075-x. [DOI] [PubMed] [Google Scholar]
- 23.Fan C, Sheu D, Fan H, Hsu K, Allen CC, Chan E. Down-regulation of matrix Gla protein messenger RNA in human colorectal adenocarcinomas. Cancer Lett. 2001;165:63–9. doi: 10.1016/s0304-3835(01)00416-5. [DOI] [PubMed] [Google Scholar]
- 24.Levedakou EN, Strohmeyer TG, Effert PJ, Liu ET. Expression of the matrix Gla protein in urogenital malignancies. Int J Cancer. 1992;52:534–7. doi: 10.1002/ijc.2910520406. [DOI] [PubMed] [Google Scholar]
Associated Data
This section collects any data citations, data availability statements, or supplementary materials included in this article.