Abstract
Fluorescence change is convenient for monitoring enzyme kinetics. Unfortunately, it looses linearity as the absorbance of the fluorescent substrate increases with concentration. When the sum of absorbance at excitation and emission wavelengths exceeds 0.08, this inner filtering effect (IFE) alters apparent initial velocities, Km, and kcat. The IFE distortion of apparent initial velocities can be corrected without doing fluorophore dilution assays. Using the substrate’s extinction coefficients at excitation and emission wavelengths, the inner filter effect can be modeled during curve fitting for more accurate Michaelis-Menten parameters. A faster and simpler approach is to derive kcat and Km from progress curves. Strategies to obtain reliable and reproducible estimates of kcat and Km from only two or three progress curves are illustrated using matrix metalloproteinase-12 and alkaline phosphatase. Accurate estimates of concentration of enzyme active sites and specificity constant kcat/Km (from one progress curve with [S] ≪ Km) confer accuracy, freedom of choices of [S], and robustness to kcat and Km globally fitted to a few progress curves. The economies of the progress curve approach make accurate kcat and Km more accessible from fluorescence measurements.
Keywords: inner filter effect, FRET, steady-state kinetics, global analysis, non-linear regression
Fluorescence change of substrates, particularly those labeled for Förster resonance energy transfer (FRET) (1), is a convenient and sensitive approach to study the kinetics of hydrolytic enzyme reactions (2, 3). Consequently, it is popular to assay proteases using FRET with peptide substrates (2, 4, 5). However, at increasing concentration of the fluorescent substrate, its increasing absorbance introduces the inner filter effect (IFE) that decreases the fluorescence emission and change (6–8) (Fig. 1). Decreases in fluorescence due to inner filtering exceed 10% once the sum of the absorbances at excitation and emission wavelengths exceeds 0.08 (6). The concentration-dependence of fluorescence of FRET-labeled protease substrates typically becomes problematic above 20 μM substrate (9–11) (Fig. 2). This loss of linearity in fluorescence and in velocities calls for correction of the IFE. The correction needed can become very large at high substrate concentrations (6) (Fig. 2). Existing methods of correction are time- and labor-intensive (9, 10, 12). When concentrations of FRET substrate of 20 μM and higher are needed, the following outcomes are possible. Systematic error can remain, particularly if unrecognized (10). The astute investigator will choose a cuvette with shorter pathlength to decrease the IFE. Even with this improvement, IFE could remain large enough to lead the investigator to avoid use of velocities at higher substrate concentrations needed, where fluorescence and apparent velocities are attenuated. However, avoidance of IFE-compromised points leads to systematic error in fitted kinetic parameters (Fig. 1, fits to open symbols). The investigator could elect not to determine Km or kcat. The investigator could switch from continuous fluorescence assay to a discontinuous HPLC-based assay (13, 14).
Fig. 1.
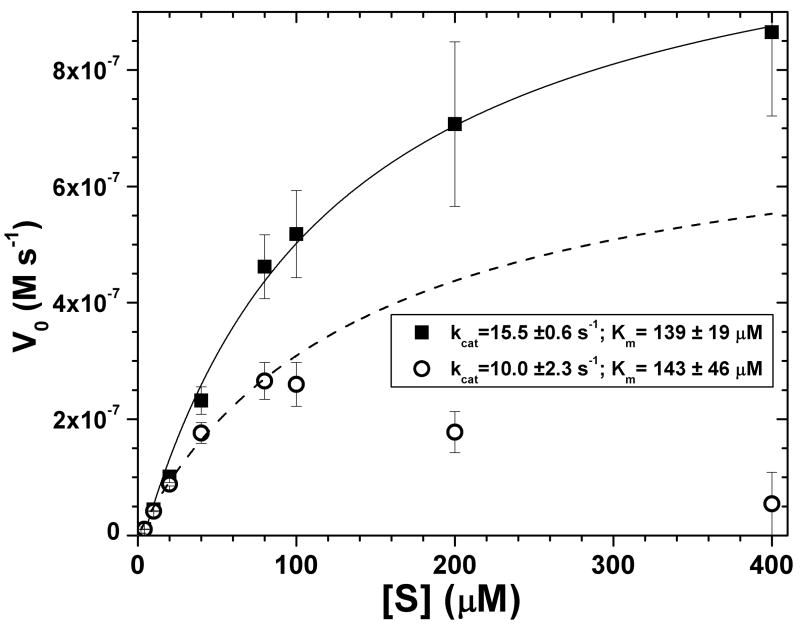
Apparent initial velocities V0 of proteolysis of substrate FS-6 by 75 nM MMP-12, without correction (open circles, dashed line) and with correction of IFE (filled squares, solid line). The corrections were determined using standard fluorophore dilution assays. Standard deviations shown derive from triplicate measurements. The curves, kcat, and Km values have been least-squares fitted to the Michaelis-Menten equation. For the uncorrected data, only points as high as 80 μM FS-6 were fitted.
Fig. 2.
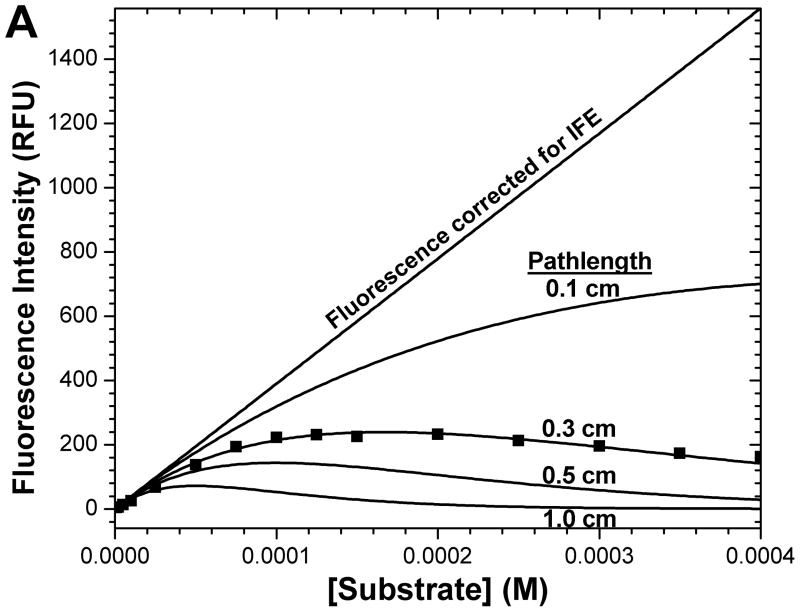
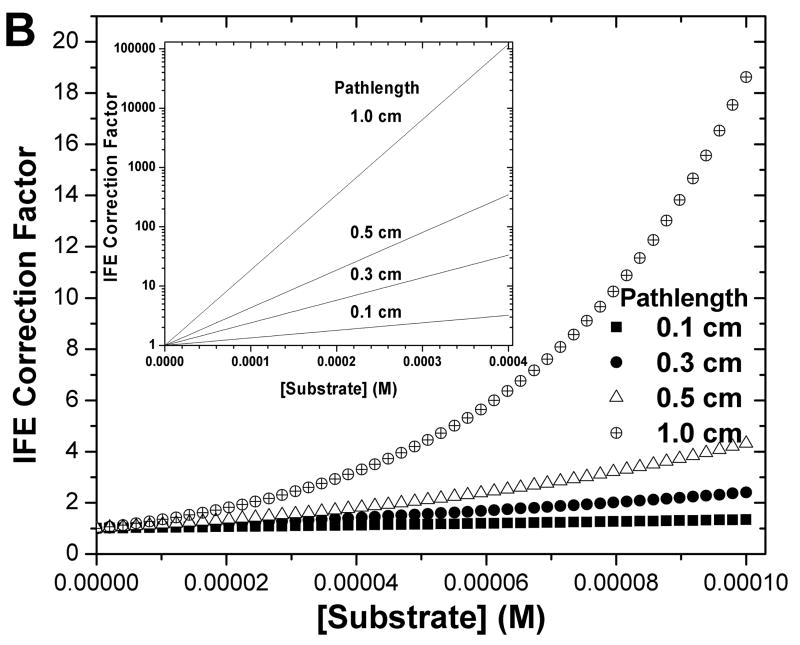
Pathlength and concentration dependence of fluorescence intensity (A) of the example substrate of FS-6 and its IFE correction function (B). 400 μM FS-6, completely hydrolyzed by MMP-12, was progressively diluted in a 3 × 3 mm square cuvette to illustrate non-linear concentration-dependence. The combined extinction coefficient ε′ (see eq. 4) that fits the series of FS-6 concentrations was used to simulate the fluorescence intensities (A) and IFE correction factors (B) for cuvettes of square cross-section with interior widths of 1, 0.5, 0.3, or 0.1 cm. The inset in (B) uses a logarithmic scale to show the large IFE corrections at higher concentrations.
The fluorescence possible when absorbance effects are corrected, Fcor, experiences attenuation by the inner filter effect (IFE) to give observed fluorescence, Fobs (6, 10):
| (1) |
The IFE can be corrected by measuring the attenuation of fluorescence intensity of a free fluorophore, with various FRET substrate concentrations present (7, 15). The IFE correction coefficients derived this way are the ratio of fluorescence intensity in the presence of quenching agent divided by the intensity using the fluorophore alone (7, 8): q = f (at each [substrate])/f (fluorophore alone), where f is fluorescent intensity and q[subtrate] is the correction factor for the substrate concentration. Since a separate coefficient is needed for each substrate concentration used for initial velocities, this method uses much expensive FRET compound and is time-consuming to run and analyze.
The IFE correction is the product of correction factors fex and fem for absorbances at the fluorescence excitation and emission wavelengths Aex and Aem, respectively (6, 16, 17):
| (2) |
Beer’s law of A = ε′ c·ℓ, where c is concentration and ℓ pathlength, can be substituted into eq. 2 to yield:
| (3) |
The factor of ℓ/2 in the exponent of eq. 3 is associated with the typical square geometry of a cell illuminated and observed perpendicular from the respective faces at the midpoint. Herein, we show that nonlinear least squares fitting of initial velocity measurements can be modified by exploiting eq. 3 to obtain Michaelis-Menten parameters corrected for IFE. Progress curves can also be used to obtain kcat and Km values (18–22). We find that reproducible estimates of kcat and Km can be obtained reliably from fits of a pair of progress curves. Fits of a few progress curves is most efficient and convenient for overcoming IFE and describing steady-state kinetics.
Materials and methods
Enzymes
Human MMP-12 (23 350) was expressed as the 18.2 kDa catalytic domain in E. coli using an ampicillin-selectable pGEMEX vector (Promega) with T7 promoter, kindly provided by Prof. Qizhuang Ye. MMP-12 was recovered from insoluble inclusion bodies as reported (24). Isolated inclusion bodies were solubilized in concentrated urea. The denatured apoMMP-12 was then enriched by fast flow S-sepharose ion exchange chromatography. Refolding was achieved by dilution of urea with 20 mM Tris-HCl, pH 7.5 buffer containing 3.0 mM CaCl2 and 0.1 mM ZnCl2. Final purification employed Q-sepharose ion exchange chromatography. Concentration of pure MMP-12 was assayed using the BioRad protein assay, known to be accurate to within 5% of amino acid analysis for MMP-3 and N-TIMP-1 (25). Specific activity was measured by active site titration against the reversible, tight binding inhibitor galardin (26–28).
Alkaline phosphatase from bovine intestinal mucosa was purchased from Sigma-Aldrich (cat # P6774), with a specific activity of 3190 DEA units/mg. The DEA unit is that amount of phosphatase that will hydrolyze 1.0 μmole of PNP per min at 37°C in diethanolamine buffer at pH 9.6 with an initial [pNPP] of 6.0 mM.
Substrates, inhibitors, and buffers
For MMP-12 assays, the FRET peptide FS-6 was purchased from EMD (Calbiochem cat # 444282). The peptide formula is Mca-Lys-Pro-Leu-Gly-Leu-Dpa-Ala-Arg-NH2 (13). Its fluorophore and quencher are Mca, (7-methoxycoumarin-4-yl)acetyl, and Dpa, N-3-(2,4-dinitrophenyl)-L-2,3-diaminopropionyl, respectively. For alkaline phosphatase, the substrate used was p-nitrophenylphosphate, purchased from Sigma-Aldrich (cat # 73724). The MMP inhibitor galardin was purchased from EMD (Calbiochem cat # GM 6001). All buffers, salts, and other reagents used in enzyme formulation and enzymatic assays were purchased from Sigma-Aldrich.
Enzymatic Assays
Concentration of active sites is a fitting parameter for kinetics. Active site titrations (29, 30) of MMP-12 used galardin as the inhibitor and were analyzed according to ref (26). All kinetic experiments using MMP-12 were performed in 0.1 M Tris-HCl, pH 7.5, containing 0.1 M NaCl, 10 mM CaCl2, 0.1 mM ZnCl2. All experiments using alkaline phosphatase used 0.1 M Tris-HCl buffer, pH 8.0, containing 10 mM CaCl2. The substrates FS-6 (13) and p-nitrophenylphosphate (pNPP) (31) were used for MMP-12 and alkaline phosphatase, respectively. MMP-12’s hydrolysis of the substrate FS-6 was detected as enhanced fluorescence when quenching was relieved by proteolysis. All fluorescence-based assays were performed using an SLM Aminco Model 8100 fluorometer. Chromogenic assays were performed using a Cary Model 3E UV/Vis spectrophotometer. All assays were performed at 25 °C. The excitation and emission wavelengths for monitoring hydrolysis of FS-6 were 328 nm and 393 nm, respectively. The ε ex,324 and εem,398 of FS-6 were estimated in the buffer used for kinetic assays to be 10100 cm−1M−1 and 3700 cm−1M−1, respectively. All fluorescence experiments were performed in a 3 × 3 mm rectangular cuvette in order to decrease the pathlength and IFE.
Nonlinear fitting
Nonlinear and global regression analysis of kinetic data used Origin® Pro 7.5 (Microcal, Northampton, MA). Optimization of fitted parameters used iterations of the Simplex algorithm followed by Levenberg-Marquardt minimization. Since global fits of enzyme kinetics are very sensitive to the concentration of active sites, we carefully titrated the active sites for accuracy. Substrate concentrations were verified by absorbance. For fitting initial velocities subject to IFE, the constant underlying the IFE correction is the following product of extinction coefficients and path length:
| (4) |
Results
When facing steady-state kinetics data like those in open symbols in Fig. 1, how are meaningful Michaelis constant Km and kcat to be derived? These effects should first be recognized as concentration dependence of fluorescence. The inner filter effect needs attention once Aex + Aem > 0.08 (eq. 2) (6). In the example of Fig. 1, the substrate FS-6 is a peptide labeled for FRET assay of MMPs and other metalloproteases (13). The enzyme (MMP-12) has a high enough Km for FS-6 to demand use of higher substrate concentrations. Aex and Aem of FS-6 are, however, high enough for significant bias from IFE at 20 μM and higher concentrations (Fig. 2), despite the modest pathlength of the 3 × 3 mm square cuvette used in all fluorescence assays in this report. Consequently, the uncorrected initial velocities appear to decrease as [FS-6] increases beyond 80 μM (open circles, Fig. 1). The distortion is even more striking in double reciprocal plots (not shown).
The solid symbols of Fig. 1 were obtained using the prevailing approach of correcting the IFE attenuation of fluorescence prior to fitting them to Michaelis-Menten kinetics. The pre-correction employs fluorophore dilution assays (7, 8, 13, 15). Nonlinear regression analysis of the IFE-corrected points revises apparent kcat to 15.5 ± 0.6 s−1 and better defines Km to 139 ± 19 μM (squares, Fig. 1). This strategy of pre-correction of IFE is feasible but laborious. We sought more efficient ways to overcome the IFE that recurs in our work.
Fig. 2 clarifies where the attenuation of apparent initial velocities arises. Nonlinear attenuation of fluorescence with increasing concentration is illustrated for substrate FS-6. By 20 μM in a 3 × 3 mm cuvette, its fluorescence falls below linear dependence upon concentration (square points, Fig. 2A). Its fluorescence is maximal between 100 and 200 μM (Fig. 2A). Equations 1 and 3 have been fitted to the measurements. Using the fitted value of the combined extinction coefficient ε′ (eq. 4), fluorescence intensities (Fig. 2A; Fobs of eq. 1) and corresponding IFE correction functions (Fig. 2B; eq. 3) have been simulated for other sizes of square cuvettes. Multiplication of Fobs by the exponentially rising IFE function corrects affected points to the linear Fcor estimates. Suppose that IFE correction factors of greater than 40 are considered to amplify uncertainties too much to be trusted, IFE corrections are then too severe for use when this representative substrate exceeds 130 μM in a 1 cm square cuvette, 250 μM in a 0.5 cm square cuvette, or 420 μM in a 0.3 cm square cuvette. The fluorescence intensity virtually disappears by 300 μM of this typical fluorescent substrate in a standard 1 cm square cuvette (Fig. 2). We found a 3 × 3 mm square cuvette to be a convenient alternative to the problems of larger cuvettes.
IFE correction while fitting initial velocities
Without pre-correcting data points, IFE can be corrected “on-the-fly” during curve fitting. This only requires incorporating ε ex and εem from eq. 4 into the fit. For initial velocities that follow simple Michaelis-Menten kinetics, the Michaelis-Menten equation can be scaled by the function describing the IFE during nonlinear global fitting:
| (5a) |
| (5b) |
| (5c) |
where Et is the total concentration of enzyme active sites.
The procedure fits a group of initial velocity experiments at varied enzyme concentrations (see Fig. 3) with the modified Michaelis-Menten expression (eq. 5a,b,c) using the following steps in a fitting program such as Origin®:
Fig. 3.
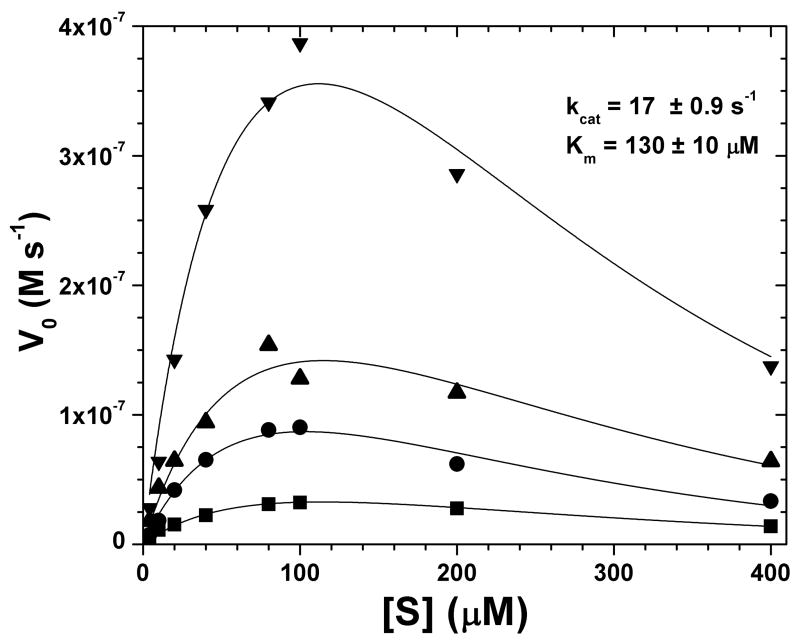
Initial velocities V0 fitted with Michaelis-Menten curves that incorporate IFE correction “on-the-fly” and global fitting at different enzyme concentrations. Each range of FS-6 substrate concentrations was assayed at the following MMP-12 concentrations: 10 nM (■), 25 nM (●), 50nM (▲), 100 nM (▼). The four sets of fluorescence kinetics data share the same kcat and Km during global fitting. Best initial parameter estimates were made by using simplex iterations, varying enzyme and substrate concentrations and then ε′ℓ for IFE correction. Best fits of kcat and Km are 17.0 ± 0.9 s−1 and 130 ± 10 μM, respectively.
Specify the substrate’s ε ex and εem for the assay. This defines ε′ℓ of eq. 4, 5a.
Specify measured [Et].
Initialize with best guess estimates of kcat and Km.
Globally share kcat and Km parameters to be fitted using the V0 vs. [S0] series at each Et.
Perform iterations until the fitted functions satisfy each V0 vs. [S0] series.
When the fitted functions converge with the data, the constant ε′ℓ for IFE correction can be fine tuned in a subsequent round of optimization. This can compensate for slight perturbations of ε ex and εem.
Incorporation of IFE correction in the curve fitting adds the parameter ε′ℓ for fitting. This requires measuring another experimental variable in order to obtain statistically robust fits. Enzyme concentration is suitable for this. Consequently, initial velocities of FS-6 hydrolysis were assayed at four different MMP-12 concentrations (Fig. 3). Three or more different enzyme concentrations were necessary to obtain kcat and Km with fitting uncertainties < 10%. When fitting these data, kcat and Km are specified as shared parameters. The IFE parameter ε′ℓ (eq. 4) can be treated as a shared parameter if the assay environment between data sets is identical. (Assay environment includes any conditions that might change the substrate’s ε ex and εem. Slit width, buffer pH, and protein concentration have the potential to affect these optical properties.) This global fitting approach is more robust than analyzing the average of triplicates (32). The values for kcat and Km from the analyses using either conventional pre-correction of IFE or the new global fitting with IFE correction incorporated are in reasonable agreement (Fig. 1, 3). Pre-correction of raw data points leads to kcat of 15.5 ± 0.6 s−1 and Km of 139 ± 19 μM. Fitting of IFE during global fitting yields kcat of 17 ± 0.9 s−1 and Km of 130 ± 10 μM. Outside of calibration of concentration to range of fluorescence change observed, no data manipulation was necessary for IFE correction ”on-the-fly” during global fitting.
Progress curves for simplest IFE correction and fewest measurements
Motivated by a desire to screen the kinetics of multiple enzyme variants and substrates, we sought a more economical strategy to obtain Michaelis-Menten parameters in spite of IFE. Progress curves can be used to extract Michaelis-Menten kinetic parameters (22, 33–35). Detailed procedures to correct IFE can be ignored when using progress curves. This is because each progress curve can be analyzed according to its own unique scale. The progress curve represents the full range of substrate or product concentration with the scale from initial signal (fluorescence) intensity to final intensity plateau where substrate is exhausted. This has been called a “response factor” (20). Although the IFE affects different progress curves to different extents, the IFE is uniform within a progress curve because the absorbance of fluorophore and quencher groups are constant throughout that progress curve. Alteration of the extinction coefficients after hydrolysis would be unusual. In order to derive kcat and Km values from progress curves accurately, it is necessary to measure the concentration of substrate and enzyme solutions each day they are used (36).
Simple Michaelis-Menten kinetics can be applied in the case of irreversible enzyme reactions with a single substrate, as in our example of proteolysis by an MMP (37, 38). It is important to measure the specificity constant kcat/Km (called kS below) from a progress curve acquired under first-order conditions of low [S0] ≪ Km, as described (13, 39). A software routine to fit the progress curves to the Michaelis-Menten equation with Levenburg-Marquardt minimization of Km was written in C++ for fits using Origin®. The source code is available in Supplementary Data. kcat is defined by its relationship to the known specificity constant kS and the unknown Km early in the fitting routine:
| (6a) |
The routine loops through each point of the progress curve. Within this loop, instantaneous substrate concentrations [Si] and [Si−1] and fluorescence Fi and Fi−1 (or other signal intensity) at the same instants are calculated by equations 6b and 6c, respectively:
| (6b) |
| (6c) |
Δt is the time step between points. F0 is the initial fluorescence intensity at initial substrate concentration [S0]. Ff is the fluorescence intensity at the final plateau of the completed reaction. Fitting to eq. 6b provides a smooth, continuous estimate of [Si]. The values of the Km and kS parameters are globally shared among the progress curves fitted together. The factor of (Ff −F0)/[S0] from eq. 6c specifies the total range of fluorescence change accompanying the chemical transformation of all of the substrate to product. This factor effectively converts between the fluorescence scale and the concentration scale. Regardless of how much IFE attenuates the particular progress curve, that progress curve has its own fluorescence to concentration conversion that self-corrects whatever the degree of IFE attenuation is in that curve. In fact, since each progress curve has its own unique scale for degree of completion of the reaction, the unique scale intrinsically corrects for any experimental issue that alters the size of this “vertical” linear scale. Thus, changes of slit width, wavelengths, signal averaging, gain on the photomultiplier, and instrument used for detection are all accommodated within the same global fit of the progress curves.
As accommodating as progress curves are, the fitting process has certain needs. Conversion between fluorescence and concentration depends not only upon [S0], but also F0 and Ff. One or more progress curve should continue well into the substrate depletion phase to a clear plateau that defines Ff. Concentrations [S0] and Et must be known at the outset of fitting, not to mention an accurate value for kcat/Km or kS from the progress curve with first-order kinetics. Knowing the exact concentration Et of enzyme active sites may be the most crucial determinant in obtaining accurate results.
Steps in fitting progress curves
An active site titration to obtain accurate Et must be followed immediately by an accurate kcat/Km determination using a progress curve with first-order kinetics. When Km is not quantified enough to be sure of first-order kinetics, the first-order regime can be recognized as follows. [S] can be set just high enough to measure a reliable progress curve. kcat/Km can be estimated from progress curves with increasing [S]. The estimates of kcat/Km will be reproducible over the range of [S] where first order conditions prevail ([S] ≪ Km). As [S] increases toward Km, the estimates of kcat/Km will drop significantly. For MMP-12 and FS-6, the kcat/Km value measured by this approach is 132800 M−1s−1 (see Supplementary Data). Fitting of the progress curves can then proceed by these steps implemented in Origin®:
Initialize with measured kS and a guess for Km.
When globally fitting more than one substrate or enzyme concentration, share kS and Km parameters among all progress curves fitted.
Set all known parameters and fix them, with the exception of Km.
Allow Km to vary for several iterations or until χ2 is optimized.
Allow kS and Km to vary until χ2 is optimized. Since kS has been measured carefully, it should be constrained to its narrow range of uncertainty during fitting.
Finally, Et and Km can be optimized together to enhance goodness-of-fit. If Et decreases more than slightly, that suggests deterioration of the active site concentration.
Kinetic values from global analysis of MMP-12 progress curves
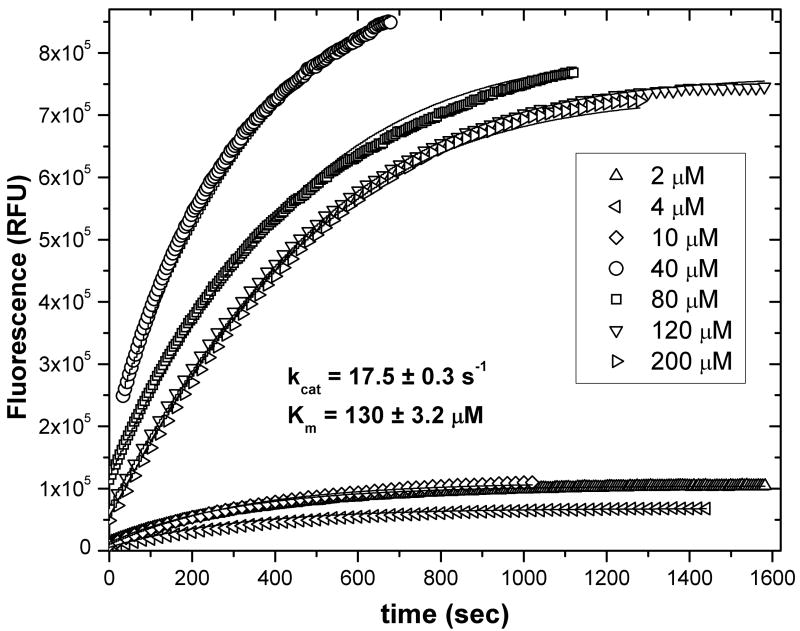
A global analysis of progress curves from reactions at a fixed concentration of MMP-12, done at seven substrate concentrations ranging from 2 to 200 μM FS-6, yields kcat and Km values of 17.5 ± 0.3 s−1 and 130 ± 3 μM (Fig. 4). This is equivalent to but more precise than the fits to initial velocities (Fig. 1 and 3). Using Origin® 7.5 software, global fits of the progress curves finished within a few minutes on a modern PC. The effect of IFE upon the progress curves is evident as the decreasing amplitude of the curves as substrate [FS-6] increases from 40 to 200 μM (Fig. 4). In spite of the IFE, no data manipulation was necessary using this scheme fitting fluorescence intensity versus time.
Fig. 4.
Progress curves from fluorescence-detected assays using 25 nM MMP-12 and FS-6 concentrations at 2, 4, 10, 40, 80, 120 and 200 nM were fitted globally using Origin® 7.5. This used source code containing eq. 6a–c (in Supplementary Data) and several iterations of fitting of kcat and Km parameters shared among progress curves. kcat and Km were calculated to be 17.5 ± 0.3 s−1 and 130 ± 3 μM.
Alternative software suitable for fitting progress curves is the established nonlinear fitting program DynaFit (20). It yields its fitted parameters as microscopic rate constants. DynaFit results provide the same kcat and Km as the fitting protocol that uses eq. 6a, b. However, DynaFit reports uncertainties of very high percentages due to the high level of correlation between kon and koff rates for the equilibrium of the Michaelis complex. The need to vary kcat compounds its large uncertainties. Our source code avoids the larger uncertainties inherent to fitting multiple parameters by fitting just the macroscopic Km value, and possibly the second order rate constant kcat/Km (ks). By globally fitting across different substrate and enzyme concentrations, a more robust determination of Km and kcat is possible. This approach yields values uncertainties of acceptably low percentages.
Reproducibility and accuracy using only two progress curves
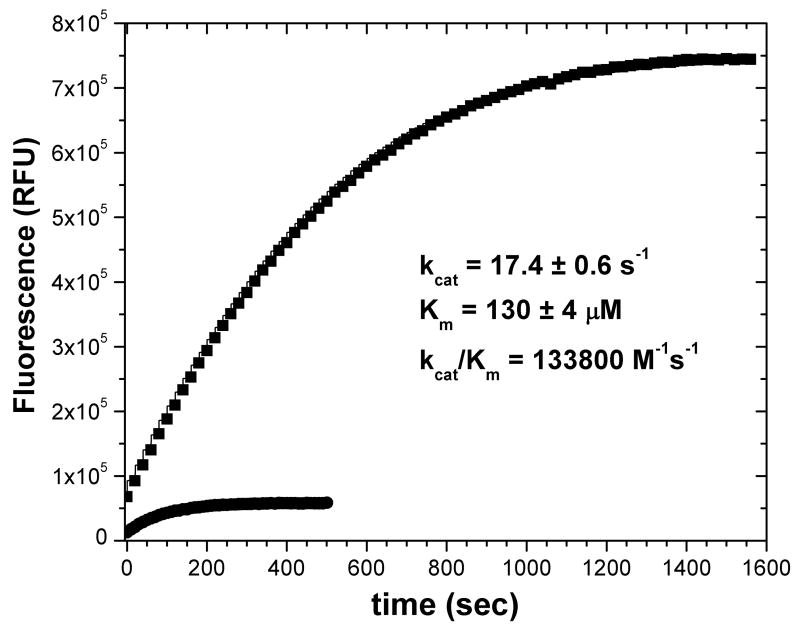
We evaluated choices of substrate and enzyme concentrations that provide reproducible (“accurate”) kcat and Km from just two progress curves. Fitting of both kcat and Km is highly correlated with potential for systematic bias. We addressed this problem by including the constraint of kcat/Km measured from a progress curve with first-order kinetics from low [S]. Pairs of progress curves collected over an entire matrix of combinations of substrate concentrations were analyzed using the approach outlined above with eqs. 6a–c implemented in a C++ routine (Supplementary Data) using Origin®. Most combinations of substrate concentrations lead to kcat and Km estimates that agree to within 10% of trusted values of kcat of 17 – 17.5 s−1 and Km of 130 μM from Fig. 3 or 4 (Tables 1 and 2). At fixed Et, the fits are reasonably accurate provided that one choice of [S] is at least 40 μM (30% of Km) (Table 1). When varying both Et and [S] between the two progress curves fitted together, the range of acceptable combinations of substrate concentrations expands. Any combination of choices of [S] then reproduce expected kcat and Km, provided that one choice of [S] is 8% of Km or higher (≥ 10 nM FS-6) (Table 2). Fig. 5 illustrates an example of a fit of a pair of progress curves of reactions differing in both [MMP-12] and [FS-6]. Global fitting of the pair yields kcat = 17.4 ± 0.6 s−1 and Km = 130 ± 4 μM, which are equivalent in value and precision to fits of seven progress curves (Fig. 4).
Table 1.
Michaelis-Menten parameters globally fitted to pairs of progress curves with differing FS-6 substrate concentrations and fixed [MMP-12].
| kcat (s−1), Km (μM) | ||||||||
|---|---|---|---|---|---|---|---|---|
| 25 nM MMP-12 | ||||||||
| FS-6 (μM) | 2 | 4 | 10 | 40 | 80 | 120 | 200 | |
| 25 nM MMP-12 | 2 | 13.8, 104 | 20.9, 159 | 18.6, 142 | 18.3, 140 | 17.2, 130 | 17.5, 134 | |
| 4 | 20.1, 153 | 17.1, 131 | 18.3, 140 | 17.5, 134 | 17.5, 134 | |||
| 10 | 18.6, 142 | 18.3, 140 | 17.2, 130 | 17.4, 134 | ||||
| 40 | 18.3, 140 | 17.4, 132 | 17.6, 134 | |||||
| 80 | 17.8, 136 | 17.8, 136 | ||||||
| 120 | 17.5, 134 | |||||||
Table 2.
Michaelis-Menten parameters globally fitted to progress curves in which both the FS-6 substrate and enzyme concentrations differ.
| 25 nM MMP-12 | ||||||||
|---|---|---|---|---|---|---|---|---|
| FS-6 (μM) | 2 | 4 | 10 | 40 | 80 | 120 | 200 | |
| 100 nM MMP-12 | 2 | 20.6, 156 | 10.3, 79.6 | 16.3, 125 | 18.2, 138 | 17.6, 132 | 17.7, 133 | 18.5, 140 |
| 4 | 37.7, 287 | 20.9, 160 | 14.5, 110 | 17.5, 132 | 18.1, 139 | 17.8, 133 | 18.0, 138 | |
| 10 | 14.9, 113 | 17.0, 129 | 18.1, 137 | 18.7, 143 | 18.2, 139 | 17.4, 130 | 18.0, 138 | |
| 40 | 16.3, 122 | 16.9, 128 | 18.2, 138 | 17.8, 135 | 17.5, 134 | 17.3, 130 | 17.7, 135 | |
| 80 | 17.5, 133 | 17.3, 133 | 17.9, 137 | 19.3, 147 | 17.2, 130 | 17.4, 133 | 18.5, 141 | |
| 100 | 18.2, 138 | 19.7, 147 | 17.4, 131 | 16.6, 127 | 17.2, 131 | 17.2, 131 | 17.5, 134 | |
| 200 | 17.7, 135 | 17.8, 136 | 18.3, 139 | 18.2, 138 | 15.9, 119 | 17.5, 134 | 17.2, 131 | |
Fig. 5.
Two progress curves sufficient for obtaining kcat and Km through global fitting. The substrate and enzyme concentrations of the two progress runs were (●, lower) 10 μM FS-6, 100 nM MMP-12 and (■, upper) 120 μM FS-6, 25 nM MMP-12.
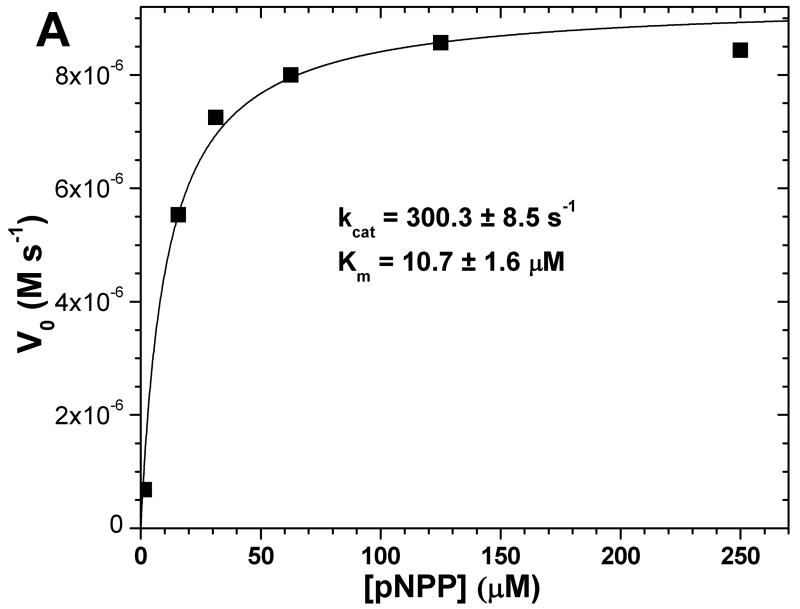
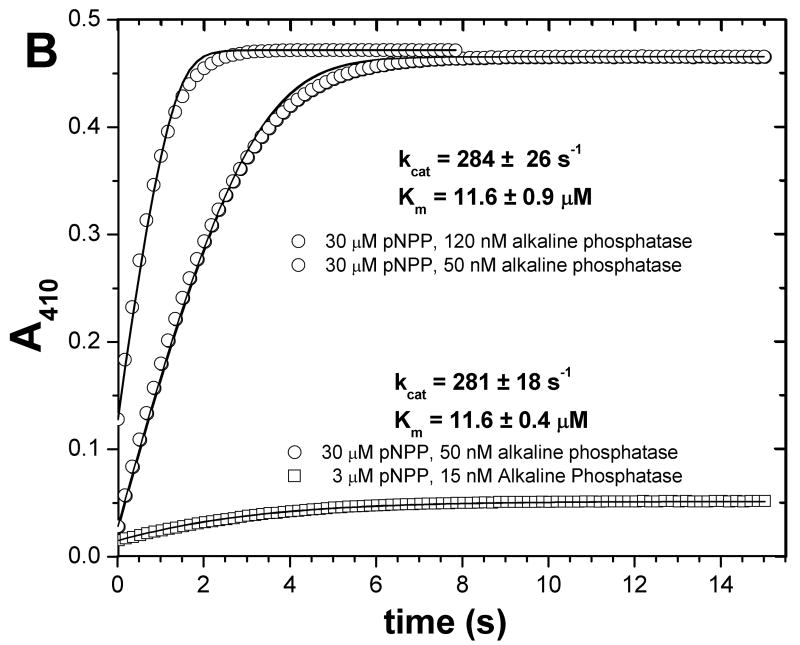
To validate our method of analyzing a pair of progress curves further, we tested it on a different class of hydrolytic enzyme, the well-characterized alkaline phosphatase and its substrate p-nitrophenylphosphate (pNPP). Since pNPP is chromogenic, the progress curves being absorbance data serves to test the fitting method in absence of IFE. For comparison with the progress curve approach, an initial velocity experiment suggests kcat of 300.3 ± 8.5 s−1, Km of 10.7 ± 1.6 μM, and kcat/Km of 2.81 × 10⁷ M−1 s−1 (Fig. 6A). A similar kcat/Km of 2.76 × 10⁷ M−1 s−1 was obtained from a progress curve collected under first-order conditions. A global fit to two other progress curves differing by ten-fold in substrate concentration and about three-fold in alkaline phosphatase concentration suggests kcat of 281 ± 18 s−1, Km 11.6 ± 0.4 μM, and kcat/Km of 2.42 × 10⁷ M−1s−1 (lower part of Fig. 6B). A global fit to two progress curves differing only by 2.4-fold in alkaline phosphatase concentration suggests kcat of 284 ± 18 s−1, Km 11.6 ± 0.9 μM, and kcat/Km of 2.44 × 10⁷ M−1s−1 (upper part of Fig. 6B). These values agree among themselves and closely match the reported kcat/Km of about 2.75 × 10⁷ M−1s−1 (31).
Fig. 6.
Consistency of fits of initial velocities (A) and of progress curves (B) of alkaline phosphatase. The initial velocity experiments of (A) measured the activity of 50 nM alkaline phosphatase from bovine intestinal mucosa upon the chromogenic substrate pNPP. The data (n=1) were fitted to the Michaelis-Menten equation. In panel B, progress curves were fitted as two separate pairs. One pair used 30 μM pNPP in both reactions and 50 or 120 nM alkaline phosphatase (circles); its fitted kcat and Km are listed above. The other pair comprises the progress curve with 30 μM pNPP and 50 nM alkaline phosphatase and the progress curve with 3 μM pNPP and 50 nM alkaline phosphatase (squares); its fitted kcat and Km are listed below. kcat and Km were globally fitted to each pair of progress curves in Origin® 7.5 using equations 6a–c as described.
Discussion
The inner filter effect (IFE) is a serious complication to obtaining reliable kinetics from fluorescence when Aex + Aem > 0.08 AU (refer to eq. 2). This typically occurs with 20 μM or more of FRET peptide substrates of proteases (9–11) (Fig. 1). A relatively small pathlength can decrease the absorbance and IFE to a manageable level (Fig. 2). A centrally illuminated 3 × 3 mm square cuvette in standard orientation with faces orthogonal to excitation and emission paths is convenient for many biochemical applications in dilute solution. Acceptably small pathlengths can also be arranged in the modest volumes of a multi-well plate or a thin cuvette placed at an angle to the excitation beam. Consider a cuvette placed with its front face at an angle of 45° to both excitation and emission paths. That introduces unwanted reflected light into the emission monochromator, a clear disadvantage for dilute solution (6). The front-face geometry may, however, be most appropriate for samples with high absorbance or light scattering from turbidity (6). For dilute solution, a better angle for a thin cuvette places its back facing the emission path, thereby avoiding reflection of the excitation beam into the detector (40).
IFE often remains after optimizing sample geometry. We propose two alternative strategies to fluorophore dilution assays for correcting IFE: (i) global fits of initial velocity series that incorporate a factor that models the attenuation by IFE and (ii) global fits of two or three progress curves.
Strategy (i) requires incorporating the IFE correction constant ε′ℓ (eq. 4) into the Michaelis-Menten fitting expression (eq. 5). The number of initial velocity measurements required is comparable to conventional analysis of triplicate points without IFE correction. Strategy (i) requires that each [S0]-dependent curve be measured at three or more enzyme concentrations and be fitted globally. Defining ε′ℓ by measuring εex and εem coefficients conserves expensive FRET substrate. This constant ε′ℓ or el for IFE correction (eq. 4 and 5a) can become an adjustable fitting parameter in global fits of initial velocities. Strategy (i) serves to boost accuracy of the turnover number without adding much, if any, overhead of measurements of initial velocities. Strategy (i) is recommended if progress curves cannot be run until they plateau.
We strongly prefer strategy (ii) for characterizing steady-state kinetics. Strategy (ii) avoids the complication of explicit correction of IFE and of using absorbance or extinction coefficients for such correction. This freedom comes from automatically converting between fluorescence and concentration for each progress curve independently. Strategy (ii) requires only that the concentration of enzyme active sites Et be accurate, a progress curve be run under first order conditions of [S0] ≪ Km to provide specificity constant kcat/Km, and a second progress curve be available at higher but moderate [S]. The higher [S] should be > 25% of Km if Et has been fixed (Table 1) or > 8% of Km if Et is altered by two-fold or more in one progress curve (Table 2). For best accuracy, progress curves should be run to completion of the reaction. Inclusion of a third progress curve is welcome but not required for fitting. Strategy (ii) requires global fitting. We recommend the strategy that we outline, specifying second-order rate constant kcat/Km and using Michaelis-Menten-derived expressions of eq. 6a–c. Alternatively Dynafit (20) is suitable for fitting the progress curves.
These strategies avoid the extra time and substrate expense of fluorophore dilution assays to measure IFE correction factors prior to fitting. The method of globally fitting two or perhaps three progress curves is particularly economical in terms of substrate consumption and measurement time. It is also conceptually simple in its avoidance of any extinction coefficients or absorbance for IFE correction. Fitting progress curves provides simplicity and confidence in the Michaelis-Menten parameters. The decreased measuring time and costs of substrate of strategy (ii) should be especially welcome in highly repetitive assays such as high throughput screening for inhibition, assay of many substrates, or comparison of enzyme variants from mutagenesis or enzyme evolution. These advantages should make measurement of kcat and Km more accessible for greater insight, in spite of IFE.
Supplementary Material
Acknowledgments
This work was supported by DHHS grant R01 GM57289. We are grateful to Prof. M. Henzl for extensive discussion of the source code, validation of assays, and comments on the manuscript. Microcal staff were instrumental in implementing the C++ code for fitting progress curves in Origin® 7.5. We thank Professors D. Emerich and P. Tipton for comments and W. Zahler for detailed comments on the manuscript. M. Palmier receives support from NIH training grant GM008396.
Abbreviations
- ε
molar extinction or absorptivity coefficient
- FRET
Förster Resonance Energy Transfer
- FS-6
a FRET substrate for metalloproteinases
- IFE
inner filter effect
- MMP-12
matrix metalloproteinase-12
- pNPP
p-nitrophenyl phosphate
Footnotes
Publisher's Disclaimer: This is a PDF file of an unedited manuscript that has been accepted for publication. As a service to our customers we are providing this early version of the manuscript. The manuscript will undergo copyediting, typesetting, and review of the resulting proof before it is published in its final citable form. Please note that during the production process errors may be discovered which could affect the content, and all legal disclaimers that apply to the journal pertain.
References
- 1.Förster T. Zwischenmolekulare Energiewanderung und Fluoreszenz. Ann Phys. 1948;2:55–75. [Google Scholar]
- 2.Knight CG. Fluorimetric assays of proteolytic enzymes. Methods Enzymol. 1995;248:18–34. doi: 10.1016/0076-6879(95)48004-8. [DOI] [PubMed] [Google Scholar]
- 3.Taliani M, Bianchi E, Narjes F, Fossatelli M, Urbani A, Steinkuhler C, De Francesco R, Pessi A. A continuous assay of hepatitis C virus protease based on resonance energy transfer depsipeptide substrates. Anal Biochem. 1996;240:60–7. doi: 10.1006/abio.1996.0331. [DOI] [PubMed] [Google Scholar]
- 4.Fields GB. Using fluorogenic peptide substrates to assay matrix metalloproteinases. Methods Mol Biol. 2001;151:495–518. doi: 10.1385/1-59259-046-2:495. [DOI] [PMC free article] [PubMed] [Google Scholar]
- 5.Lombard C, Saulnier J, Wallach J. Assays of matrix metalloproteinases (MMPs) activities: a review. Biochimie. 2005;87:265–72. doi: 10.1016/j.biochi.2005.01.007. [DOI] [PubMed] [Google Scholar]
- 6.Lakowicz JR. Principles of Fluorescence Spectroscopy. Kluwer Academic/Plenum; New York: 1999. [Google Scholar]
- 7.Liu Y, Kati W, Chen CM, Tripathi R, Molla A, Kohlbrenner W. Use of a fluorescence plate reader for measuring kinetic parameters with inner filter effect correction. Anal Biochem. 1999;267:331–5. doi: 10.1006/abio.1998.3014. [DOI] [PubMed] [Google Scholar]
- 8.Matayoshi ED, Wang GT, Krafft GA, Erickson J. Novel fluorogenic substrates for assaying retroviral proteases by resonance energy transfer. Science. 1990;247:954–8. doi: 10.1126/science.2106161. [DOI] [PubMed] [Google Scholar]
- 9.Holskin BP, Bukhtiyarova M, Dunn BM, Baur P, de Chastonay J, Pennington MW. A continuous fluorescence-based assay of human cytomegalovirus protease using a peptide substrate. Anal Biochem. 1995;227:148–55. doi: 10.1006/abio.1995.1264. [DOI] [PubMed] [Google Scholar]
- 10.Geoghegan KF. Improved method for converting an unmodified peptide to an energy-transfer substrate for a proteinase. Bioconjug Chem. 1996;7:385–91. doi: 10.1021/bc960025g. [DOI] [PubMed] [Google Scholar]
- 11.Grahn S, Ullmann D, Jakubke H. Design and synthesis of fluorogenic trypsin peptide substrates based on resonance energy transfer. Anal Biochem. 1998;265:225–31. doi: 10.1006/abio.1998.2902. [DOI] [PubMed] [Google Scholar]
- 12.Subbarao NK, MacDonald RC. Experimental method to correct fluorescence intensities for the inner filter effect. Analyst. 1993;118:913–6. doi: 10.1039/an9931800913. [DOI] [PubMed] [Google Scholar]
- 13.Neumann U, Kubota H, Frei K, Ganu V, Leppert D. Characterization of Mca-Lys-Pro-Leu-Gly-Leu-Dpa-Ala-Arg-NH2, a fluorogenic substrate with increased specificity constants for collagenases and tumor necrosis factor converting enzyme. Anal Biochem. 2004;328:166–73. doi: 10.1016/j.ab.2003.12.035. [DOI] [PubMed] [Google Scholar]
- 14.Kruger RG, Dostal P, McCafferty DG. Development of a high-performance liquid chromatography assay and revision of kinetic parameters for the Staphylococcus aureus sortase transpeptidase SrtA. Anal Biochem. 2004;326:42–8. doi: 10.1016/j.ab.2003.10.023. [DOI] [PubMed] [Google Scholar]
- 15.Clegg RM. Fluorescence resonance energy transfer. Wiley; New York: 1996. [Google Scholar]
- 16.Kubista M, Sjoback R, Eriksson S, Albinsson B. Experimental Correction for the Inner-Filter Effect in Fluorescence Spectra. Analyst. 1994;119:417–419. [Google Scholar]
- 17.Yappert MC, Ingle JD., Jr Correction of Polychromatic Luminescence Signals for Inner-Filter Effects. Applied Spectroscopy. 1989;43:759–767. [Google Scholar]
- 18.Cornish-Bowden A. Estimation of the dissociation constants of enzyme-substrate complexes from steady-state measurements. Interpretation of pH-independence of Km. Biochem J. 1976;153:455–61. doi: 10.1042/bj1530455. [DOI] [PMC free article] [PubMed] [Google Scholar]
- 19.Duggleby RG, Morrison JF. The use of steady-state rate equations to analyse progress curve data. Biochim Biophys Acta. 1979;568:357–62. doi: 10.1016/0005-2744(79)90303-6. [DOI] [PubMed] [Google Scholar]
- 20.Kuzmic P. Program DYNAFIT for the analysis of enzyme kinetic data: application to HIV proteinase. Anal Biochem. 1996;237:260–73. doi: 10.1006/abio.1996.0238. [DOI] [PubMed] [Google Scholar]
- 21.Markus M, Hess B, Ottaway JH, Cornish-Bowden A. The analysis of kinetic data in biochemistry, A critical evaluation of methods. FEBS Lett. 1976;63:225–30. doi: 10.1016/0014-5793(76)80100-7. [DOI] [PubMed] [Google Scholar]
- 22.Duggleby RG, Morrison JF. Progress curve analysis in enzyme kinetics: model discrimination and parameter estimation. Biochim Biophys Acta. 1978;526:398–409. doi: 10.1016/0005-2744(78)90131-6. [DOI] [PubMed] [Google Scholar]
- 23.Shapiro SD, Kobayashi DK, Ley TJ. Cloning and characterization of a unique elastolytic metalloproteinase produced by human alveolar macrophages. J Biol Chem. 1993;268:23824–9. [PubMed] [Google Scholar]
- 24.Fu JY, Lyga A, Shi H, Blue ML, Dixon B, Chen D. Cloning, expression, purification, and characterization of rat MMP-12. Protein Expr Purif. 2001;21:268–74. doi: 10.1006/prep.2000.1376. [DOI] [PubMed] [Google Scholar]
- 25.Arumugam S, Gao G, Patton BL, Semenchenko V, Brew K, Van Doren SR. Increased backbone mobility in b-barrel enhances entropy gain driving binding of N-TIMP-1 to MMP-3. Journal of Molecular Biology. 2003;327:719–734. doi: 10.1016/s0022-2836(03)00180-3. [DOI] [PubMed] [Google Scholar]
- 26.Williams JW, Morrison JF. The kinetics of reversible tight-binding inhibition. Methods Enzymol. 1979;63:437–67. doi: 10.1016/0076-6879(79)63019-7. [DOI] [PubMed] [Google Scholar]
- 27.Grobelny D, Poncz L, Galardy RE. Inhibition of human skin fibroblast collagenase, thermolysin, and Pseudomonas aeruginosa elastase by peptide hydroxamic acids. Biochemistry. 1992;31:7152–4. doi: 10.1021/bi00146a017. [DOI] [PubMed] [Google Scholar]
- 28.Galardy RE, Grobelny D, Foellmer HG, Fernandez LA. Inhibition of angiogenesis by the matrix metalloprotease inhibitor N-[2R-2-(hydroxamidocarbonymethyl)-4-methylpentanoyl)]-L-tryptophan methylamide. Cancer Res. 1994;54:4715–8. [PubMed] [Google Scholar]
- 29.Tan RJ, Fattman CL, Niehouse LM, Tobolewski JM, Hanford LE, Li Q, Monzon FA, Parks WC, Oury TD. Matrix metalloproteinases promote inflammation and fibrosis in asbestos-induced lung injury in mice. Am J Respir Cell Mol Biol. 2006;35:289–97. doi: 10.1165/rcmb.2005-0471OC. [DOI] [PMC free article] [PubMed] [Google Scholar]
- 30.Bertini I, Calderone V, Cosenza M, Fragai M, Lee YM, Luchinat C, Mangani S, Terni B, Turano P. Conformational variability of matrix metalloproteinases: beyond a single 3D structure. Proc Natl Acad Sci U S A. 2005;102:5334–9. doi: 10.1073/pnas.0407106102. [DOI] [PMC free article] [PubMed] [Google Scholar]
- 31.Simopoulos TT, Jencks WP. Alkaline phosphatase is an almost perfect enzyme. Biochemistry. 1994;33:10375–80. doi: 10.1021/bi00200a018. [DOI] [PubMed] [Google Scholar]
- 32.Di Cera E, Bassii FA, Gill SJ. Information theory and the analysis of ligand-binding data. Biophysical Chemistry. 1989;34:19–28. doi: 10.1016/0301-4622(89)80037-7. [DOI] [PubMed] [Google Scholar]
- 33.Balcom JK, Fitch WM. A method for the kinetic analysis of progress curves using horse serum cholinesterase as a model case. J Biol Chem. 1970;245:1637–47. [PubMed] [Google Scholar]
- 34.Duggleby RG, Morrison JF. The analysis of progress curves for enzyme-catalysed reactions by non-linear regression. Biochim Biophys Acta. 1977;481:297–312. doi: 10.1016/0005-2744(77)90264-9. [DOI] [PubMed] [Google Scholar]
- 35.Orsi BA, Tipton KF. Kinetic analysis of progress curves. Methods Enzymol. 1979;63:159–83. doi: 10.1016/0076-6879(79)63010-0. [DOI] [PubMed] [Google Scholar]
- 36.Gutierrez OA, Danielson UH. Sensitivity analysis and error structure of progress curves. Anal Biochem. 2006;358:1–10. doi: 10.1016/j.ab.2006.07.007. [DOI] [PubMed] [Google Scholar]
- 37.Michaelis LM, Maud L. Kinetics of Invertase. Biochemische Zeitschrift. 1913;49:333–369. [Google Scholar]
- 38.Ferscht A. Structure and Mechanism in Protein Science - A Guide to Enzyme Catalysis and Protein Folding. WH Freeman and Company; New York: 2000. [Google Scholar]
- 39.Niedzwiecki L, Teahan J, Harrison RK, Stein RL. Substrate specificity of the human matrix metalloproteinase stromelysin and the development of continuous fluorometric assays. Biochemistry. 1992;31:12618–23. doi: 10.1021/bi00165a011. [DOI] [PubMed] [Google Scholar]
- 40.Itagaki H. Fluorescence Spectroscopy. In: Tanaka T, editor. EXPERIMENTAL METHODS IN POLYMER SCIENCE. Academic Press; 2000. [Google Scholar]
Associated Data
This section collects any data citations, data availability statements, or supplementary materials included in this article.


