

Abstract
Because variability exists within populations of cells, single-cell analysis has become increasingly important for probing complex cellular environments. Capillary electrophoresis (CE) is an excellent technique for identifying and quantifying the contents of single cells owing to its small volume requirements and fast, efficient separations with highly sensitive detection. Recent progress in both whole-cell and subcellular sampling has allowed researchers to study cellular function in the areas of neuroscience, oncology, enzymology, immunology, and gene expression.
Keywords: Single-cell analysis, Cell sampling, Capillary electrophoresis
Introduction
The study of biological organisms often utilizes tissue homogenates or other large cell populations to elucidate the intricacies of biological function. Frequently however, the specimens studied have heterogeneous populations with several types of cells serving varying roles in the system. Consequently, the information obtained from these analyses yields only average values rather than providing precise information about the nature of a cell network as cells communicate and respond to stimuli. To overcome the limitations of working with bulk samples, single-cell analysis has been used to probe the mechanism behind the function of each cell type in a system and to study subcellular events that dictate overall cellular function.
Working with single cells involves the use of small volumes; hence, any technique chosen for analysis must be capable of handling minute sample volumes and must be easily coupled to sensitive detectors. Capillary electrophoresis (CE), requiring volumes of only nanoliters to femtoliters, is thus ideally suited to the analysis of single cells. In addition, CE is capable of sampling from not only entire cells, but also subcellular fractions of cytoplasm or organelles quickly and efficiently. Furthermore, a diverse collection of sensitive detectors have been coupled seamlessly to CE. In recent years, analytes of interest have been detected using laser-induced fluorescence (LIF) [1-6], UV [7, 8], electrochemical [9-12], and mass spectrometric detection [13, 14]. This review presents an overview of current developments in cell sampling methods and recent applications of single-cell CE analysis. Although an exciting area, cell analysis with microfabricated devices is not covered here.
Sampling techniques
Whole-cell sampling
Whole cell sampling for CE typically involves the injection of a single cell suspended in solution or adhered to the surface of a substrate by the application of a potential across the capillary (electrokinetic) or by the generation of pressure differential between the inlet and outlet of the capillary (siphoning). A drag force produced by the flow of fluid in each mechanism drives the cell into the capillary for lysis and separation of its contents [15]. While these two injection schemes are still widely used, this review will focus on recently developed complementary techniques for introducing cells and their contents into capillaries.
Continuous cell introduction
Formerly, single-cell CE was hindered by low throughput as single cells were chosen for analysis under a microscope for injection each time a separation was begun. Chen and Lillard, however, have developed a two-capillary scheme to continuously introduce cells for injection, thereby increasing the throughput and reducing analysis time from 6 to 4 min for each cell [16]. In this setup, the first of the capillaries is immersed a dilute cell suspension solution. Cells are continually pumped single file into this thinner capillary by electroosmotic flow, flowing towards the lysis junction that connects the two capillaries. As cells enter the lysis junction, they are lysed by mechanical disruption then siphoned into the second capillary for separation. The system is capable of repeatedly injecting cells for over 40 min of analysis time before many of the cells descend to the bottom of solution out of reach of the capillary.
Laser cavitation and electrical lysis
The analysis of adherent cells with CE increases the difficulty of sampling, requiring detachment from the growth substrate prior to analysis. However, removing a cell from its substrate disrupts multiple signaling pathways and alters many of the biological processes occurring in the cell, possibly skewing any information obtained [17]. Thus, it is imperative to quickly sample the cell as it is removed from the substrate in order to get the most accurate portrait of what it is happening in the cell. The Allbritton group has developed two techniques, laser cavitation and fast electrical lysis, for sampling substrate-bound cells.
In the laser cavitation scheme, Sims et al. have exploited the production of a shockwave created by a focused, pulsed laser beam [18]. To generate the shockwave, a laser pulse is focused in close proximity to the cell to be analyzed. This pulse is thought to cause localized plasma formation at its focal point, thereby producing a cavitation bubble. The expansion and collapse of this bubble generates a shock wave that disrupts the outer cell membrane. The contents of the cell can subsequently be loaded onto a capillary by either gravity flow or electrophoresis (timing is initiated by the laser pulse) rapidly after lysis, minimizing the time for biological deviation from standard cell function to occur.
Because of the expense and complication involved with using a pulsed laser, the Allbritton group has also developed a fast electrical lysis procedure for single-cell analysis [17, 19]. In this setup, cells are grown onto a gold-coated coverslip prior to analysis. Once a cell is chosen, the tapered gold-coated capillary is positioned above the cell and a voltage pulse applied between the capillary and the coverslip. The applied voltage pulse passes through the cell simultaneously lysing and injecting its contents into the capillary for separation.
Subcellular sampling
As capillaries have become smaller and easier to position, subcellular sampling within single cells has become more widespread. Subcellular sampling allows only the cellular contents of interest to be analyzed, minimizing interference from extracellular components, and offers the possibility to sample specific subcellular compartments. In this manner, the function or dysfunction of different compartments can be investigated, simplifying the information obtained and yielding a more basic understanding of the mechanisms occurring during cellular processes.
Cytoplasmic sampling
Cytoplasmic levels of different chemical species dictate their synthesis, storage, and metabolism within a cell. Therefore, sampling the intracellular fluid can give insight into how and when certain species are utilized. Previously, Olefirowicz and Ewing demonstrated the use of a microinjector with a tip tapered to 8-10 μm o.d. to sample cytoplasm directly from single neurons in the Planorbis corneus [19]. While the use of this microinjector was useful for the large invertebrate cells, the development of a smaller injector was necessary to examine single mammalian cells, which on average are 15 μm in diameter [20]. Recently, Woods and Ewing were able to fabricate microinjectors from 770-nm-i.d., 150-μm-o.d. capillaries, with tips narrowing to 2.5-μm o.d. [11]. In addition to utilizing a smaller injector, electroporation was also employed to create transient pores in the cell membrane. During electroporation, a high voltage is applied to the cell of interest for several microseconds, producing pores of 1-240 nm in diameter [11, 21]. As the voltage is applied, the microinjector is inserted with minimal perturbation to the cell. Following insertion, the same applied voltage used to electroporate is utilized to electrokinetically inject cytoplasm into the capillary. The capillary tip is subsequently removed and separation is carried out.
Optical trapping
In 1998, Chiu et al. first demonstrated the use of optical trapping to maneuver single vesicles from the Aplysia californica into a capillary, where they were then lysed and their contents separated [22]. Since then, optical trapping has also been utilized to manipulate nuclei [23], mitochondria [24, 25], and various other organelles for analysis [26]. The use of optical trapping for the manipulation of organelles provides a noninvasive and sterile means to maneuver organelles in solution. The technique utilizes a single-beam laser diode focused through a high numerical aperture objective onto the desired specimen [22, 27]. The scattering of the light from the beam by the organelle creates a “scattering force,” which is able to push the organelle along the direction of light propagation [28]. Thus, upon trapping, the organelle of interest can easily be translated into the capillary and released for subsequent lysis and separation.
Organelle separations
In studies carried out by the Arriaga group, organelles, particularly acidic organelles and nuclei, have been introduced into capillaries and separated individually. For the analysis of single acidic organelles, such as endosomes and lysosomes, populations of cells were first incubated with fluorescent microspheres. During incubation, the microspheres were endocytosed and transported to these organelles. Cells were then lysed, releasing their contents into the surrounding buffer. The buffer was then centrifuged to obtain the “organelle fraction,” which was resuspended in run buffer prior to siphoning injection [29].
Nuclei have also been sampled from single cells with CE-LIF. Prior to separation, individual nuclei were tagged with a fluorescent nuclear-targeted protein in order to determine their presence with LIF detection. Analyzed cells were chosen based on observed fluorescence with a microscope and siphoned individually into the capillary. Following injection, digitonin was electrokinetically injected and the cell allowed to lyse for several minutes before the cellular components were separated.
Applications
Neuroscience
Some of the earliest single-cell CE applications in neurochemistry were performed on snail neurons with initial cytoplasmic sampling from Planorbis corneus in 1988 [30] and whole-cell injection completed in 1989 where fluorescently labeled amino acids were separated from a single cell of Helix aspersia [31]. Since these initial studies were completed, many improvements have been made in sampling and detection, measuring a variety of different neurotransmitters and related metabolites in single cells with CE. Nitric oxide (NO), for instance, has become a popular neurochemical of interest, since it is responsible for neurotransmission and the regulation of other physiological processes throughout biological systems. Nitrate and nitrite, both products of NO oxidation, have also been investigated, since their presence may be indicative of nitric oxide synthase. CE coupled with UV detection has been used to quantify nitrate and nitrite in cells from the mollusk Pleurobranchaea californica and Aplysia californica [32]. The concentrations of nitrite and nitrate were found to be 2 mM and 12 mM, respectively, with limits of detection in the micromolar range. More recently, however, it has been shown that the arginine/citrulline ratio determined by CE-LIF is a better indicator of nitric oxide activity versus monitoring nitrate levels, which were found to reflect only localized changes in activity [33].
A common fluorophore, 4,5-diaminofluorescien (DAF-2), can be utilized to detect NO in vivo. This fluorophore reacts with N2O3, an intermediate in nitric oxide oxidation, to form the triazole derivative, DAF-2T. Unfortunately, DAF-2 also reacts with dehydroascorbic acid to form a complex with a similar fluorescent emission wavelength as DAF-2T. CE-LIF has been employed such that these two interfering species could be separated and the amount of nitric oxide quantified [2]. In addition, this technique has also been used to monitor the amounts of ascorbic acid and dehydroascorbic acid present in individual cells [2, 34], as these play important roles in cellular metabolism.
The amino acid d-aspartate, found in the central nervous system of both vertebrates and invertebrates, may be responsible for signaling and regulation of various biological systems. Surprisingly, it has been found that the d enantiomer is responsible for signaling rather than the l form which is predominantly found in most proteins. By adding cyclodextrin, the two enantiomers have been separated and individually quantified [35, 36]. Similarly, fluorescently labeled d-glutamate and l-glutamate have been separated using micellar electrokinetic capillary chromatography (MEKC) modified with cyclodextrin from an individual cell of Aplysia [37]. Further, CE enantiomeric separations have also detected a neuropeptide that contains d-tryptophan in a single cell of Aplysia [38], displaying the important role of the d enantiomer of various amino acids for signaling and regulation.
Oncology
Recently, oncology research has scaled down to the singlecell level with studies examining protein expression during varying phases of the cell cycle. The expression of distinctive sets of proteins in different phases dictates what occurs in the cell for that phase. As cancer cells rapidly proliferate, they begin in the G1 phase, where they increase in size and begin producing the proteins necessary for the subsequent phases. Next, the cells progress through the S, G2, and M phases, where DNA is replicated, the cytoskeleton is reorganized, and mitosis occurs, respectively, to produce two offspring cells. By determining what proteins are vital for the progression from phase to phase, it should be possible to develop therapeutic agents to curb proliferation and induce apoptosis of harmful cells.
Hu et al. have developed capillary sieving electrophoresis (CSE) to analyze protein expression in single cancer cells [39]. In CSE, capillaries are coated with linear polyacrylamide, creating a sieving matrix akin to that found in traditional slab gel electrophoresis capable of separating proteins based on molecular weight. This technique was first used for size-based protein analysis in human colon cancer cells [39, 40]. Proteins from single lysed cells were denatured by SDS and subsequently labeled on-column with a fluorogenic dye prior to CSE-LIF. In subsequent studies, protein fingerprints from single cells were generated, detailing what proteins are being expressed during each phase in the cell cycle [40]. To determine the phase, cell suspensions were incubated with a DNA intercalating dye prior to separation. Because each phase has varying amounts of DNA associated with it, image cytometry was utilized to determine phase prior to separation by CSE-LIF. Through these investigations, they were able to discern a large cell-to-cell variation in protein expression, with approximately 40% relative standard deviation across single-cell electropherograms of differently phased cells.
However, because one-dimensional electrophoresis is limited in its ability to adequately resolve the large number of proteins found in a single cell, CSE was combined MEKC to further separate proteins. With this scheme, separated fractions from the first CSE capillary were moved to a second capillary for the subsequent MEKC separation. The movement of separated fractions from the first capillary to the second was repeated for more than 100 transfers over a 3.5-h period [41]. For the bulk of this study, mouse osteoprogenitor cells were analyzed from the parent cell line (MC3T3-E1) as well as those transfected with the human transcription regulator TWIST, which is known to be involved in skeletal development. When analyzing the separations of these cells, it was found that very little variation in protein expression occurred across cells from the parent cell line. As seen in Fig. 1, the protein landscapes for three untransfected cells (a-c) are very similar in appearance. However, the landscape produced from a cell transfected with TWIST (Fig. 1d) displays large increases in fluorescent signals associated with structural protein expression, which correlate to differences in the visual appearance and morphology of transfected versus untransfected cells. The ability of CSE-MEKC analysis to reveal variations in the protein expression of cells exposed to distinct transcription factors shows promise for elucidating which factors are important for each phase of the cell cycle and, thus, yields more insight into the mechanism behind cancer progression.
Fig. 1.
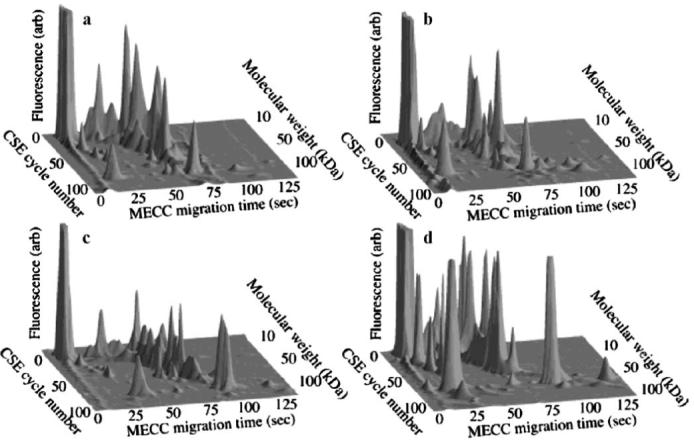
Protein fingerprints generated from single MC3T3-E1 cells shown as landscape images: a-c were produced from untransfected cells; d was produced from a cell transfected with the transcription regulator TWIST. Reproduced from ref. [41] with permission
Enzymology
Because enzyme expression and function varies from cell to cell, understanding the mechanism by which enzymes and substrates interact biologically is also being investigated using single-cell CE. Arkhipov et al., for instance, have examined the function of three enzymes, farnesyltransferase, endoprotease, and methyltransferase, involved in the localization of Ras proteins to the plasma membranes of cells [42]. Because Ras proteins are vital for the regulation of cellular processes such as growth and differentiation, mutated versions are speculated to be involved in the proliferation of cancer cells with 30% of human cancers found to contain Ras oncogenes. Both mouse mammary gland tumor cells and mouse embryo fibroblasts were incubated with a peptide analog of the Ras protein for 24-48 h. Individual cells of both types were subsequently introduced to a capillary by suction and lysed with SDS. Analysis of both cell types with CE-LIF yielded three enzyme products, two found in extracellular media and one intracellularly. Upon comparison of the migration times of these experimental products with those of the known products of the enzymes with the substrate, however, it was found that none of the products seen in the electropherograms correlated to those expected. Though no definite conclusions were made concerning the action of the three enzymes of interest, the method developed was found to work for single cells.
In efforts to repeatedly sample from the same cell, Shoemaker et al. have taken a different approach to studying enzymes in single cells, utilizing nanoliter-scale reaction vessels [3]. The individual placement of single cells in small vessels facilitates the interaction of the cells with substrate-containing lysis solution and creates a small vial from which several aliquots can be removed for analysis. Upon cell lysis, the substrate of interest can react with intracellular enzymes to form the reaction product. Nanoliter-aliquots can then be sampled by CE-LIF over time, yielding information about how the reaction is proceeding. Spodoptera frugiperda cells were used to monitor α-galactosidase activity upon interaction with a disaccharide substrate, αGlc(1→3)αGlc-TMR. The cells were found to be heterogeneous in terms of enzyme function with an average conversion of 20.9±4% after 4.5 h of incubation with the substrate [3]. This heterogeneity in function was attributed to differences in cell age and cell cycle, as well as cell size, since it was found that larger cells had increased enzyme activity [3, 42].
Immunology
Immunological studies investigating antibody-antigen interactions have been performed for years utilizing time-consuming enzyme-linked immunosorbent assays (ELISA). However, the use of single-cell CE has just begun to be employed for the rapid analysis of the reaction of antibodies and target antigens. In one study, human leukemia cells were utilized by Xiao et al. to analyze the role of P-glycoprotein (PGP), a transmembrane efflux pump, in imparting multidrug resistance to tumor cells [4]. Following incubation with two antibodies, JSB-1, a mouseraised antibody that binds to PGP, and GAMIF, an antimouse antibody tagged with FITC, two sets of intact, single cells—those that were drug resistant and those drug sensitive—were analyzed by CE-LIF. Because non-specific binding of JSB-1 to the analyzed cells was found to be minimal and the antibody reacts with the protein epitope on a 1:1 ratio, the amount of the primary antibody detected on a single cell was taken as the total amount of PGP present on the same cell. In this manner, PGP was found to be expressed in a larger quantity on the drug-resistant cell line, with 157,000 molecules of PGP present versus 47,000 molecules present on the drug-sensitive cell line.
In efforts to analyze the content of human interferon-gamma (IFN-γ), which provides anti-viral, anti-cell proliferation, and immunity adjustment effects as support for other cells, Zhang and Jin have developed a method to combine single-cell CE-LIF with intracellular immunoreactions [43]. Initially, the researchers completed an oncapillary immunoreaction, allowing the contents of a lysed cell to interact with fluorescently tagged anti-IFN-γ monoclonal antibody (Ab*) prior to CE-LIF. In this manner, they confirmed that only two forms of IFN-γ, I and II, were present in natural killer (NK) cells. Recently, Zhang and Jin further optimized cell sample preparation, introducing an electroporation step for Ab* loading into a cell suspension prior to analysis [6]. Following electroporation and a short incubation time, washed single cells were electrokinetically injected from the suspension and subsequently lysed by treatment with both digitonin and ultrasonication in the capillary for analysis. Fluorescently labeled antibodies for both IFN-γ I and II were again observed in the single-cell electropherograms. However, the relative fluorescence intensity for each form of the protein-antibody complex increases for the electroporated loaded cells (Fig. 2a). This increase in intensity is attributed to the decrease in Ab* dilution during the intracellular immunoreaction versus the on-capillary reaction. Furthermore, it was also determined that the average value found for the total IFN-γ concentration in natural killer cells (98 pM) agreed well with the value obtained from a standard ELISA assay (99 pM), indicating that the CE technique provides accuracy, while increasing speed of analysis in performing immunoreaction assays [6].
Fig. 2.

Electropherograms detailing IFN-γ-antibody content in NK cells using a on-capillary immunoreaction and b intracellular immunoreaction. Reproduced from ref. [6] with permission
Nucleic acids and gene expression
Despite the inherent heterogeneity in gene expression from cell to cell, monitoring the expression of mRNA in single cells can still provide useful information on disease states and cellular function. CE has been used to detect single-cell reverse-transcriptase polymerase chain reaction (SC-RT-PCR) products [44]. In this study, a single human prostate carcinoma cell was lysed and the lysate mixed with PCR reagents and a primer for the protein β-actin. The PCR products were subsequently combined with ethidium bromide, then separated and detected with CE-LIF. The limits of detection corresponded to approximately 133 initial molecules of β-actin mRNA per nL. In a following report, Yeung developed a microthermocycler for integrated cell lysis and RT-PCR [45]. Although the PCR products of β-actin were measured from a group of 16 cells, the possibility exists that single cells can be analyzed with this integrated system.
Recently, the ability to perform multiplex RT-PCR on single cells with CE has been accomplished [5]. Unlike the previous report by Zabzdyr and Lillard, mRNA corresponding to two proteins, β-actin and estrogen receptor α, were detected simultaneously from single human breast carcinoma cells with CE-LIF. While most work with this technique has been done on mammalian cells, it has also been used to study gene expression in plant cells [46]. Many experiments detecting nucleic acids have used ethidium bromide; however, additional fluorescent probes with higher quantum yields have been employed [8].
In addition to identifying genes in individual cells, there have been a few reports of measuring RNA from single cells using CE without PCR amplification or extraction. In one study [47], single Chinese hamster ovary cells were lysed and rRNA fragments were detected; the total amount of RNA in individual cells was found to be approximately 10-20 pg. It is believed that mRNA (about 3% of the RNA content in a single cell) was not detected because it was unstable under the conditions used in the separation. The possibility for using this technique to study nucleic acid damage was also explored by exposing cells to hydrogen peroxide and monitoring changes in peak patterns of the different nucleic acid fragments.
In another interesting study, the changes in RNA content during cell division in Chinese hamster ovary cells were observed using single-cell CE-LIF [48]. Cells from each phase of the cell cycle (G1, S, G2, and M) were isolated, lysed, and the RNA contents separated. The total RNA content increased after each phase in the cycle, while the rates of RNA synthesis varied between the steps in the cycle.
Conclusions and future directions
In the past two decades, capillary electrophoresis has been applied to single-cell studies in a variety of areas including neuroscience, oncology, enzymology, and gene expression. CE is an excellent tool to study single cells because it can separate solutes quickly and efficiently. Furthermore, a variety of different detectors can be coupled to a CE system, with LIF being the most popular for single-cell studies owing to its high sensitivity. Capillary electrophoresis can provide better clues about levels of molecular species, enzymatic processes, and protein expression occurring in a cell at different time points in the cell life cycle.
Although much progress has been made in this exciting field, there are many future ideas to pursue. For example, taking subcellular analysis one step further, the Chiu group utilizes nanosurgery to specifically choose which subcellular component to study, removing it from the cell using a combination of optical trapping and electroporation [26, 49]. By coupling this technique with CE separations, more types of organelles can be analyzed. Development of other sampling schemes and even more sensitive detectors will further increase the utility of CE for the analysis of single cells.
References
- 1.Gunasekera N, Olson KJ, Musier-Forsyth K, Arriaga EA. Anal Chem. 2004;76:655–662. doi: 10.1021/ac034916a. [DOI] [PubMed] [Google Scholar]
- 2.Kim WS, Ye X, Rubakhin SS, Sweedler JV. Anal Chem. 2006;78:1859–1865. doi: 10.1021/ac051877p. [DOI] [PubMed] [Google Scholar]
- 3.Shoemaker GK, Lorieau J, Lau LH, Gillmor CS, Palcic MM. Anal Chem. 2005;77:3132–3137. doi: 10.1021/ac0481304. [DOI] [PubMed] [Google Scholar]
- 4.Xiao H, Li X, Zou H, Yang L, Yang Y, Wang Y, Wang H, Le XC. Anal Chim Acta. 2006;556:340. [Google Scholar]
- 5.Zabzdyr JL, Lillard SJ. Electrophoresis. 2005;26:137–145. doi: 10.1002/elps.200406126. [DOI] [PubMed] [Google Scholar]
- 6.Zhang H, Jin W. J Chromatogr A. 2006;1104:346–351. doi: 10.1016/j.chroma.2005.11.083. [DOI] [PubMed] [Google Scholar]
- 7.Miao H, Rubakhin SS, Sweedler JV. Anal Bioanal Chem. 2003;377:1007–1013. doi: 10.1007/s00216-003-2191-8. [DOI] [PubMed] [Google Scholar]
- 8.Zabzdyr JL, Lillard SJ. J Chromatogr A. 2001;911:269–276. doi: 10.1016/s0021-9673(00)01189-4. [DOI] [PubMed] [Google Scholar]
- 9.Sun X, Jin W. Anal Chem. 2003;75:6050–6055. doi: 10.1021/ac0349678. [DOI] [PubMed] [Google Scholar]
- 10.Wang W, Han S, Jin W. J Chromatogr B Anal Technol Biomed Life Sci. 2006;831:57–62. doi: 10.1016/j.jchromb.2005.11.022. [DOI] [PubMed] [Google Scholar]
- 11.Woods LA, Gandhi PU, Ewing AG. Anal Chem. 2005;77:1819–1823. doi: 10.1021/ac048589y. [DOI] [PubMed] [Google Scholar]
- 12.Woods LA, Powell PR, Paxon TL, Ewing AG. Electroanalysis. 2005;17:1192–1197. doi: 10.1002/elan.200403240. [DOI] [PMC free article] [PubMed] [Google Scholar]
- 13.Hu S, Le Z, Newitt R, Aebersold R, Kraly JR, Jones M, Dovichi NJ. Anal Chem. 2003;75:3502–3505. doi: 10.1021/ac034154j. [DOI] [PubMed] [Google Scholar]
- 14.Page JS, Rubakhin SS, Sweedler JV. Anal Chem. 2002;74:497–503. doi: 10.1021/ac0156621. [DOI] [PubMed] [Google Scholar]
- 15.Krylov SN, Starke DA, Arriaga EA, Zhang Z, Chan NW, Palcic MM, Dovichi NJ. Anal Chem. 2000;72:872–877. doi: 10.1021/ac991096m. [DOI] [PubMed] [Google Scholar]
- 16.Chen S, Lillard SJ. Anal Chem. 2001;73:111–118. doi: 10.1021/ac0009088. [DOI] [PubMed] [Google Scholar]
- 17.Han F, Wang Y, Sims CE, Bachman M, Chang R, Li GP, Allbritton NL. Anal Chem. 2003;75:3688–3696. doi: 10.1021/ac0341970. [DOI] [PubMed] [Google Scholar]
- 18.Sims CE, Meredith GD, Krasieva TB, Berns MW, Tromberg BJ, Allbritton NL. Anal Chem. 1998;70:4570–4577. doi: 10.1021/ac9802269. [DOI] [PubMed] [Google Scholar]
- 19.Olefirowicz TM, Ewing AG. Anal Chem. 1990;62:1872–1876. doi: 10.1021/ac00216a026. [DOI] [PubMed] [Google Scholar]
- 20.Lu X, Huang W-H, Wang Z-L, Cheng J-K. Anal Chim Acta. 2004;510:127–138. [Google Scholar]
- 21.Karlsson M, Nolkrantz K, Davidson MJ, Stromberg A, Ryttsen F, Akerman B, Orwar O. Anal Chem. 2000;72:5857–5862. doi: 10.1021/ac0003246. [DOI] [PubMed] [Google Scholar]
- 22.Chiu DT, Lillard SJ, Scheller RH, Zare RN, Rodriguez-Cruz SE, Williams ER, Orwar O, Sandberg M, Lundqvist JA. Science. 1998;279:1190–1193. doi: 10.1126/science.279.5354.1190. [DOI] [PubMed] [Google Scholar]
- 23.Liang H, Vu K, Trang TC, Shin D, Lee YE, Nguyen DC, Tromberg B, Berns MW. Lasers Surg Med. 1997;21:159–165. doi: 10.1002/(sici)1096-9101(1997)21:2<159::aid-lsm7>3.0.co;2-p. [DOI] [PubMed] [Google Scholar]
- 24.Fuller KM, Arriaga EA. Curr Opin Biotechnol. 2003;14:35–41. doi: 10.1016/s0958-1669(02)00008-3. [DOI] [PubMed] [Google Scholar]
- 25.He M, Edgar JS, Jeffries GD, Lorenz RM, Shelby JP, Chiu DT. Anal Chem. 2005;77:1539–1544. doi: 10.1021/ac0480850. [DOI] [PubMed] [Google Scholar]
- 26.Shelby JP, Edgar JS, Chiu DT. Photochem Photobiol. 2005:994–1001. doi: 10.1562/2005-02-02-RA-431. [DOI] [PubMed] [Google Scholar]
- 27.Kuyper CL, Chiu DT. Appl Spectrosc. 2002;56:300A–312A. [Google Scholar]
- 28.Block SM. Nature. 1992;360:493–495. doi: 10.1038/360493a0. [DOI] [PubMed] [Google Scholar]
- 29.Fuller KM, Arriaga EA. Anal Chem. 2003;75:2123–2130. doi: 10.1021/ac026476d. [DOI] [PubMed] [Google Scholar]
- 30.Wallingford RA, Ewing AG. Anal Chem. 1988;60:1972–1975. doi: 10.1021/ac00169a027. [DOI] [PubMed] [Google Scholar]
- 31.Kennedy RT, Oates MD, Cooper BR, Nickerson B, Jorgenson JW. Science. 1989;246:57–63. doi: 10.1126/science.2675314. [DOI] [PubMed] [Google Scholar]
- 32.Cruz L, Moroz LL, Gillette R, Sweedler JV. J Neurochem. 1997;69:110–115. doi: 10.1046/j.1471-4159.1997.69010110.x. [DOI] [PubMed] [Google Scholar]
- 33.Moroz LL, Dahlgren RL, Boudko D, Sweedler JV, Lovell P. J Inorg Biochem. 2005;99:929–939. doi: 10.1016/j.jinorgbio.2005.01.013. [DOI] [PubMed] [Google Scholar]
- 34.Kim WS, Dahlgren RL, Moroz LL, Sweedler JV. Anal Chem. 2002;74:5614–5620. doi: 10.1021/ac025917q. [DOI] [PubMed] [Google Scholar]
- 35.Miao H, Rubakhin SS, Sweedler JV. Anal Chem. 2005;77:7190–7194. doi: 10.1021/ac0511694. [DOI] [PubMed] [Google Scholar]
- 36.Miao H, Rubakhin SS, Sweedler JV. J Chromatogr A. 2006;1106:56–60. doi: 10.1016/j.chroma.2005.09.037. [DOI] [PubMed] [Google Scholar]
- 37.Quan Z, Liu YM. Electrophoresis. 2003;24:1092–1096. doi: 10.1002/elps.200390127. [DOI] [PubMed] [Google Scholar]
- 38.Sheeley SA, Miao H, Ewing MA, Rubakhin SS, Sweedler JV. Analyst. 2005;130:1198–1203. doi: 10.1039/b504717j. [DOI] [PubMed] [Google Scholar]
- 39.Hu S, Jiang J, Cook LM, Richards DP, Horlick L, Wong B, Dovichi NJ. Electrophoresis. 2002;23:3136–3142. doi: 10.1002/1522-2683(200209)23:18<3136::AID-ELPS3136>3.0.CO;2-S. [DOI] [PubMed] [Google Scholar]
- 40.Hu S, Le Z, Krylov S, Dovichi NJ. Anal Chem. 2003;75:3495–3501. doi: 10.1021/ac034153r. [DOI] [PubMed] [Google Scholar]
- 41.Hu S, Michels DA, Fazal MA, Ratisoontorn C, Cunningham ML, Dovichi NJ. Anal Chem. 2004;76:4044–4049. doi: 10.1021/ac0498314. [DOI] [PubMed] [Google Scholar]
- 42.Arkhipov SN, Berezovski M, Jitkova J, Krylov SN. Cytometry A. 2005;63:41–47. doi: 10.1002/cyto.a.20100. [DOI] [PubMed] [Google Scholar]
- 43.Zhang H, Jin W. Electrophoresis. 2004;25:1090–1095. doi: 10.1002/elps.200305803. [DOI] [PubMed] [Google Scholar]
- 44.Zabzdyr JL, Lillard SJ. Anal Chem. 2001;73:5771–5775. doi: 10.1021/ac0155714. [DOI] [PubMed] [Google Scholar]
- 45.Matsunaga H, Anazawa T, Yeung ES. Electrophoresis. 2003;24:458–465. doi: 10.1002/elps.200390055. [DOI] [PubMed] [Google Scholar]
- 46.Liu X, Ma L, Zhang JF, Lu YT. J Chromatogr B Anal Technol Biomed Life Sci. 2004;808:241–247. doi: 10.1016/j.jchromb.2004.05.011. [DOI] [PubMed] [Google Scholar]
- 47.Han F, Lillard SJ. Anal Chem. 2000;72:4073–4079. doi: 10.1021/ac000428g. [DOI] [PubMed] [Google Scholar]
- 48.Han F, Lillard SJ. Anal Biochem. 2002;302:136–143. doi: 10.1006/abio.2001.5519. [DOI] [PubMed] [Google Scholar]
- 49.Chiu DT. Trends Anal Chem. 2003;22:528–536. [Google Scholar]