Abstract
Pigeons responded in a concurrent-chains procedure in which terminal-link reinforcer variables were changed unpredictably across sessions. In Experiment 1, the terminal-link schedules were fixed-interval (FI) 8 s and FI 16 s, and the reinforcer magnitudes were 2 s and 4 s. In Experiment 2 the probability of reinforcement (100% or 50%) was varied with immediacy and magnitude. Multiple-regression analyses showed that pigeons' initial-link response allocation was determined by current-session reinforcer variables, similar to previous studies which have varied only immediacy (Grace, Bragason, & McLean, 2003). Sensitivity coefficients were positive and statistically significant for all reinforcer variables in both experiments. Analyses of responding within individual sessions showed that final levels of preference for dominated sessions, in which all reinforcer variables favored the same terminal link, were more extreme than for tradeoff sessions in which at least one reinforcer variable favored each alternative. This result implies that response allocation was determined by multiple reinforcer variables within individual sessions, consistent with the concatenated matching law. However, in Experiment 2, there was a nonlinear (sigmoidal) relationship between response allocation and relative value, which suggests the possibility that reinforcer variables may interact during acquisition, contrary to the matching law.
Keywords: acquisition, concurrent chains, reinforcer immediacy, reinforcer magnitude, reinforcer probability, key peck, pigeons
More than four decades of research on behavioral choice has shown that response allocation in concurrent schedules and concurrent chains schedules is determined by characteristics of the reinforcing stimuli that are contingent on responding, including their rate (Herrnstein, 1961), magnitude (Catania, 1963), immediacy (the reciprocal of delay to reinforcement; Chung & Herrnstein 1967), hedonic quality (Killeen, Cate, & Tran, 1993; Miller, 1976), and probability (Schneider, 1968; Spetch & Dunn, 1987). Most studies have manipulated one reinforcer dimension parametrically and observed the resulting changes in steady-state response allocation, with Herrnstein's demonstration that response allocation was approximately equal to relative reinforcer rate in concurrent schedules—the matching law—being the best-known result. But what happens when the choice alternatives differ on more than one dimension? Baum and Rachlin (1969, p. 870) proposed that organisms allocate time (and, by extension, responses) between two alternatives according to the relative value obtained, such that “the ratio of times allocated [between two activities] equals the ratio of the values of the activities.” They suggested that the simplest possible way of determining value was a multiplicative combination of the relative reinforcer dimensions:
| 1 |
In Equation 1, subscripts L and R refer to left and right alternatives, B is response rate, V is value, and XiL and XiR are the values of ith reinforcer dimension Xi associated with left and right alternatives, respectively. According to Baum and Rachlin's proposal, the matching law applies to the relative value obtained from the alternatives, which is determined by a multiplicative concatenation of reinforcer ratios.
Rachlin (1971) explored the conceptual implications of Baum and Rachlin's (1969) extension of the matching law. Rachlin noted that the equality of response allocation and relative value was an assumption rather than a testable hypothesis and thus the utility of the matching law was that it “circumscribe[d] [the] search for reinforcers in any situation” (p. 251). Killeen (1972) proposed that in its most general form, the theoretical matching law should allow arbitrary transformations of each reinforcer dimension on each alternative. The transformation that has been most useful to date is a power function, which implies that the effects of different reinforcer dimensions are linearly independent in logarithmic terms:
| 2 |
Equation 2 is known as the concatenated generalized matching law (Davison, 1983; Davison & McCarthy, 1988), and is equivalent to the log transformation of Equation 1 except that sensitivities (ai) to each reinforcer dimension need not be equal to 1, and b represents a constant preference for responding to either alternative that is independent of any reinforcer ratio (i.e., bias). Equation 2 is a testable empirical model for choice between two alternatives because it requires that different reinforcer dimensions have additive and independent effects on response allocation.
One application of Equation 2 has been to the study of self-control which refers to choice situations in which alternatives differ in terms of immediacy and magnitude. When offered a choice between a larger, more delayed reinforcer and a smaller, more immediate one, self-control is defined as preference for the former and impulsivity as preference for the latter. Self-control increases as the minimum delay between the choice and reinforcement increases (see Logue, 1998, for a review), consistent with the assumption that the effects of relative immediacy and magnitude on preference are additive and independent, as has been confirmed by a number of studies (Grace 1995; Grace, Bedell, & Nevin, 2002; Logue, Forzano & Tobin, 1992; Rodriguez & Logue, 1986).
Studies in which other pairs of reinforcer dimensions have been manipulated parametrically have generally supported the additivity and independence assumptions of Equation 2. The earliest work supporting a “multiplicative power law” (Hamblin & Miller, 1977; Schneider, 1973; Todorov, 1973) employed concurrent variable-interval (VI) VI (conc VI VI) schedules that varied in reinforcer rate, magnitude, or both. More recently, McLean and Blampied (2001) have confirmed the independence of rate and magnitude in concurrent schedules. They also reported no effect of absolute rate or magnitude on response allocation, which is consistent with Equation 2 but contrary to other research studying the effects of different rates and magnitudes of reinforcers (cf. Alsop & Elliffe, 1988; Davison, 1988; Logue & Chavarro, 1987). Mazur (1988) used an adjusting-delay procedure to determine fixed-delay indifference points for a series of standard schedules that varied in terms of reinforcer magnitude and probability. He found that indifference points increased with the “total reinforcer access ratio” (Neuringer, 1967)—the multiplicative combination of magnitude and probability ratios. Leon and Gallistel (1998) found that rats' time allocation in conc VI VI schedules matched a multiplicative combination of rate and electrical frequency of brain stimulation. Berg and Grace (2004) showed that relative rates of conditioned reinforcement and terminal-link immediacy had additive and independent effects on response allocation in concurrent chains.
Overall, the concatenated matching law provides a good quantitative framework for describing steady-state choice when outcomes can differ in terms of one or more reinforcer dimensions. However, no studies have tested whether the concatenated matching law is valid for choice in transition. Knowing whether the same principles apply to choice under dynamic conditions as well as steady state is essential for developing more comprehensive models of choice behavior.
One approach to studying choice in transition involves presenting subjects with alternatives that change unpredictably across sessions. For example, Schofield and Davison (1997) trained pigeons on conc VI VI schedules in which scheduled reinforcer ratios were either of two reciprocal values (1∶2 and 2∶1, 1∶4 and 4∶1, or 1∶8 and 8∶1, depending on condition) and the location of the richer alternative was determined each session by a 31-step pseudorandom binary sequence. To assess the degree of control exerted by the reinforcer ratio from the current and previous sessions on choice, Schofield and Davison regressed log response and time allocation ratios on obtained log reinforcer ratios from the current session (Lag 0) and nine prior sessions (Lags 1 through 9). They found that after pigeons had been exposed to three presentations of the pseudorandom sequence (i.e., 93 sessions), sensitivity was greatest for Lag 0 ratios and close to zero for all others, suggesting performance was determined by reinforcer ratios in the current session. Grace, Bragason, and McLean (2003) obtained similar results in concurrent chains. In their Experiment 1, the left terminal-link schedule was always fixed-interval (FI) 8 s and the right terminal link was either FI 4 s or FI 16 s, according a 31-step pseudorandom binary series. Multiple-regression analyses showed that after three presentations of the pseudorandom sequence, Lag 0 sensitivity to immediacy coefficients were positive and significant for all subjects, whereas higher-lag coefficients were near zero. Subsequent research confirmed that pigeons' response allocation can track unpredictable changes in immediacy when a different pair of terminal-link schedules was presented in each session (Grace & McLean, 2006).
What might determine response allocation if multiple reinforcer dimensions, for example, immediacy and magnitude, change unpredictably across sessions? One possibility is that the concatenated matching law applies to choice in transition. According to this view, immediacy and magnitude ratios should combine additively and independently to determine reinforcer value, with acquisition of preference during any temporal epoch (e.g., an individual session) resulting from differences in relative value. Another possibility is that only one dimension determines response allocation in a given epoch, but the controlling dimension changes across epochs. For example, subjects' preference might be determined by immediacy in some sessions but magnitude in others. In that case, analysis of data at the molar level (i.e., aggregated across sessions) still might reveal control by both reinforcer dimensions, although the underlying processes would be different.
We describe two experiments in which pigeons responded in a concurrent-chains procedure where the terminal links differed on multiple reinforcer dimensions that changed unpredictably across sessions. In Experiment 1, the terminal links were always FI 8 s and FI 16 s and the reinforcer magnitudes were 4-s and 2-s access to grain. For each session, the assignment of FI schedules and reinforcer magnitudes to the left and right terminal links was determined according to independent random binary sequences. In Experiment 2, reinforcer probability (100% or 50%) was changed across sessions, along with immediacy and magnitude, according to independent random sequences. For both experiments, we planned to determine whether the molar data supported the additivity and independence assumptions of the concatenated matching law. Assuming that the molar data showed control by multiple reinforcer dimensions, we then sought to determine whether responding over more limited temporal epochs was controlled by multiple or single dimensions.
To distinguish between these possibilities, we planned to examine performance during individual sessions and cycles. The critical comparison was between sessions in which both dimensions favored one alternative (described as dominated because the same alternative was the superior on all dimensions), and those in which at least one dimension favored each alternative (tradeoff sessions). If responding is controlled by multiple dimensions, as the concatenated matching law predicts, preference in dominated sessions should be more extreme than preference in tradeoff sessions. However, if only one dimension controlled responding at a time, there should be no systematic difference between preference in dominated and tradeoff sessions.
Experiment 1
Method
Subjects
Four pigeons of mixed breed and sex, numbered 191, 192, 193 and 194, were maintained at 85% ad libitum weight +/− 15 g through appropriate postsession feedings of a grain, chickpea, and cod liver oil mixture. Pigeons were housed individually in a vivarium with a 12-hr∶12-hr light∶dark cycle (lights on at 7 a.m.) with free access to water and grit. All had previous experience with a variety of choice procedures including concurrent chains, but had not previously served in experiments in which terminal-link contingencies changed unpredictably across sessions.
Apparatus
Four standard three-key operant chambers were used, measuring 32 cm deep × 34 cm wide × 34 cm high. The keys were 21 cm above the floor and arranged in a row 10 cm apart. In each chamber there was a houselight located above the center key and a grain magazine with a 5-cm × 5.5-cm aperture that was centered 6 cm above the floor. The houselight provided general illumination at all times except during reinforcer delivery. The magazine contained wheat and was illuminated during reinforcement. A force of approximately 0.15 N was necessary to operate each key. Each chamber was enclosed in a sound-attenuating box, and ventilation and white noise were provided by an attached fan. Experimental events were controlled through a microcomputer and MED-PC® interface located in an adjacent room.
Procedure
Because subjects were experienced, training began immediately in the first condition. With few exceptions, sessions were conducted daily at approximately the same time (11 a.m.).
Sessions ended after 72 initial- and terminal-link cycles (trials) had been completed or 70 minutes, whichever came first. At the start of each trial, the side keys were lighted white to signal the initial links. A terminal-link entry was assigned pseudorandomly to the left or right key, with the constraint that in every block of 12 trials, six entries were assigned to each key. An initial-link response produced a terminal-link entry if: (a) it was made to the preselected key; (b) an interval selected from a VI 10-s schedule had timed out; and (c) a 1-s changeover delay was satisfied, i.e., at least 1 s had elapsed after a changeover to the side to which terminal-link entry was arranged.
The VI 10-s initial-link schedule did not begin until the pigeon first pecked either key. In this way, pausing after completion of the terminal links was excluded from initial-link time. The VI 10-s schedule contained 12 intervals constructed from an exponential progression (Fleshler & Hoffman, 1962). Separate lists were sampled without replacement so that all 12 intervals would be used three times each for the left and right terminal links every session.
Terminal-link entry was signaled by changing the color of the side key that produced the terminal link (left key to red, right key to green for 2 subjects and vice versa for the other two) and darkening the other side key. Terminal-link responding was reinforced with access to grain according to FI schedules. The FI schedule values were always 8 and 16 s. The reinforcer magnitudes were always 2 s and 4 s. Across sessions, the locations of the FI schedules and reinforcer magnitudes were changed according to independent random binary sequences. These sequences were determined by downloading two series of random digits generated1 by a radioactive decay process (retrieved on July 14, 2003 from www.fourmilab.ch/hotbits/).
There were four possible configurations of sessions: both shorter delay (FI 8 s) and larger magnitude (4 s) assigned to the left; both shorter delay and larger magnitude assigned to the right; shorter delay assigned to the left and larger magnitude to the right; and shorter delay assigned to the right, larger magnitude to the left. Thus, a random half of the sessions were dominated, in that both the immediacy and magnitude favored the same side, whereas the other half were tradeoff sessions in which the shorter delay was associated with one alternative and the larger magnitude with the other. In tradeoff sessions, the expected income, or reinforcer access, for each terminal link, calculated as seconds of access to food per terminal-link delay, was the same for both alternatives; that is, 2-s reinforcer magnitude after an 8-s delay and 4-s after a 16-s delay both provided 0.25 s reinforcer access per 1 s of terminal-link delay.
Experiment 1 lasted 93 sessions. Based on visual inspection of plots of sensitivity to immediacy and magnitude across sessions (10- and 20-session equally-weighted moving averages) for each subject, the data included in these analyses are from the last 45 sessions. Owing to an equipment problem, Pigeon 191 failed to complete 28 nonconsecutive sessions, but none of these were during the last 45 sessions. Pigeon 194 did not respond in 3 of the final 45 sessions, and consequently those sessions were replaced with the 46th-, 47th- and 48th-to-last sessions.
Results
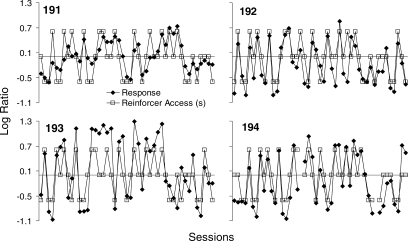
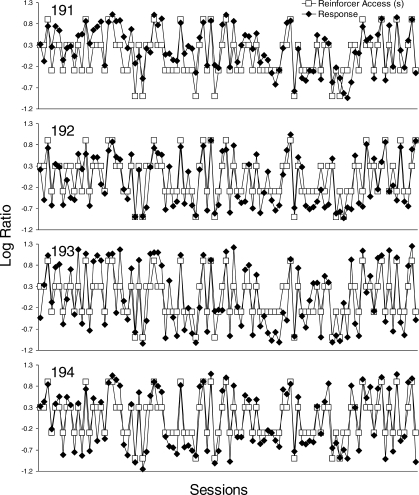
Figure 1 shows the log initial-link response and log terminal-link reinforcer access ratios (left key to right key) for all subjects across the last 45 sessions of Experiment 1. Reinforcer access is the product of reinforcer magnitude and immediacy, and represents duration of access to grain relative to time spent waiting in the terminal link. The log terminal-link reinforcer access ratio is thus computed as log((ML/DL)/(MR/DR)), where M is magnitude, D, delay, and subscripts L and R refer to left and right alternatives, respectively. Log terminal-link reinforcer access ratios were 0.6, 0, and −0.6 for left-dominated, tradeoff, and right-dominated sessions, respectively. Each data point represents performance in a single session. For 3 of 4 pigeons, response allocation tracked the changes in the reinforcer access ratio: Preference for the left alternative generally increased from one session to the next if relative reinforcer access on the left alternative increased, regardless of whether from right-dominated to tradeoff, right-dominated to left-dominated, or tradeoff to left-dominated. Conversely, if the reinforcer access ratio decreased, preference shifted toward the right alternative. The exception was response allocation for Pigeon 193, which generally favored the alternative with the shorter delay to reinforcement.
Fig 1.
Log initial-link response ratios and log terminal-link reinforcer access ratios across the last 45 sessions of Experiment 1. Reinforcer access ratios were calculated as described in the text.
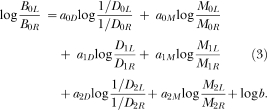
To assess quantitatively the degree of control over response allocation by the immediacy and magnitude ratios from current and prior sessions, we applied a generalized-matching model to the data:
 |
3 |
In Equation 3, B is initial-link responding, D is terminal-link delay to reinforcement, M is reinforcer magnitude, as are sensitivity coefficients, and log b is response bias. The subscripts L and R refer to the left and right alternative, respectively, and numeric subscripts refer to session lag. To limit the complexity of the model, only terms up to Lag 2 were included because previous research generally has found no evidence of significant control by higher lags (Grace, Bragason, & McLean, 2003; Grace & McLean, 2006; Schofield & Davison, 1997).
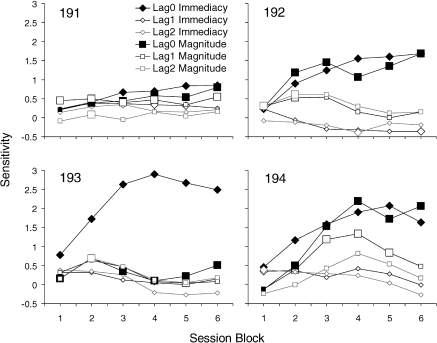
Multiple regressions were used to obtain parameter estimates for Equation 3 for each block of 12 trials within each session for individual subjects. Figure 2 shows the resulting sensitivity coefficients for immediacy and magnitude ratios from the current session (Lag 0) and two previous sessions (Lags 1 and 2). Larger data points indicate coefficients corresponding to terms in the regression that were significantly greater or less than zero (p < .05). For all subjects, Lag 0 sensitivity coefficients for both immediacy and magnitude increased over the course of the session, whereas those for higher lags either did not change systematically or decreased. Lag 0 sensitivity to immediacy was always greater than Lag 0 sensitivity to magnitude for Pigeon 193, but there was little difference for the other subjects. For the second half of the session, average Lag 0 sensitivities to immediacy and magnitude were 1.74 [SD = 0.78] and 0.96 [SD = 0.43], respectively.
Fig 2.
Sensitivity to log immediacy and magnitude ratios for Lag 0 through Lag 2 for each block of 12 trials. Diamond data points represent immediacy ratios and square data points represent magnitude ratios. Larger data points represent statistically significant coefficients.
An important assumption of the concatenated matching law is that the effects of different reinforcer dimensions on log response allocation are additive and independent. Specifically, there should be no interaction between immediacy and magnitude. To test this prediction, we analyzed data from the second half of each session with a model that only included Lag 0 coefficients:
 |
3a |
We first used multiple regression to obtain parameter estimates of Equation 3a for data from the final three blocks of each session (second session half) and then computed the incremental variance accounted for by the addition of the interaction term (i.e., the product of log immediacy and magnitude ratios in the current session). The results, including specific values for a0D, a0M, and log b (the intercept), are shown in Table 1. Equation 3a described the data reasonably well, accounting for an average of 75% of the variance across subjects. The interaction term was significant for Pigeon 192 (B = 1.36, R2inc = .03, p < .05) but not for the remaining subjects.
Table 1.
Results of regressing log response allocation (averaged over the final three blocks of each session) on Lag 0 log immediacy and magnitude ratios from Experiment 1. Sensitivity coefficients for immediacy and magnitude are the unstandardized weights obtained prior to the addition of the interaction term. R2inc refers to the increment in R2 when the interaction value was applied.
| Pigeon | Immediacy | Magnitude | Intercept | R2 | Interaction | R2inc |
| 191 | 0.92*** | 0.46** | 0.00 | 0.62 | −0.66 | 0.02 |
| 192 | 1.52*** | 1.03*** | −0.08 | 0.79 | 1.36* | 0.03 |
| 193 | 2.78*** | 0.34 | 0.22 | 0.79 | −0.48 | 0.00 |
| 194 | 1.93*** | 1.27*** | −0.14 | 0.81 | 0.66 | 0.00 |
* p < 0.05, ** p < 0.01, *** p < 0.001
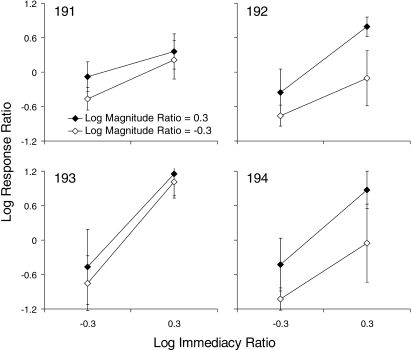
To display the interaction graphically, Figure 3 plots the average log response ratio from the second half of each session for each configuration of immediacy and magnitude ratios for individual subjects. For Pigeons 192 and 194, the relative effect of magnitude was greater when immediacy favored the left alternative than when it favored the right. But the opposite result was obtained for Pigeons 191 and 193: The relative effect of magnitude was greater when immediacy favored the right than when it favored the left. Thus across subjects there was no evidence for a consistent interaction between immediacy and magnitude.
Fig 3.
Mean log response ratio as a function of log immediacy ratio when log magnitude ratio was positive (filled data points) and negative (unfilled). Error bars represent the standard deviation.
Overall, the results in Figures 2 and 3 and Table 1 suggest that effects of relative immediacy and magnitude on response allocation were additive and independent, and that control by both variables increased over the course of the session. However, those results were based on data aggregated across sessions, and so the conclusions may not be representative of individual sessions. If a single reinforcer dimension selected at the beginning of each session determined response allocation, there would be no systematic difference between the final level of preference reached in tradeoff and dominated sessions because the relative values should be equal. By contrast, concatenated generalized matching requires that both reinforcer dimensions determine response allocation in individual sessions, and therefore response allocation should be less extreme in tradeoff compared to dominated sessions.
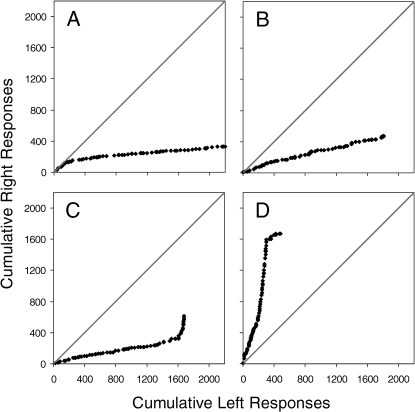
To investigate response allocation within sessions, a reliable measure of pigeons' final, stable response allocation in individual sessions was necessary. To achieve this, we first examined the nature of within-session changes in preference by plotting, for all subjects and sessions, the cumulative number of responses to the right initial link as a function of the cumulative number of responses to the left initial link for each of the 72 trials (cf. Gallistel, Mark, King, & Latham, 2001). The resulting cumulative-response scatterplots could be described in terms of a few general categories. Figure 4 shows representative plots for one subject (Pigeon 194). At the start of the session, response allocation was usually indifferent (see panel A) or favored one alternative (see panels B, C and D). Changes in strength of preference could occur at any point in the session and tended to be abrupt rather than gradual (see panel C, for example). Sometimes response allocation changed multiple times within the session (see panel D).
Fig 4.
Each panel plots the cumulative number of responses made to the right initial link (y) against the cumulative number of responses made to the left initial link (x) during one session. There are 72 points in each panel. Each point represents the cumulative response totals up to and including the current trial. The slope of the function at any point in the scatterplot indicates response allocation. The diagonal line represents indifference, that is, equal responding to the two initial links. The data are from a representative subject (Pigeon 194).
To produce a more systematic analysis of changes in response allocation within individual sessions, we fit linear and bilinear (i.e., ‘broken stick’) models to the cumulative scatterplots like those in Figure 4 for all subjects and sessions. The linear model was defined in terms of two parameters (i.e., y = ax + b); the bi-linear model had four parameters, as it consisted of two linear components. Estimates of parameters were obtained for all sessions and subjects using a nonlinear optimization procedure (Microsoft Excel Solver). F ratios were then calculated to test whether the increased variance accounted for by the bilinear over the linear model was significant (p < .05). If the incremental variance was significant, and visual inspection confirmed there were no additional changes in preference during the session, the session was determined to have a single change point. If the incremental variance was not significant, the session had no change point. According to these criteria, 79.4% of sessions had exactly one change point (see Figure 4, panels A and C), 16.7% had no change points (panel B), and the remaining 3.9% either had more than one visually identifiable change point (panel D) or changed too gradually for a single change point to be identified. Linear and bilinear models accounted for a large percentage of variance, M = .99 [SE = 0.00] and M = .99 [SE = 0.00] for sessions classified as having zero and exactly one change point, respectively.
Next, for sessions with a single change point, we estimated the location of the change through linear interpolation. To illustrate, assume that the x coordinate (i.e., cumulative number of left initial-link responses) of the intersection point of the bilinear function was 113.69, and that the pigeon had made 86 left initial-link responses by the end of the 9th trial and 118 by the end of the 10th trial. The 113.69th response was then estimated to have occurred at 100*(113.69−86)/(118−86) = 86.5% of the way through the 10th trial; thus the change point was estimated as occurring after 9.87 trials.
Table 2 shows mean change points for bilinear sessions for all subjects in both dominated and tradeoff sessions. For all subjects, change points for tradeoff sessions (M = 30.76, SE = 1.85) occurred on average later than those for dominated sessions (M = 23.37, SE = 0.81), t(3) = −3.24, p < .05. This suggests that the acquisition of preference occurred more rapidly in dominated than tradeoff sessions.
Table 2.
Mean location (in number of trials) of the change point for each subject in the dominated and tradeoff sessions that were characterized by a single change point in Experiment 1.
| Pigeon | Dominated Sessions |
Tradeoff Sessions |
||
| Mean | SD | Mean | SD | |
| 191 | 24.08 | 10.08 | 33.29 | 17.34 |
| 192 | 24.90 | 13.25 | 25.46 | 15.43 |
| 193 | 21.11 | 12.30 | 30.91 | 17.69 |
| 194 | 23.38 | 9.28 | 33.37 | 20.27 |
Analyses of cumulative response scatterplots showed that, for all but two sessions of Experiment 1, response allocation within individual sessions could be characterized by zero, one, or multiple change points and that response allocation between change points was stable. This implies that, if all change points in the session occurred prior to the 61st trial, then responding in the last block of 12 trials (i.e., 61 through 72) should provide a good measure of response allocation in an individual session, that is, a measure suitable for comparing dominated and tradeoff sessions. Three sessions that had change points after the 60th trial were excluded from the subsequent analysis, as were the two sessions referred to earlier.
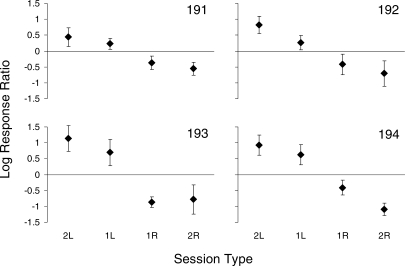
To verify that performance in the final block of sessions was stable, we compared response allocation in the first and second halves of the block (trials 61 to 66 and 67 to 72, respectively). For all subjects, dependent-means t tests confirmed that response allocation did not change systematically over the last 12 trials. Figure 5 shows mean log response ratios from the final block of 12 trials from each session. The sessions were grouped as follows: left-dominated sessions (i.e., the shorter delay and larger magnitude were both associated with the left alternative) in which response allocation favored the left alternative are labeled “2L”. Tradeoff sessions are labeled “1L” and “1R” when response allocation favored the left and right alternatives, respectively. Right-dominated sessions in which response allocation favored the right alternative are labeled “2R”. Pigeon 191 preferred the right alternative for a single left-dominated session; although this could be considered a “0R” session, it was excluded from the analysis. With one exception (for tradeoff sessions where Pigeon 193 preferred the right alternative), mean response allocation in tradeoff sessions was always less extreme than mean response allocation in dominated sessions. This finding is consistent with the generalized matching law and suggests that response allocation in individual sessions is not determined by a single dimension selected stochastically each session.
Fig 5.
For each subject, mean log response ratios are shown from the final block according to session type. Error bars show standard deviation. See text for more details.
However, the intermediate preferences obtained in tradeoff sessions could have resulted from the pigeons responding on the basis of a single reinforcer dimension on a more local timescale than the final block of trials. Specifically, if the controlling dimension changed during the final block, then an intermediate preference could be obtained in tradeoff compared to dominated sessions. Thus we examined performances on individual trials during the final block of each session. If the intermediate preferences in tradeoff sessions resulted from shifts in the controlling dimension (even unsystematic ones), then the relative frequency distribution of choice proportions on single trials should show evidence of bimodality, with modes at either extreme.
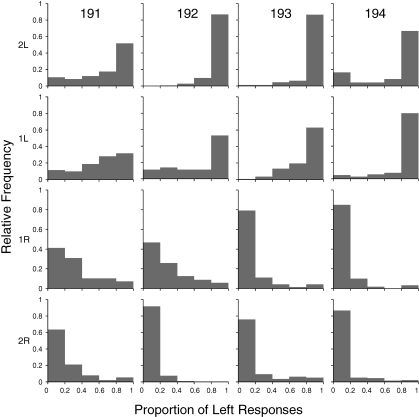
Figure 6 shows relative frequency distributions of choice proportions (rather than log response allocation to avoid division by zero) for individual trials, binned in five intervals of width = .20, for each subject and session type. Distributions appear unimodal with greater variance in tradeoff than dominated sessions. To confirm quantitatively that the observed distributions in tradeoff sessions could not be described by extreme preference on individual trials, we conducted Kolmogorov-Smirnov tests comparing observed distributions to those predicted if the choices on individual trials were constrained to be extreme (i.e., in bins 0.0 to 0.2, and 0.8 to 1.0), but yielded the same overall obtained choice proportion. In all cases, the Kolmogorov-Smirnov tests showed that the obtained distributions were significantly different from those predicted (all p's < .001). This provides evidence that the intermediate preferences in tradeoff sessions were not produced by shifts in the controlling dimension across the last block of trials. Instead, results are consistent with the prediction of the concatenated matching law that response allocation is determined by multiple reinforcer variables.
Fig 6.
Relative frequency distributions of the proportion of left responses from each of the 61st through 72nd trials of all sessions included in Figure 5, for each subject and type of session.
Experiment 2
In Experiment 2, reinforcer probability was changed across sessions, along with immediacy and magnitude, according to independent random sequences as in Experiment 1. We asked several questions: First, would there be evidence for control by all three multiple reinforcer dimensions at the molar level? If so, would performance in individual sessions and cycles reveal control over responding by single or multiple reinforcer dimensions? Finally, we planned to test whether effects of immediacy, magnitude, and probability had additive and independent effects on response allocation, as required by the matching law, or whether there was evidence for an interaction.
Method
Subjects
The 4 pigeons from Experiment 1 served and were maintained under the same conditions.
Apparatus
The apparatus was that described for Experiment 1.
Procedure
The concurrent-chains procedure that was used was the same as in Experiment 1 with the exception that, in addition to immediacy and magnitude, the probability that a terminal link ended in reinforcement was varied across sessions. As in Experiment 1, the terminal-link FI schedule values were 8 s and 16 s, and the reinforcer magnitudes were 2 s and 4 s with the assignment of immediacy and magnitude values determined by independent random binary sequences. In addition, terminal links for one alternative were always reinforced (with a probability of 1.0) whereas terminal links for the other were reinforced with a probability of 0.5. The assignment of reinforcer probability was determined by a third independent random binary sequence. For the 0.5 probability terminal link, the first response after the FI schedule had elapsed produced either reinforcement or a blackout of equivalent duration, as determined by sampling a probability gate with p = .50.
There were eight possible configurations of sessions. Dominated sessions, where the shorter delay (FI 8 s), larger magnitude (4 s) and greater probability of reinforcement (1.0) were all assigned to the left or all to the right, comprised one quarter of all sessions on average. The six other possible session configurations were tradeoff sessions where shorter delay and larger magnitude, shorter delay and greater probability, or larger magnitude and greater probability were assigned to the same key (left or right). The expected reinforcer access for each terminal link in tradeoff sessions, calculated as expected seconds of access to food per terminal-link delay, was greater for the alternative associated with the richer option, that is, the option favored by two out of three dimensions than for the alternative favored by a single dimension only: 0.25 s and 0.125 s reinforcer access per 1 s of terminal-link delay, respectively.
Training in Experiment 2 lasted for 177 sessions and began immediately after the conclusion of Experiment 1. Based on visual inspection of plots of sensitivity to immediacy, magnitude, and probability across sessions (10- and 20- session equally-weighted moving averages) for each subject, the data included in analyses are from the last 100 sessions.
Results
Figure 7 shows the log initial-link response and terminal-link reinforcer access ratios (left key/right key) for all subjects across the last 100 sessions of Experiment 2. In Experiment 2, the log terminal-link reinforcer access ratio is the log ratio of the products of reinforcer magnitude, probability, and immediacy: log((ML*PL/DL)/(MR*PR/DR)). Each data point represents performance in a single session. Overall, changes in response allocation appeared to be stable across the 100 sessions for all subjects. That is, similar to Experiment 1, response allocation for all pigeons generally tracked changes in the reinforcer access ratio: Preference for the left alternative increased from one session to the next if the relative reinforcer access of the left terminal link increased, and decreased if the relative reinforcer access for the left terminal link decreased.
Fig 7.
Log initial-link response ratios and log terminal-link reinforcer access ratios across the last 100 sessions of Experiment 2. Reinforcer access ratios were calculated as described in the text.
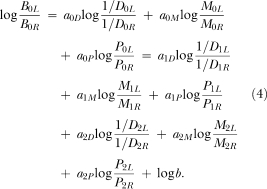
To assess quantitatively the degree of control of the current- and prior-session immediacy, magnitude, and probability ratios on response allocation, we applied a generalized-matching model to the data:
 |
4 |
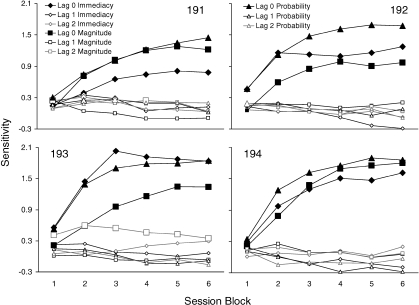
Equation 4 extends Equation 3 to include log probability ratios: P refers to probability, while other variables and subscripts are as in Equation 3. Figure 8 shows Lag 0–2 sensitivity coefficients for immediacy, magnitude, and probability for each block of 12 trials within a session. For all subjects, Lag 0 sensitivities for each reinforcer dimension increased over the course of the session, whereas those for higher lags decreased or remained near zero. There were no systematic differences in Lag 0 sensitivity coefficients by reinforcer dimension; for all subjects, strong control was evidenced by immediacy, magnitude, and probability. Lag 0 coefficients were statistically significant for all blocks for 2 subjects (191 and 194), and all but the first block for the other 2 subjects. There was no systematic control by immediacy, magnitude, or probability ratios from previous sessions. Averaged across subjects, Lag 0 sensitivity to immediacy in the second half of the session was 1.34 [SD = 0.47], Lag 0 sensitivity to magnitude was 1.30 [SD = 0.33], and Lag 0 sensitivity to probability was 1.66 [SD = 0.23].
Fig 8.
Sensitivity to log immediacy, magnitude and probability ratios for Lag 0 through Lag 2 for each block of 12 trials. Diamond data points represent immediacy ratios, square data points represent magnitude ratios, and triangles represent probability ratios. Larger data points represent statistically significant coefficients.
To determine whether the effects of the reinforcer dimensions were additive and independent, we analyzed data from the second half of each session by applying a simplified generalized-matching model to the data:
 |
4a |
To test whether any of the four interactions (that is, products of the values of the coefficients of sensitivity—(a) between immediacy and magnitude ratios, (b) between immediacy and probability ratios, (c) between magnitude and probability ratios, and (d) between immediacy, magnitude and probability ratios)—were significant, we fit Equation 4a to the data from the second half of each session and then computed the incremental variance accounted for by the addition of each interaction term individually. The results are shown in Table 3.
Table 3.
Results of regressing log response allocation (averaged over the final three blocks of each session) on Lag 0 log immediacy, magnitude and probability ratios from Experiment 2. Sensitivity coefficients for immediacy, magnitude and probability are the unstandardized weights obtained prior to the addition of any interaction term. IxM, IxP, MxSP, and IxMxP refer to the interactions and R2inc to the increment in R2 when the interaction value was applied.
| Pigeon | Immediacy | Magnitude | Probability | Intercept | R2 | Interaction |
||
| IXM | R2inc | IXP | ||||||
| 191 | 0.75*** | 1.22*** | 1.31*** | 0.22*** | 0.75 | 0.39 | 0.00 | −0.08 |
| 192 | 1.21*** | 0.99*** | 1.66*** | −0.13** | 0.73 | 0.09 | 0.00 | 0.49 |
| 193 | 1.87*** | 1.32*** | 1.86*** | −0.06 | 0.72 | −0.73 | 0.00 | 0.14 |
| 194 | 1.59*** | 1.76*** | 1.86*** | −0.07 | 0.81 | −0.25 | 0.00 | −0.39 |
| Interaction | ||||
| R2inc | MXP | R2inc | IXMXP | R2inc |
| 0.00 | −0.19 | 0.00 | −2.84* | 0.01 |
| 0.00 | 0.55 | 0.00 | −3.58* | 0.02 |
| 0.00 | 0.74 | 0.00 | −9.82*** | 0.07 |
| 0.00 | 0.11 | 0.00 | 1.03*** | 0.11 |
* p < 0.05, ** p < 0.01, *** p < 0.001
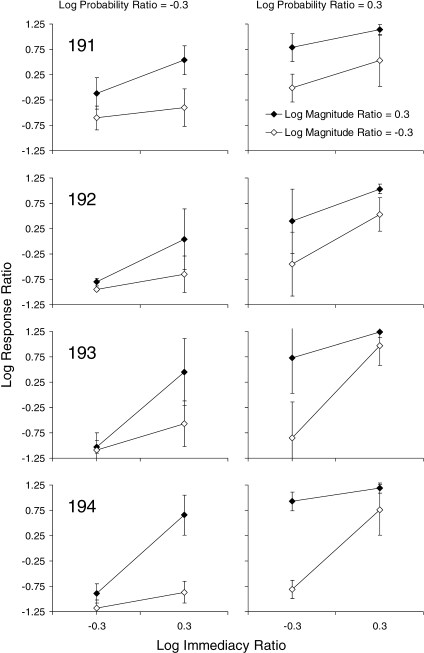
For all subjects, the three-way interaction was statistically significant. Specifically, the relative effect of any one reinforcer dimension was greater when the other two dimensions favored different alternatives than when both favored either the left or the right alternative. Figure 9 plots the average log response ratio from the second half of each session for each combination of immediacy and magnitude ratio when the log probability ratio was negative (left panels) and positive (right panels) for individual subjects. The relative effect of magnitude was greater when the signs of the log immediacy and probability ratios were mixed than when their signs were either both positive or both negative. The distance between filled and unfilled data points in Figure 9 illustrates the effect of magnitude on response allocation. For all subjects, that distance was greater for the two center pairs of data points than the left- and rightmost pairs (when immediacy and probability both favored the right and left alternatives, respectively). None of the two-way interactions were significant.
Fig 9.
Mean log response ratio as a function of log immediacy ratio when log magnitude ratio was positive (filled data points) and negative (unfilled) and when log probability ratio was negative (left panels) and positive (right panels). Error bars represent the standard deviation.
Next we conducted analyses to test whether response allocation was less extreme in tradeoff compared to dominated sessions, as predicted by the concatenated generalized matching law. As in Experiment 1, we examined cumulative response scatterplots for individual sessions, calculated change points based on linear and bilinear models, and compared response allocation in the first and second half of the last block of trials to confirm that log response allocation in the final block would be an appropriate measure of final preference for individual sessions in Experiment 2.
Cumulative response scatterplots were similar to those observed in Experiment 1, that is, changes in preference tended to be abrupt. 86.5% of sessions had exactly one change point, 7.5% had none, 5.25% had more than one visually identifiable change point, and 0.75% (three sessions) changed too gradually for a single change point to be identified. Linear and bilinear models accounted for a high average proportion of variance, M = .99 [SE = 0.00] and M = .99 [SE = 0.00] for sessions classified as having zero and exactly one change point, respectively. Table 4 shows mean change points for bilinear sessions each pigeon. Change points in tradeoff sessions (M = 24.80, SE = 1.07) occurred later on average than change points in dominated sessions (M = 21.38, SE = 1.80), but the result was not statistically significant, t(3) = 1.70, p > .05.
Table 4.
Mean location (in number of trials) of the change point for each subject in the dominated and tradeoff sessions that were characterized by a single change point in Experiment 2.
| Pigeon | Dominated Sessions |
Tradeoff Sessions |
||
| Mean | SD | Mean | SD | |
| 191 | 23.19 | 7.80 | 29.25 | 12.77 |
| 192 | 15.80 | 7.21 | 23.49 | 14.95 |
| 193 | 21.27 | 14.98 | 26.06 | 14.50 |
| 194 | 20.92 | 10.96 | 26.21 | 11.63 |
We excluded nine sessions that had change points after the 60th trial from all subsequent analyses. To verify that performance in the final block of the remaining sessions was stable, we compared response allocation in the first and second half of that block. For all subjects, dependent-means t tests confirmed that response allocation did not change over the last 12 trials. Thus, response allocation was not changing systematically during the final block.
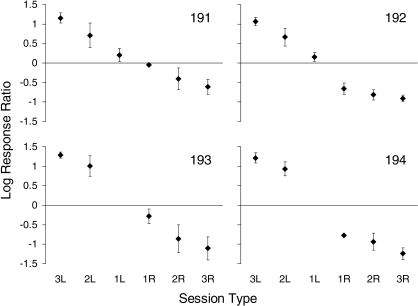
Figure 10 shows mean log response ratios from the final block of trials for sessions grouped according to whether more responses were made to the left or right alternative and the number of reinforcer dimensions that favored that alternative. Left-dominated sessions in which response allocation favored the left alternative are labeled 3L. Tradeoff sessions are labeled 2L or 1L, and 2R or 1R when response allocation favored the left and right alternatives (and, respectively, two or one reinforcer dimensions favored the pigeon's preferred alternative), respectively. Right-dominated sessions in which response allocation favored the right alternative are labeled 3R. Mean response allocation in tradeoff sessions was less extreme than mean response allocation in dominated sessions in all 15 cases, consistent with the possibility that multiple reinforcer dimensions control choice within individual sessions.
Fig 10.
For each subject, mean log response ratios are shown from the final block of trials for each session type. Error bars show standard deviation. See text for more details.
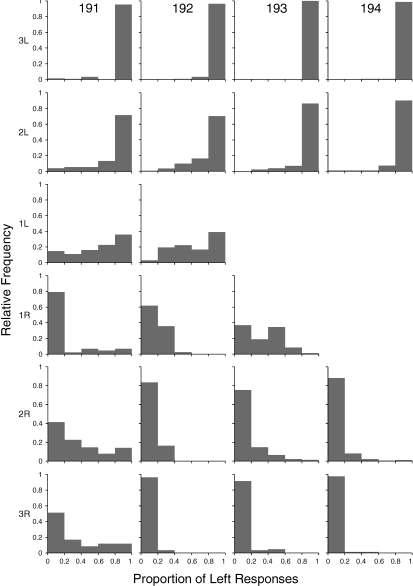
Figure 11 shows relative frequency distributions of choice proportions (rather than log response allocation to avoid division by zero) for individual trials, binned in five intervals of width = .20, for each subject and session type. Distributions appear unimodal with the intermediate levels of preference in tradeoff compared to dominated sessions attributable to greater variability. To confirm quantitatively that the observed distributions of choice proportions in tradeoff sessions could not be described by extreme preference on individual cycles, we conducted Kolmogorov-Smirnov tests comparing observed distributions to those predicted if the choices on individual trials were constrained to be extreme (i.e., in bins 0.0 to 0.2, and 0.8 to 1.0), but yielding the same overall obtained choice proportion. In all cases, the Kolmogorov-Smirnov test showed that the obtained distributions were significantly different from the predicted distributions (all ps < .01). This provides evidence that the intermediate preferences in tradeoff sessions were not produced by shifts in the controlling dimension across the last block of trials. Thus, the intermediate preferences suggest control by multiple reinforcer dimensions within single sessions, as predicted by the concatenated matching law and similar to results from Experiment 1.
Fig 11.
Relative frequency distributions of the proportion of left responses from each of the 61st through 72nd trials of all sessions included in Figure 10, for each subject and type of session.
General Discussion
The first question addressed by the present research was whether pigeons' response allocation in a concurrent-chains procedure in which terminal links differed on multiple reinforcer dimensions that changed unpredictably across sessions (cf. Grace et al., 2003) would show sensitivity to multiple dimensions, similar to findings from steady-state research (e.g., Grace, 1995). Both experiments provided substantial evidence of control by multiple reinforcer dimensions at the molar level. In Experiment 1, multiple regression analyses showed that sensitivities to both log immediacy and magnitude ratios from the current session (i.e., Lag 0) were positive and statistically significant, whereas sensitivities for prior sessions were near-zero and generally nonsignificant, especially by the final blocks of sessions. In Experiment 2, terminal link immediacy, magnitude, and probability of reinforcement were varied across sessions. To our knowledge, this is the first occasion when three reinforcer dimensions have been manipulated simultaneously in research on behavioral choice. Multiple regression analyses of Experiment 2 showed that Lag 0 sensitivities for immediacy, magnitude and probability were positive and statistically significant, whereas those for higher lags were near-zero and nonsignificant. These results extend those of previous studies by demonstrating that pigeons' response allocation in concurrent chains can be controlled by differences in multiple reinforcer dimensions when alternatives change unpredictably across sessions.
Two possible underlying processes that might produce sensitivity to multiple reinforcer dimensions at the molar level were described in the introduction. One is that reinforcer ratios combine additively and independently to determine reinforcer value and response allocation in any temporal epoch, according to the concatenated matching law. Alternatively, a single reinforcer dimension might determine response allocation in a given epoch but the controlling dimension could change across epochs.
To distinguish between these possibilities using the individual session as epoch, it was necessary to examine the level of preference in individual sessions during the final block of trials. To accomplish this, sessions were classified as either dominated—those in which all reinforcer dimensions favored the same alternative— or tradeoff—those in which at least one dimension favored each alternative. Because response allocation virtually always favored the richer alternative in dominated sessions, the critical comparison involved the degree of preference for the left (or right) alternative in left- or right-dominated sessions and that reached in tradeoff sessions when the left or right alternative was favored. If a single reinforcer ratio determined preference in any individual session, preference in dominated sessions should not be more extreme than preference in tradeoff sessions in which the subject favored the same alternative. By contrast, the concatenated matching law predicts that preference should be less extreme in tradeoff sessions. In both experiments, response allocation in tradeoff sessions was generally less extreme than in dominated sessions. Moreover, in Experiment 2, the strength of response allocation for an alternative during tradeoff sessions was positively correlated with the number of dimensions that favored that alternative. These results suggest that multiple dimensions controlled response allocation within individual sessions.
To distinguish between the possibilities using the individual trial as epoch, we inspected distributions of choice proportions calculated over individual trials from the final block of trials for bimodality. If a single reinforcer ratio determined preference in individual trials, choice proportions should always be extreme, and the intermediate levels of preference observed in tradeoff relative to dominated sessions would be produced by different combinations of extreme preference for the left alternative and extreme preference for the right. That is, the distribution of choice proportions should be bimodal. By contrast, if relative value determined preference in individual trials according to the concatenated matching law, the distribution of choice proportions should be unimodal. Distributions were unimodal in both experiments. These results suggest that multiple dimensions controlled choice proportion within individual cycles.
The question of whether multiple or single reinforcer dimensions control responding in a given temporal epoch has parallels in research on human judgment and decision making. One major class of models for judgment and decision making is referred to as “information integration,” because models assume that values on different attributes are combined before a decision is made (Anderson, 1968; Massaro & Friedman, 1990). For example, Anderson (1962) showed that different personality traits combined additively and independently when human participants formed impressions about others based on verbal descriptions. By contrast, heuristic models that assume choice is based on “fast and frugal” strategies (e.g., Gigerenzer & Goldstein, 1996) provide an alternative account of decision making. According to single-cue heuristic strategies, all-or-none decisions can be made on the basis of a single attribute, even though other information may be available. The concatenated matching law is an information integration model because relative value is determined by multiple reinforcer dimensions. The hypothesis that one dimension at a time controls responding shares critical features with single-cue heuristics, namely, that decisions are all-or-none and based on a single attribute, regardless of which alternative has greater utility when all dimensions are considered.
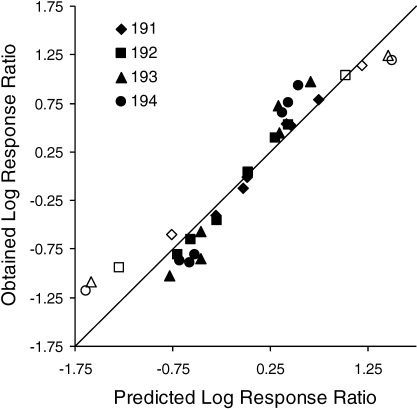
The difference between response allocation during dominated and tradeoff sessions was consistent with the view that subjects were integrating information from multiple reinforcer dimensions within individual sessions. But can this integration process be adequately described by the concatenated generalized matching model? According to the generalized matching model (Equation 4a), effects of different reinforcer dimensions on response allocation should be additive and independent. Contrary to this assumption, there was a significant three-way interaction (immediacy × magnitude × probability) for all subjects in Experiment 2. How is this interaction to be interpreted? Figure 12 shows, for all subjects, the mean obtained log response ratio from the last three blocks of trials within sessions in Experiment 2 for each of the eight session configurations (i.e., immediacy, magnitude, probability favored the left alternative; immediacy and magnitude favored the left alternative while probability favored the right; etc.) as a function of the log response ratio predicted by Equation 4a. Figure 12 shows clearly that the relationship is sigmoidal: Response allocation was less extreme than predicted in dominated sessions (7 out of 8 cases) and more extreme than predicted in tradeoff sessions (23 out of 24). Thus, the three-way interaction in Experiment 2 is consistent with a sigmoidal relationship between relative value (as calculated by Equation 4a) and response allocation.
Fig 12.
Mean log response ratios for the second half of trails in the eight types of sessions from Experiment 2. Values predicted by the concatenated generalized matching law (Equation 4a) are plotted on the x axis and obtained values on the y axis. The unfilled data points represent dominated sessions, the filled tradeoff sessions.
One possible cause of this nonlinearity is a ceiling effect caused by some aspect of the procedure such as the dependent scheduling of terminal links. Dependent scheduling makes each trial within a session essentially a forced choice and could produce a ceiling effect because it places constraints on how extreme response allocation can be if the subject is to complete all cycles in a fixed period of time. Previous research with rapid acquisition concurrent chains has also used dependent scheduling and similarly found evidence of a sigmoidal relationship between response allocation and relative immediacy (Grace et al., 2003; Grace & McLean, 2006; Kyonka & Grace, 2007).
If the sigmoidal relationship is due to a ceiling effect, then data for those pigeons that showed relatively greater range in obtained preference (i.e., the difference between the maximum and minimum log response ratios in Figure 12) should show the greater nonlinearity as well. The reason is this: Results for pigeons with preferences that were relatively more extreme in both directions (thus the greater range) should be more affected by the flattening imposed by the ceiling effect. Results for pigeons with less extreme preferences would be less affected. If so, there should be a positive correlation between degree of nonlinearity and the range of preference. To assess the degree of nonlinearity in Figure 12, we fit a three-parameter logistic function to the data for individual subjects:
| 5 |
where log BL/BR is predicted log response ratio, x is the log response ratio predicted by Equation 4a (the x axis in Figure 12), and c, d and τ are parameters. The degree of nonlinearity was assessed as the improvement in variance explained by Equation 5 over that associated with a two-parameter linear regression. Table 5 shows the resulting parameter estimates, percentages of variance accounted for, and the range of preferences. The improvement in fit by the logistic was negligible for Pigeon 191, small to moderate for Pigeons 192 and 193, and reasonably large for Pigeon 194. The range of preference shift was also greatest for Pigeons 193 and 194. Overall, there was a significant positive correlation between the improvement in variance accounted for by the logistic and range of preference shift, r = 0.99, p < 0.01. This result is consistent with the hypothesis that the sigmoidal relationship in Figure 12 is due to a ceiling effect. If that is the case, the observed nonlinearity is a potential methodological issue rather than a theoretical problem for the concatenated matching law. However, it is important to note that even if a ceiling effect was present and contributed to the nonlinearity, it would not necessarily imply that the ceiling effect was solely responsible for the three-way interaction obtained in Experiment 2. Other sources of nonlinearity might have been present.
Table 5.
Results of fitting a logistic function (Equation 5) to the predicted values in Figure 12. Parameters c, d, and τ were estimated for each subject using a nonlinear optimization procedure. R2 represents the variance accounted for by Equation 5, R2inc represents the improvement in variance accounted for by Equation 5 over a linear model (Equation 4a). Range refers to the degree of shift in preference, that is, to the difference between the mean log response ratio in left-dominated sessions and the mean log response ratio in right-dominated sessions.
| Pigeon | Logistic Parameters |
R2 | R2inc | Range | ||
| d | c | τ | ||||
| 191 | −1.54 | 3.12 | 0.71 | 0.98 | 0.01 | 1.74 |
| 192 | −1.07 | 2.15 | 0.37 | 1.00 | 0.04 | 1.98 |
| 193 | −1.17 | 2.40 | 0.32 | 0.99 | 0.10 | 2.34 |
| 194 | −1.17 | 2.39 | 0.31 | 1.00 | 0.11 | 2.37 |
If the sigmoidal relationship that appears in Figure 12 is not due to a methodological artifact, it disconfirms the concatenated matching law (Equation 4a) as an adequate account of choice between alternatives that differ on multiple reinforcer dimensions. The basic assumptions of the matching law are that effects of different reinforcer dimensions on response allocation are additive and independent, and that the relationship between response allocation and relative reinforcer value is linear (in logarithmic terms) for each dimension. The linearity implies that the relationship between response allocation and relative value is described as a power function for each reinforcer dimension. The results in Figure 12 suggest that these assumptions may not be valid over the full range of reinforcer value.
Grace and McLean (2006) recently proposed a decision model to account for within-session changes of response allocation in concurrent chains. Their model may suggest an alternative explanation for the nonlinearity in Figure 12. According to their model, the strength of responding to one or the other of the initial links increases or decreases after a reinforcer has been received during a terminal link. Whether response strength increases or decreases depends on a comparison of the previous delay to reinforcement in that terminal link with a criterion that represents the delays experienced on both alternatives. The accuracy of these comparisons is determined by a parameter that represented the standard deviation of a log-normal distribution. Grace and McLean showed that, when the standard deviation was relatively large, predicted response allocation was a linear function of the log immediacy ratio, whereas when the standard deviation was relatively small, predicted response allocation was a sigmoidal function of the log immediacy ratio. However, their model was only developed to account for preference between terminal links that differ in reinforcer immediacy and so would need modification to incorporate the effects of reinforcer magnitude and probability.
It is possible to consider laboratory experiments like those in the present study simplified and controlled analogues of situations humans and other animals experience in everyday life. In most choice experiments, a single reinforcer dimension is under scrutiny at any given time, and conditions do not change until the subject's behavior is demonstrably stable. Because humans, pigeons, and other species often face decisions where the available options change from day to day and differ in terms of multiple dimensions, experiments like those reported here are arguably more ecologically valid than research using traditional steady-state procedures.
The present experiments show that pigeons' response allocation can adjust rapidly to frequent simultaneous changes in reinforcer immediacy, magnitude, and probability. It is important to emphasize that regardless of the specific nature of the process whereby response allocation changed within individual sessions, the results of that process, at the molar level, were highly adaptive. The pigeons in Experiment 2 faced an uncertain environment in which sources of reinforcement differed on three dimensions. Their aggregate responding showed that each dimension was weighted about equally in determining preference. Arguably, the pigeons behaved like “intuitive statisticians,” calculating overall value in terms of the contributions from each dimension (cf. Anderson, 1968; Massaro & Friedman, 1990). By manipulating the validity of the dimensions, involving more than two possible ratios for each dimension, or examining choice between more than two alternatives, future research involving the rapid acquisition procedure should further illuminate the process that determines response allocation in concurrent-chains procedures. Whatever the underlying process, our results suggest that multiple dimensions controlled preference in individual temporal epochs.
Acknowledgments
These data were presented at the annual meeting of the New Zealand Association for Behaviour Analysis, Hamilton, September 2006. Address correspondence to Elizabeth G. E. Kyonka or Randolph C. Grace at the University of Canterbury, Department of Psychology, Christchurch, New Zealand. Email: elizabeth.kyonka@pg.canterbury.ac.nz or randolph.grace@canterbury.ac.nz.
Footnotes
The actual 128-step sequences used can be obtained by contacting the authors.
References
- Alsop B, Elliffe D. Concurrent-schedule performance: Effects of relative and overall reinforcer rate. Journal of the Experimental Analysis of Behavior. 1988;49:21–36. doi: 10.1901/jeab.1988.49-21. [DOI] [PMC free article] [PubMed] [Google Scholar]
- Anderson N.H. Application of an additive model to impression formation. Science. 1962;138:817–818. doi: 10.1126/science.138.3542.817. [DOI] [PubMed] [Google Scholar]
- Anderson N.H. A simple model for information integration. In: Abelson R.P, Aronson E, McGuire W.J, Newcomb T.M, Rosenberg M.J, Tannenbaum P.H, editors. Theories of cognitive consistency: A sourcebook. Chicago: Rand McNally and Company; 1968. pp. 731–743. [Google Scholar]
- Baum W.M, Rachlin H.C. Choice as time allocation. Journal of the Experimental Analysis of Behavior. 1969;12:861–874. doi: 10.1901/jeab.1969.12-861. [DOI] [PMC free article] [PubMed] [Google Scholar]
- Berg M.E, Grace R.C. Independence of terminal-link entry rate and immediacy in concurrent chains. Journal of the Experimental Analysis of Behavior. 2004;82:235–251. doi: 10.1901/jeab.2004.82-235. [DOI] [PMC free article] [PubMed] [Google Scholar]
- Catania A.C. Concurrent performances: A baseline for the study of reinforcement magnitude. Journal of the Experimental Analysis of Behavior. 1963;6:299–300. doi: 10.1901/jeab.1963.6-299. [DOI] [PMC free article] [PubMed] [Google Scholar]
- Chung S.-H, Herrnstein R.J. Choice and delay of reinforcement. Journal of the Experimental Analysis of Behavior. 1967;10:67–74. doi: 10.1901/jeab.1967.10-67. [DOI] [PMC free article] [PubMed] [Google Scholar]
- Davison M. Bias and sensitivity to reinforcement in a concurrent-chain schedule. Journal of the Experimental Analysis of Behavior. 1983;40:15–34. doi: 10.1901/jeab.1983.40-15. [DOI] [PMC free article] [PubMed] [Google Scholar]
- Davison M. Concurrent schedules: Interaction of reinforcer frequency and reinforcer duration. Journal of the Experimental Analysis of Behavior. 1988;49:339–349. doi: 10.1901/jeab.1988.49-339. [DOI] [PMC free article] [PubMed] [Google Scholar]
- Davison M, McCarthy D. The matching law: A research review. Hillsdale, NJ: Lawrence Erlbaum Associates; 1988. [Google Scholar]
- Fleshler M, Hoffman H.S. A progression for generating variable-interval schedules. Journal of the Experimental Analysis of Behavior. 1962;5:529–530. doi: 10.1901/jeab.1962.5-529. [DOI] [PMC free article] [PubMed] [Google Scholar]
- Gallistel C.R, Mark T.A, King A.P, Latham P.E. The rat approximates an ideal detector of changes in rates of reward: Implications for the law of effect. Journal of Experimental Psychology: Animal Behavior Processes. 2001;27:354–372. doi: 10.1037//0097-7403.27.4.354. [DOI] [PubMed] [Google Scholar]
- Gigerenzer G, Goldstein D.G. Reasoning the fast and frugal way: Models of bounded rationality. Psychological Review. 1996;103:650–669. doi: 10.1037/0033-295x.103.4.650. [DOI] [PubMed] [Google Scholar]
- Grace R.C. Independence of reinforcement delay and magnitude in concurrent chains. Journal of the Experimental Analysis of Behavior. 1995;63:255–276. doi: 10.1901/jeab.1995.63-255. [DOI] [PMC free article] [PubMed] [Google Scholar]
- Grace R.C, Bedell M.A, Nevin J.A. Preference and resistance to change with constant- and variable-duration terminal links: Independence of reinforcement rate and magnitude. Journal of the Experimental Analysis of Behavior. 2002;77:233–255. doi: 10.1901/jeab.2002.77-233. [DOI] [PMC free article] [PubMed] [Google Scholar]
- Grace R.C, Bragason O, McLean A.P. Rapid acquisition of preference in concurrent chains. Journal of the Experimental Analysis of Behavior. 2003;80:235–252. doi: 10.1901/jeab.2003.80-235. [DOI] [PMC free article] [PubMed] [Google Scholar]
- Grace R.C, McLean A.P. Rapid acquisition in concurrent chains: Evidence for a decision model. Journal of the Experimental Analysis of Behavior. 2006;85:181–202. doi: 10.1901/jeab.2006.72-04. [DOI] [PMC free article] [PubMed] [Google Scholar]
- Hamblin R.L, Miller H.L. Matching as a multivariate power law: Frequency of behavior versus frequency and magnitude of reinforcement. Learning and Motivation. 1977;8:113–125. [Google Scholar]
- Herrnstein R.J. Relative and absolute strength of response as a function of frequency of reinforcement. Journal of the Experimental Analysis of Behavior. 1961;4:267–272. doi: 10.1901/jeab.1961.4-267. [DOI] [PMC free article] [PubMed] [Google Scholar]
- Killeen P. The matching law. Journal of the Experimental Analysis of Behavior. 1972;17:489–495. doi: 10.1901/jeab.1972.17-489. [DOI] [PMC free article] [PubMed] [Google Scholar]
- Killeen P.R, Cate H, Tran T. Scaling pigeons' choice of feeds: Bigger is better. Journal of the Experimental Analysis of Behavior. 1993;60:203–217. doi: 10.1901/jeab.1993.60-203. [DOI] [PMC free article] [PubMed] [Google Scholar]
- Kyonka E.G.E, Grace R.C. Pigeons' choice and timing behavior in a rapid acquisition concurrent-chains procedure. Journal of Experimental Psychology: Animal Behavior Processes. 2007;33:392–408. doi: 10.1037/0097-7403.33.4.392. [DOI] [PubMed] [Google Scholar]
- Leon M.I, Gallistel C.R. Self-stimulating rats combine subjective reward magnitude and subjective reward rate multiplicatively. Journal of Experimental Psychology: Animal Behavior Processes. 1998;24:265–277. doi: 10.1037//0097-7403.24.3.265. [DOI] [PubMed] [Google Scholar]
- Logue A.W. Self-control. In: O'Donohue W.T, editor. Learning and behavior therapy. Needham Heights, MA: Allyn & Bacon; 1998. pp. 252–273. [Google Scholar]
- Logue A.W, Chavarro A. Effect on choice of absolute and relative values of reinforcer delay, amount, and frequency. Journal of Experimental Psychology: Animal Behavior Processes. 1987;13:280–291. [Google Scholar]
- Logue A.W, Forzano L.B, Tobin H. Independence of reinforcer amount and delay: The generalized matching law and self-control in humans. Learning and Motivation. 1992;23:326–342. [Google Scholar]
- Massaro D.W, Friedman D. Models of integration given multiple sources of information. Psychological Review. 1990;97:225–252. doi: 10.1037/0033-295x.97.2.225. [DOI] [PubMed] [Google Scholar]
- Mazur J.E. Choice between small certain and large uncertain reinforcers. Animal Learning & Behavior. 1988;16:199–205. [Google Scholar]
- McLean A.P, Blampied N.M. Sensitivity to relative reinforcer rate in concurrent schedules: Independence from relative and absolute reinforcer duration. Journal of the Experimental Analysis of Behavior. 2001;75:25–42. doi: 10.1901/jeab.2001.75-25. [DOI] [PMC free article] [PubMed] [Google Scholar]
- Miller H.L. Matching-based hedonic scaling in the pigeon. Journal of the Experimental Analysis of Behavior. 1976;26:335–347. doi: 10.1901/jeab.1976.26-335. [DOI] [PMC free article] [PubMed] [Google Scholar]
- Neuringer A.J. Effects of reinforcement magnitude on choice and rate of responding. Journal of the Experimental Analysis of Behavior. 1967;10:417–424. doi: 10.1901/jeab.1967.10-417. [DOI] [PMC free article] [PubMed] [Google Scholar]
- Rachlin H. On the tautology of the matching law. Journal of the Experimental Analysis of Behavior. 1971;15:249–251. doi: 10.1901/jeab.1971.15-249. [DOI] [PMC free article] [PubMed] [Google Scholar]
- Rodriguez M.L, Logue A.W. Independence of the amount and delay ratios in the generalized matching law. Animal Learning & Behavior. 1986;14:29–37. [Google Scholar]
- Schneider J.W. Effects of percentage reinforcement on choice in a concurrent chain schedule. Psychonomic Science. 1968;12:211–212. [Google Scholar]
- Schneider J.W. Reinforcer effectiveness as a function of reinforcer rate and magnitude: A comparison of concurrent performances. Journal of the Experimental Analysis of Behavior. 1973;20:461–471. doi: 10.1901/jeab.1973.20-461. [DOI] [PMC free article] [PubMed] [Google Scholar]
- Schofield G, Davison M. Nonstable concurrent choice in pigeons. Journal of the Experimental Analysis of Behavior. 1997;68:219–232. doi: 10.1901/jeab.1997.68-219. [DOI] [PMC free article] [PubMed] [Google Scholar]
- Spetch M.L, Dunn R. Choice between reliable and unreliable outcomes: Mixed percentage-reinforcement in concurrent chains. Journal of the Experimental Analysis of Behavior. 1987;68:219–232. doi: 10.1901/jeab.1987.47-57. [DOI] [PMC free article] [PubMed] [Google Scholar]
- Todorov J.C. Interaction of frequency and magnitude of reinforcement on concurrent performances. Journal of the Experimental Analysis of Behavior. 1973;19:451–458. doi: 10.1901/jeab.1973.19-451. [DOI] [PMC free article] [PubMed] [Google Scholar]


