

Abstract
The process of experimental determination of protein structure is marred with a high ratio of failures at many stages. With availability of large quantities of data from high-throughput structure determination in structural genomics centers, we can now learn to recognize protein features correlated with failures; thus, we can recognize proteins more likely to succeed and eventually learn how to modify those that are less likely to succeed. Here, we identify several protein features that correlate strongly with successful protein production and crystallization and combine them into a single score that assesses “crystallization feasibility.” The formula derived here was tested with a jackknife procedure and validated on independent benchmark sets. The “crystallization feasibility” score described here is being applied to target selection in the Joint Center for Structural Genomics, and is now contributing to increasing the success rate, lowering the costs, and shortening the time for protein structure determination. Analyses of PDB depositions suggest that very similar features also play a role in non-high-throughput structure determination, suggesting that this crystallization feasibility score would also be of significant interest to structural biology, as well as to molecular and biochemistry laboratories.
Keywords: X-ray crystallography, protein crystallization, protein structure initiative, structural genomics, target selection
Our understanding of the molecular events that define life depends on our ability to map the molecular details of individual proteins and nucleic acids as well as their interactions with each other and with small molecules, such as inhibitors, cofactors, substrates, etc. However, structure determination is often a long and expensive process whereby the target macromolecule must be produced in relatively large quantities and purified in high concentrations. In X-ray crystallography, which is by far the most successful approach to structure determination of macromolecules, the target must be crystallized, and the resulting crystal must diffract to sufficient resolution. In NMR, the protein also has to be produced in large quantities in highly concentrated solutions. Not surprisingly, only a small percentage of initial attempts at structure determination are successful. A failure at any of the many steps leading from selecting a structure target to determining its structure inevitably delays or even stops the process. These factors increase the overall cost of structure determination both in materials and in time. For the Joint Center for Structural Genomics (JCSG), we have estimated that greater than 60% of the overall cost of structure determination efforts can be attributed to failed attempts. Reliable prediction of success or failure for individual targets has so far been unachievable and has made it often necessary to process many targets in order to find the one that will succeed.
One of the unique features of structural genomics efforts is that information on an enormous number of both successful and unsuccessful attempts at structure determination is collected in a single database, TargetDB (Chen et al. 2004), that is available from the Protein Data Bank Web site (http://targetdb.pdb.org/). Some further details are also available from databases in individual PSI centers. In the past, only successful attempts have been documented, making it difficult to precisely identify protein features that are responsible for the failures. If proteins displaying such features could be avoided or modified experimentally, the overall success rate could be increased and the costs of the entire process lowered. This approach is especially pertinent to structural genomics (SG) where often protein families, rather than individual proteins, are targeted, and the number of potential targets in each family that can be selected for evaluation is usually large. Selection of targets with the highest chance of success in structure determination would then maximize the output of SG centers, and may also be of interest to other laboratories.
The connection between protein physicochemical features and crystallization success in SG has been already investigated by several groups. In 2000, Christendat and coworkers analyzed preliminary results from a SG project that focused on the thermophilic archeon Methanobacterium thermoautothrophicum and proposed a decision tree to predict solubility from protein sequence (Christendat et al. 2000). This analysis lead to the development of SPINE, which was defined as “an integrated tracking database and data mining approach for identifying feasible targets in high-throughput structural proteomics” (Bertone et al. 2001). These early studies focused mostly on protein production, as insufficient data of sufficient quality were available on protein crystallization. However, a large and unbiased data set was accumulated from processing the entire proteome of Thermotoga maritima through a structural genomics pipeline, as described by Lesley and coworkers (2002). Based on these data, the JCSG team proposed several types and ranges of protein physicochemical parameters that correlated with crystallization success rates (Canaves et al. 2004). The key features identified in this study were isoelectric point, sequence length, average hydropathy, low-complexity regions, and the presence of signal peptides and transmembrane helices. In 2003, Rodrigues and Hubbard (2003) also analyzed similar protein characteristics, such as the presence of transmembrane helices, low-complexity regions, and coiled-coil regions in the context of a project on Plasmodium falciparum. Gernstein's group further identified other novel protein features that influence the feasibility of selecting a target protein for a high-throughput structure determination approach, such as sequence conservation across many organisms, the percentage of charged residues, and the number of protein binding partners (Goh et al. 2004). The Center for Eukaryotic Structural Genomics used disorder prediction algorithms from the PONDR family (Romero et al. 2001) to analyze the impact of intrinsic protein disorder on crystallization efficiency (Oldfield et al. 2005). The Berkeley Structural Genomics Center utilized several protein features, such as length, predicted transmembrane helices, coiled coils, and low-complexity regions to eliminate targets predicted to be intractable for high-throughput study (Chandonia et al. 2006). Recently, a novel machine-learning approach to the prediction of protein crystallizability was proposed by the Frishman group (Smialowski et al. 2006). This was the first study that proposed an algorithm that calculates a single estimate of the probability of protein crystallization. Overton and Barton (2006) proposed a normalized scale (called the OB-Score) for SG target ranking based on the protein hydrophobicity and the isoelectric point. Comparison of OB-Score results with the scores developed in this paper is presented in the following sections.
With that background, the analysis presented here represents a significant advancement over previous studies in that we use different methodology, different sets of protein features, and a much larger, updated learning set derived from TargetDB and from PDB (Berman et al. 2000). It is also the first study that has been directly applied to the target selection of a large SG center, the Joint Center for Structural Genomics, which is one of the four production centers of the NIH-funded Protein Structure Initiative.
Although many individual steps occur in protein structure determination, essentially these fall into two key processes: protein production and protein crystallization. The term “protein production” is used here to cover the process starting from DNA cloning and ending with a purified protein, including protein expression and purification. Because of variation in processing methods and reporting methods between various SG centers, these steps were grouped together. The term “protein crystallization,” as used here, covers all steps from initial, coarse crystallization screens to fine screening to obtain (or not) the diffracting crystal. Using learning sets extracted from TargetDB, we examined distributions of probabilities of success for protein production and protein crystallization and used combinations of these probability distributions to predict the chance of success for these processes. We further showed that, by using these parameters, new targets can be selected with significantly higher success rates.
Materials and Methods
Sequences of targets from SG centers were collected from TargetDB (Chen et al. 2004) and sorted into groups depending on the success of the structure determination attempts. While success is easy to document, it is much more difficult to determine if lack of success resulted from an actual failure of the process or resulted from abandonment of a target due to changing priorities or other nonexperimental determinants. Only a relatively small group of targets could be convincingly classified as confirmed failures using the TargetDB data. Successfully produced targets and confirmed protein production failures then formed the production learning set. Successfully crystallized targets and confirmed crystallization failures formed the crystallization learning set.
Learning sets for protein production and protein crystallization
All data used in the learning sets were extracted from the October 2005 version of TargetDB. Proteins shorter than 50 residues and proteins longer than 700 residues were excluded from the learning sets since there were insufficient proteins of these sizes to allow for meaningful analysis.
Protein production learning set
The positive subset of the learning set for protein production statistics contained 12,850 targets listed as purified in TargetDB in October 2005.
The negative subset of this learning set contained two groups of targets:
All stopped targets that were listed as cloned, but not purified;
all targets that were cloned, but not purified, and did not show any further progress after 18 mo.
A total of 13,587 targets were included in this subset.
Protein crystallization learning set
In order to avoid ambiguities in the definitions of good and poor crystals, we included only fully determined structures in the positive subset since solved structures are the ultimate measure of success for the SG pipelines. A total of 1503 protein structures determined by X-ray crystallography and deposited in the PDB by all SG centers are included in the positive subset. As before, finding straightforward criteria for the negative subset are far less obvious since, in many cases, “stopped” targets were not failures, but were stopped for other reasons. In defining the criteria for the selection of the negative set we used our experience in how the targets that failed in our (JCSG) production were reported in TargetDB, we have also informally consulted other PSI centers. As a result, we used two subsets of proteins in the negative subset:
All stopped targets listed as purified, but not crystallized, and not assigned to NMR;
all targets that were purified >18 mo before October 2005, and were not crystallized, and not assigned to NMR, and did not show any progress since then.
A total of 2456 proteins were included in the negative subset.
Our goal was to create the most accurate learning sets possible; therefore, many groups of targets were not included in either set to avoid possible contamination. For instance, 4076 targets that were purified but not stopped, not crystallized, and not assigned to NMR were not included in the learning set because it was not clear whether they failed in crystallization or were still being processed. Although not including these proteins significantly decreased our negative subset, we decided to err on the side of caution and not “contaminate” the negative subset with proteins that could have all of the features present in the positive set.
A total of 2945 targets were crystallized, but not deposited in the PDB. We did not include these targets in the positive set because it was not obvious whether the quality of these crystals allowed structure determination.
A total of 12,141 targets were stopped before they entered crystallization trials (targets that were not purified), and 380 targets were stopped after crystallization.
Independent benchmark sets
Since the selection of the learning sets was originally carried out at the end of 2005, it was possible to construct independent benchmark sets from new SG targets processed in 2006 and 2007. All benchmark data were extracted in the same way as for the original learning sets. The only exception was a negative subset of the protein production set. It was reduced to one-third in order to keep roughly the same proportion of positive and negative subsets, as observed in the learning set. The protein production benchmark set contains 9165 positive and 11,726 negative samples. The protein crystallization benchmark set contains 1637 positive and 3365 negative samples.
Calculating probability distributions
Several parameters describing each protein sequence were calculated for all target proteins in the production and crystallization learning sets. All parameters, which were included in the analysis, are described in Table 1. The populated range for each parameter was split into bins, and targets from the learning set were assigned according to the value of the parameter. The success rate was calculated for each bin as the ratio of the number of targets from the positive set falling into this bin compared to the total number of targets assigned to the same bin. The bins of variable size were used in order to eliminate large random fluctuations in the regions with a small number of targets. In order to reduce effects of the uneven distribution of targets within bins, the final sequence parameter value associated with each bin was an average value of this parameter from all targets assigned to this bin (instead of the central point of the bin). The final probability distributions used in the calculations of feasibility scores described below were obtained by linear interpolation between these points.
Table 1.
Protein features considered in obtaining protein production and crystallization feasibility scores

Probability distributions of successful protein production as a function of several different protein features are shown in Figure 1. Analogous distributions for protein crystallization are shown in Figure 2. Only the distributions for which we observed significant and systematic differences in probability are included in the figures. The only exception is a number of predicted transmembrane helices. The negative subset of the protein production learning set contains 1462 targets with at least one predicted transmembrane helix, while the positive subset contains 394 such targets. Thus, the production success rate for such targets was around 21%. In the case of the crystallization learning set, this proportion was 86 negative to 10 positive targets; thus, the success rate was around 10%. Since in both learning sets the number of targets with predicted transmembrane helices was too small to derive probability distributions, and transmembrane helices are obviously detrimental to protein solubility, we assigned all targets with predicted transmembrane helices to the lowest feasibility classes for protein production and crystallization. Because of the small number of such targets in the learning and test sets, the impact of using this criterion on our results was relatively small.
Figure 1.

Observed distributions of successes and failures and calculated probabilities of successful protein production for (A) sequence length, (B) isoelectric point for short and long proteins, and (C) gravy hydrophobicity index. The number of successfully produced proteins in each bin are shown as black bars, and the number of proteins that failed in the production process are shown as gray bars (i.e., they are associated with the left vertical axis). The probability of protein production calculated as the fraction of successfully produced proteins for all proteins from the same bin is shown as a continuous line (i.e., it is associated with the right vertical axis).
Figure 2.

Observed distributions of successes and failures and calculated probabilities of protein crystallization for (A) sequence length, (B) isoelectric point for short and long proteins, (C) gravy hydrophobicity index, (D) length of the longest disordered region, (E) protein instability index, (F) predicted content of coil structure, (G) predicted content of coiled-coil structures, and (H) insertions. The number of crystallized proteins in each bin are shown as black bars, and the number of proteins that failed to crystallize are shown as gray bars (i.e., they are associated with the left vertical axis). The probability of protein crystallization calculated as the fraction of successfully crystallized proteins for all proteins from a given bin is shown as a continuous line (i.e., it is associated with the right vertical axis).
Protein features that significantly influenced protein production or crystallization probabilities
Protein parameters that were tested for correlation with protein production and crystallization success rates are listed in Table 1. Parameters for which actual correlation with the success rate in either the production or the crystallization stage was found are identified by P or X, respectively, in Table 1.
Crystallization and production feasibility scores
The probability distributions described in the previous paragraph were calculated for all protein sequence features listed and marked as useful in Table 1. We assumed that the final probability of success depends on the balance between all “positive” and “negative” features. The problem of combining probability distributions is known in the field of Risk and Experts Analysis. We used a method called logarithmic opinion pool (Genest et al. 1984) that estimates the final probability as a product of individual distributions:
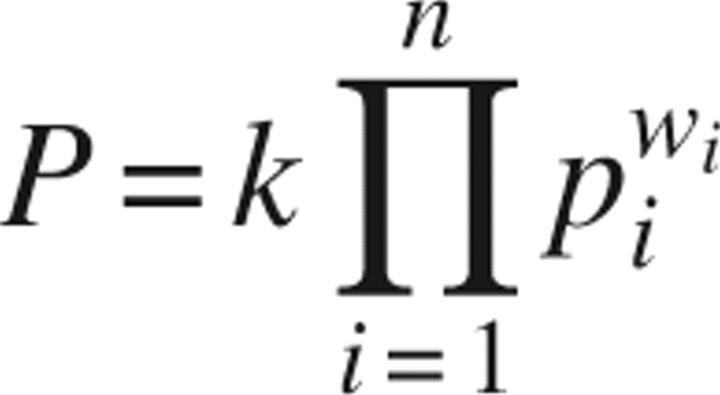 |
where k is the normalizing constant (we used k = 1); pi is the individual probability distributions, such as P length, P pI, P GRAVY, etc.; n is the number of individual probability distributions; wi is the weight of a probability distribution (we used all weights = 1/n, since the size of the learning sets did not allow optimization of individual weights).
The logarithmic opinion pool method ensures that, if any individual probability (e.g., P GRAVY) is very low, then the total probability will also be low. This feature of the logarithmic opinion pool makes it suitable for estimating production or crystallization probability where one property (e.g., extreme pI or gravy index) of a protein may make its production or crystallization very difficult. In other simple methods of aggregating probabilities, such as the linear opinion pool method, where the final estimate is the sum of individual probabilities, the impact of individual probabilities is much smaller.
At this point, there are not enough data to analyze a more complex interplay of multiple protein features on protein production or crystallization. The only exception was the isoelectric point since, for this feature, we observed significant differences for production and crystallization probability distributions between short and long proteins. Thus, probability distributions related to the isoelectric point were calculated separately for targets shorter than 345 residues and for proteins longer than this threshold.
Testing of protein production and crystallization feasibility scores on the learning set
The protein production and protein crystallization feasibility scores were calculated for all targets from their respective learning sets. The targets were rank-ordered by the score and placed into five bins, each representing 20% of the total targets. The average observed success rate was calculated for each bin as a percentage of successfully produced or crystallized targets. The observed success rates of protein production are shown in Figure 3, and success rates for protein crystallization are shown in Figure 4. In both cases, the results are compared to those obtained using OB-Score, a single protein production and crystallizability score developed by the Barton group (University of Dundee, Scotland, UK).
Figure 3.

(A) Success rate distributions of protein production for targets rank-ordered by production feasibility score S p = (P length * P pI * P GRAVY * P tm)1/4. Results of two jackknife tests applied to S p feasibility score are also shown. S ps is a success rate distribution obtained when S p feasibility score was based on the data from four large PSI centers (JCSG, MCSG, NESG, and NYSGXRC) and used to rank-order targets from all other centers (BSGC, BCGI, CESG, ISFI, OPPF, S2F, SECSG, SGPP, SPINE-EU, YSG, TB, and RSGI). For S pl distribution, the targets from the four large PSI centers were rank-ordered using S p feasibility score derived from the data from all other centers. The benchmark result, based on targets processed after our original analysis, is shown as S pb. Because tested sets have different average success rates (from 44%–51%), the normalized plot is shown as an inset. Production probability distribution obtained for OB-Score is shown for comparison (dotted line). (B) Distribution of targets into feasibility classes and observed numbers of successes and failures in protein production.
Figure 4.

(A) Probability distributions of protein crystallization when targets were sorted by crystallization feasibility score S c = (P length * P pI * P GRAVY * P ldiso * P II * P coils * P cc * P tm * P ins)1/9. Results of two jackknife tests applied to S c feasibility score are also shown. S cs is a success rate distribution obtained when S c feasibility score was based on the data from four large PSI centers (JCSG, MCSG, NESG, and NYSGXRC) and used to rank-order targets from all other centers (BSGC, BCGI, CESG, ISFI, OPPF, S2F, SECSG, SGPP, SPINE-EU, YSG, TB, and RSGI). For S cl distribution, the targets from the four large PSI centers were rank-ordered using S c feasibility score derived from the data from all other centers. The benchmark result based on targets processed after our original analysis is shown as S cb. Because tested sets have different average success rates (from 33%–41%), the normalized plot is also shown. Crystallization probability distribution obtained for OB-Score is shown for comparison (dotted line). (B) Distribution of targets into feasibility classes and observed successes and failures in protein crystallization.
Jackknife tests
As the proposed scoring scheme described above is very simple, overfitting of parameters is very unlikely. There is, however, a question of whether a feasibility score derived from the data coming from certain SG centers can be used to estimate the likelihood of success for targets from other centers. If probability distributions were completely different for different centers, then the score would have no predictive value.
We tested production and crystallization feasibility scores with a jackknife procedure designed to answer the above question. The targets in both learning sets were divided into two groups, each corresponding roughly to 50% of the targets:
A. From the four big PSI centers (TargetDB acronyms JCSG, MCSG, NESG, and NYSGXRC);
B. from all other centers (TargetDB acronyms BSGC, BCGI, CESG, ISFI, OPPF, S2F, SECSG, SGPP, SPINE-EU, YSG, TB, and RSGI).
The jackknife tests were performed as follows: First, only the data from group A were used to calculate probability distributions used in the feasibility score, and only the targets from group B were ranked and used for success-rate calculation. In the second test, these two groups were swapped: i.e., targets from group B were used to derive the feasibility score, and targets from group A were ranked. The results of jackknife tests for protein production and crystallization feasibility scores were compared with the original results when all targets from learning sets were used both for score preparation and for testing (see Figs. 3, 4).
Independent benchmark tests
We used probability distributions calculated on the learning sets to calculate feasibility scores for the targets from the benchmark sets consisting of targets that entered SG pipelines after the original learning set was derived (as described in the previous section). The results were compared with the results obtained for learning sets and for jackknife tests (see Figs. 3, 4).
Results
Probabilities of successful protein production as a function of different protein features
The distributions of probabilities of successful protein production were significantly different from random for three protein features: sequence length, isoelectric point, and gravy hydropathy index (see Fig. 1).
Testing of protein production feasibility score on the learning set in jackknife tests and on the independent benchmark set
The protein production feasibility score was tested by examining the distribution of success rates for targets sorted by this score. The targets were rank-ordered according to the feasibility score, and observed success rates were plotted. Success rate distribution for targets ranked by the previously developed OB-Score is shown for comparison (see Fig. 3). Analogous plots prepared for results of jackknife and independent benchmark test procedures are close to the plot obtained for the full set, indicating that observed tendencies are quite general (see Fig. 3). Because benchmark and jackknife test sets have different overall success rates, normalized distribution plots are shown in the inset.
For illustration purposes, one can define production feasibility categories corresponding to subsets of targets ranked according to feasibility score. For example, SG centers successfully produced 62% of targets with a production feasibility score within the top 20%. On the other hand, only 28% of targets with a production feasibility score within the bottom 20% were successfully produced.
Crystallization probability distributions as a function of different protein features
The protein crystallization learning set was used to plot and examine distribution of protein crystallization probability for several protein features. Eight of these features gave nontrivial distributions of crystallization probability (see Table 1; Fig. 2). These were sequence length, isoelectric point, gravy hydropathy index, number of residues in the longest disordered region as predicted by DISOPRED2, protein instability index, percentage of the coil structure as predicted by PSIPRED, number of residues in the coiled-coil structure as predicted by COILS, and the percentage of insertions in the sequence when aligned with its homologues.
Testing of protein crystallization feasibility score on the learning set in jackknife tests and on the independent benchmark set
The targets from protein crystallization sets were sorted by the crystallization feasibility score, and observed success rates were plotted. Again, success rate distribution obtained for OB-Score was added for comparison (see Fig. 4).
Jackknife and benchmark test procedures yielded distributions similar to those obtained for the full crystallization learning set of targets, indicating that observed tendencies are general (see Fig. 4). Because benchmark and jackknife test sets have different overall success rates, normalized distribution plots are also given. From comparison of Figures 3 and 4, it clear that while OB-Score was relatively successful in predicting protein production success, it essentially failed for the protein crystallization stage. As we show here, protein features important for protein production are a subset of features influencing protein crystallization, and a single OB-Score appears to be dominated by the statistics from protein production.
Again, one can use the crystallization feasibility score to assign targets to crystallization classes corresponding to subsets of targets ranked according to each scoring method. For example, SG centers successfully crystallized 57% of targets with a crystallization feasibility score in the top 20% and only 10% of targets with a crystallization feasibility score in the bottom 20%.
Complementary character of X-ray crystallography and NMR in protein structure determination
We calculated the crystallization feasibility score for 2799 structural genomics targets deposited in the PDB that were solved via X-ray crystallography and for 1203 targets that were solved via NMR. The distributions of these targets between crystallization feasibility classes are shown in Figure 5A.
Figure 5.

(A) Distributions of structural genomics structures determined via X-ray crystallography and via NMR between crystallization classes. (B) Distribution of structures solved via X-ray crystallography between crystallization classes in TargetDB and in PDB.
The comparison of distributions of targets solved by X-ray crystallography and NMR between crystallization classes strongly confirms the complementary character of X-ray and NMR methods of protein structure determination as described previously (Yee et al. 2005).
The distribution of proteins between crystallization classes in the entire TargetDB and in the PDB
In order to determine whether our feasibility score applies to protein structures determined by traditional (non-SG) structural biology laboratories, we calculated the distribution between crystallization classes for all X-ray structures deposited in the PDB and compared it to the distribution obtained only for X-ray structures from the TargetDB (see Fig. 5B). The structures of viral and eukaryotic proteins were excluded from this set since, in most cases, they can only be crystallized as large complexes. The distributions of crystallization feasibility classes obtained for proteins from PDB and from TargetDB are, indeed, quite similar, and confirm the universal nature of the tendencies and observations described above.
Discussion
In this paper, we have shown that success and failure in protein structure determination are strongly correlated with particular protein features. While some of these tendencies have been observed previously, the enormous amount of data from SG centers have allowed us to perform large-scale analyses to derive a quantitative feasibility score, which is extraordinarily useful in evaluating and selecting new targets for structure determination. We have also shown that even though the data used for the analysis here was derived from Structural Genomics centers, the same trends are seen in data from standard structural biology labs.
The analysis presented here confirms that medium sequence length and hydrophobicity, combined with acidic character, increase the chance of success in protein production. It is not surprising that shorter proteins are favored over longer proteins and that very short, very long, or very hydrophobic proteins are more difficult to produce in standard experimental setups. The probability distribution obtained for predicted isoelectric points is more interesting, as it seems that current high-throughput protein production systems significantly favor moderately acidic proteins. Since many protein families include homologs with a wide range of isoelectric point values, this observation may help in selecting optimal targets from individual families. In principle, the isoelectric point of a protein can also be changed by protein engineering techniques, and this direction could be worth exploring.
Successful crystallization is also more likely for slightly acidic proteins of medium lengths and hydrophobicity gravy indexes around 0; however, optimal ranges for these features are narrower than observed for protein production. As expected, predicted structural disorder, presence of transmembrane helices, instability, and high content of predicted loops, insertions, and coiled-coil structures correlate with lower probability of crystallization.
These diverse features are related to different obstacles in protein crystallization. For instance, very long proteins usually comprise several structural domains and, therefore, are often flexible as a whole, which may hinder the construction of repetitive, well-ordered crystal lattices. Very short proteins often do not fold into well-defined structures unless they are cross-linked with disulphide bridges or stabilized with metal-binding sites. A high content of structural disorder is obviously unfavorable since it makes establishment of repetitive crystal interactions very unlikely and, in extreme cases, may indicate a complete lack of a well-defined structure. In contrast, this feature does not have significant impact on protein production. (Predicted protein disorder was not included in the previously developed OB-Score, and this is probably the most important reason of its lower ability to differentiate between crystallization classes.) In a similar fashion, a high content of predicted coil structure probably indicates high structural flexibility. Perhaps more surprisingly, a very low content of predicted coil structure also negatively correlates with protein crystallization. The possible explanation here is that secondary structure predictions for very long and continuous α-helices or β-strands may indicate a lack of typical globular structure. Secondary structure prediction that lacks such a recognizable pattern may indicate that the protein is not globular. Finally, the high percentage of insertions that correspond to flexible regions of a protein surface may prohibit creation of stable, repetitive interactions in the crystal lattice. The negative correlation between the length of a predicted coiled-coil structure and protein crystallization can be explained by the nonglobular character of these elements and strong interactions between them.
Crystallization probability distributions for protein hydropathy index and predicted isoelectric point are more interesting. Apparently, there is a well-defined crystallization optimum for protein hydrophobicity around a gravy index value of 0.1. This can be rationalized by arguing that very hydrophobic proteins would tend to aggregate and interactions between very hydrophilic proteins may be too weak to build a stable crystallographic lattice or that very hydrophilic proteins may completely lack stable structure. The distribution of crystallization success rate as a function of a predicted isoelectric point also shows well-defined optima for short (fewer than 345 residues) as well as for long (at least 345 residues) proteins. Neutral and slightly acidic proteins are favored, and extreme values of pI are strongly disfavored. One can hypothesize that strong, nonspecific, and repulsive interactions between highly charged proteins may obstruct crystal nucleation. Construct design or adjustment of crystallization conditions may provide a solution.
A preliminary version of this analysis was performed in late 2005 at JCSG and applied to target selection at JCSG from early 2006. Selection of optimal targets from targeted protein families allowed us to effectively speed up structural mapping of such families and contributed to fast growth of production in SG centers.
The analysis described in this paper and derived feasibility score are most useful in the context of structural genomics efforts where protein families rather than individual proteins are targets for structure determination, but in many cases determining a homologous structure from a more feasible class may also be worth considering for traditional crystallographic laboratories. Moreover, since feasibility profiles observed here affect all the structures determined by X-ray crystallography, they also provide useful hints for construct design in cases where the structure of a specific protein or protein domain is of interest. At JCSG, we observed cases when targets could be modified by construct optimization to improve the feasibility score and eventually lead to successful structure determination; however, large-scale analysis of such cases is still impossible due to insufficient data.
Unprecedented amount and type of data collected by Structural Genomics centers should, in principle, allow us to perform even more interesting analyses, such as optimizing crystallization conditions depending on physicochemical characteristics of the protein, suggesting mutations that would enhance structure determination successes and many others. Unfortunately, more effort on data standardization and exchange protocols is necessary before all of the existing data will be available for analysis. Such efforts are currently underway in our center and in all other PSI centers; therefore, we can expect such analyses in the near future.
The algorithm described here is now publicly available as a Web server at http://ffas.burnham.org/XtalPred; the server will be the subject of a separate publication.
Acknowledgments
This work is supported by the NIH Protein Structure Initiative Grants U54 GM074898 (JCSG) and P20 GM076221 (JCMM) from the National Institute of General Medical Sciences (www.nigms.nih.gov).
Footnotes
Reprint requests to: Adam Godzik, Burnham Institute for Medical Research, 10901 North Torrey Pines Road, La Jolla, CA 92037, USA; e-mail: adam@burnham.org; fax (858) 795-5249.
Article and publication are at http://www.proteinscience.org/cgi/doi/10.1110/ps.073037907.
References
- Bendtsen J.D., Nielsen, H., von Heijne, G., and Brunak, S. 2004. Improved prediction of signal peptides: SignalP 3.0. J. Mol. Biol. 340: 783–795. [DOI] [PubMed] [Google Scholar]
- Berman H.M., Westbrook, J., Feng, Z., Gilliland, G., Bhat, T.N., Weissig, H., Shindyalov, I.N., and Bourne, P.E. 2000. The Protein Data Bank. Nucleic Acids Res. 28: 235–242. [DOI] [PMC free article] [PubMed] [Google Scholar]
- Bertone P., Kluger, Y., Lan, N., Zheng, D., Christendat, D., Yee, A., Edwards, A.M., Arrowsmith, C.H., Montelione, G.T., and Gerstein, M. 2001. SPINE: An integrated tracking database and data mining approach for identifying feasible targets in high-throughput structural proteomics. Nucleic Acids Res. 29: 2884–2898. [DOI] [PMC free article] [PubMed] [Google Scholar]
- Canaves J.M., Page, R., Wilson, I.A., and Stevens, R.C. 2004. Protein biophysical properties that correlate with crystallization success in Thermotoga maritima: Maximum clustering strategy for structural genomics. J. Mol. Biol. 344: 977–991. [DOI] [PubMed] [Google Scholar]
- Chandonia J.M., Kim, S.H., and Brenner, S.E. 2006. Target selection and deselection at the Berkeley Structural Genomics Center. Proteins 62: 356–370. [DOI] [PubMed] [Google Scholar]
- Chen L., Oughtred, R., Berman, H.M., and Westbrook, J. 2004. TargetDB: A target registration database for structural genomics projects. Bioinformatics 20: 2860–2862. [DOI] [PubMed] [Google Scholar]
- Christendat D., Yee, A., Dharamsi, A., Kluger, Y., Savchenko, A., Cort, J.R., Booth, V., Mackereth, C.D., Saridakis, V., Ekiel, I., et al. 2000. Structural proteomics of an archaeon. Nat. Struct. Biol. 7: 903–909. [DOI] [PubMed] [Google Scholar]
- Creighton T.E. 1984. Proteins: Structures and molecular properties. W.H. Freeman, New York.
- Genest C., Weerahandi, S., and Zidek, J.V. 1984. Aggregating opinions through logarithmic pooling. Theory Decis. 17: 61–70. [Google Scholar]
- Goh C.S., Lan, N., Douglas, S.M., Wu, B., Echols, N., Smith, A., Milburn, D., Montelione, G.T., Zhao, H., and Gerstein, M. 2004. Mining the structural genomics pipeline: Identification of protein properties that affect high-throughput experimental analysis. J. Mol. Biol. 336: 115–130. [DOI] [PubMed] [Google Scholar]
- Guruprasad K., Reddy, B.V., and Pandit, M.W. 1990. Correlation between stability of a protein and its dipeptide composition: A novel approach for predicting in vivo stability of a protein from its primary sequence. Protein Eng. 4: 155–161. [DOI] [PubMed] [Google Scholar]
- Jones D.T. 1999. Protein secondary structure prediction based on position-specific scoring matrices. J. Mol. Biol. 292: 195–202. [DOI] [PubMed] [Google Scholar]
- Krogh A., Larsson, B., von Heijne, G., and Sonnhammer, E.L. 2001. Predicting transmembrane protein topology with a hidden Markov model: Application to complete genomes. J. Mol. Biol. 305: 567–580. [DOI] [PubMed] [Google Scholar]
- Kyte J. and Doolittle, R.F. 1982. A simple method for displaying the hydropathic character of a protein. J. Mol. Biol. 157: 105–132. [DOI] [PubMed] [Google Scholar]
- Lesley S.A., Kuhn, P., Godzik, A., Deacon, A.M., Mathews, I., Kreusch, A., Spraggon, G., Klock, H.E., McMullan, D., Shin, T., et al. 2002. Structural genomics of the Thermotoga maritima proteome implemented in a high-throughput structure determination pipeline. Proc. Natl. Acad. Sci. 99: 11664–11669. [DOI] [PMC free article] [PubMed] [Google Scholar]
- Lupas A., Van Dyke, M., and Stock, J. 1991. Predicting coiled coils from protein sequences. Science 252: 1162–1164. [DOI] [PubMed] [Google Scholar]
- Oldfield C.J., Ulrich, E.L., Cheng, Y., Dunker, A.K., and Markley, J.L. 2005. Addressing the intrinsic disorder bottleneck in structural proteomics. Proteins 59: 444–453. [DOI] [PubMed] [Google Scholar]
- Overton I.M. and Barton, G.J. 2006. A normalised scale for structural genomics target ranking: The OB-Score. FEBS Lett. 580: 4005–4009. [DOI] [PubMed] [Google Scholar]
- Rodrigues A. and Hubbard, R.E. 2003. Making decisions for structural genomics. Brief. Bioinform. 4: 150–167. [DOI] [PubMed] [Google Scholar]
- Romero P., Obradovic, Z., Li, X., Garner, E.C., Brown, C.J., and Dunker, A.K. 2001. Sequence complexity of disordered protein. Proteins 42: 38–48. [DOI] [PubMed] [Google Scholar]
- Smialowski P., Schmidt, T., Cox, J., Kirschner, A., and Frishman, D. 2006. Will my protein crystallize? A sequence-based predictor. Proteins 62: 343–355. [DOI] [PubMed] [Google Scholar]
- Ward J.J., Sodhi, J.S., McGuffin, L.J., Buxton, B.F., and Jones, D.T. 2004. Prediction and functional analysis of native disorder in proteins from the three kingdoms of life. J. Mol. Biol. 337: 635–645. [DOI] [PubMed] [Google Scholar]
- Wootton J.C. 1994. Non-globular domains in protein sequences: Automated segmentation using complexity measures. Comput. Chem. 18: 269–285. [DOI] [PubMed] [Google Scholar]
- Yee A.A., Savchenko, A., Ignachenko, A., Lukin, J., Xu, X., Skarina, T., Evdokimova, E., Liu, C.S., Semesi, A., Guido, V., et al. 2005. NMR and X-ray crystallography, complementary tools in structural proteomics of small proteins. J. Am. Chem. Soc. 127: 16512–16517. [DOI] [PubMed] [Google Scholar]