

Abstract
Regulatory T cells (Tregs) fulfill a central role in immune regulation. We reported previously that the integrin αEβ7 discriminates distinct subsets of murine CD4+ regulatory T cells. Use of this marker has now helped to unravel a fundamental dichotomy among regulatory T cells. αE −CD25+ cells expressed L-selectin and CCR7, enabling recirculation through lymphoid tissues. In contrast, αE-positive subsets (CD25+ and CD25−) displayed an effector/memory phenotype expressing high levels of E/P-selectin–binding ligands, multiple adhesion molecules as well as receptors for inflammatory chemokines, allowing efficient migration into inflamed sites. Accordingly, αE-expressing cells were found to be the most potent suppressors of inflammatory processes in disease models such as antigen-induced arthritis.
Keywords: CD103, CD25, lymphocyte migration, chemokines, inflammation
Introduction
A large body of recent data demonstrates that CD4+ regulatory T cells (Tregs) are important in the maintenance of immunological homeostasis and self-tolerance (for review see reference 1). Although a universal master switch for generation and function of Tregs was apparently found recently with the identification of Foxp3 (2), the origin of various types of Tregs is currently unclear. CD25+CD4+ Tregs appear to be generated as a unique lineage of T cells within the thymus, as in adult day 3 thymectomized animals the development of multi-organ autoimmunity is correlated with a reduced number of CD25+CD4+ Tregs in peripheral lymphoid tissues (3). Moreover, a suppressive capacity was demonstrated for the CD25+ subset of CD4+CD8− thymocytes (4, 5). In TCR-transgenic systems, high frequencies of CD25+CD4+ Tregs were only found if the model antigen was expressed within the thymus (6, 7). This suggests that self-reactive Tregs are generated during normal T cell development within the thymus. On the other hand, peripheral induction of suppressive CD4+ T cells from naive T cells has also been reported. Antigen-specific CD25+CD4+ T cells generated upon antigen exposure under tolerogenic conditions were functionally indistinguishable in several assays from endogenous CD25+CD4+ T cells (8, 9) and have been shown to play a role in transplantation tolerance (10). The concept of “natural” and “adaptive” regulators proposed recently (11) addresses the diversity of Tregs with respect to function and development.
Where Tregs act and how they migrate in vivo has hardly been studied so far. The capacity of Tregs to suppress activation and proliferation of naive T cells (12) suggests that they act in a lymphoid environment. Accordingly, L-selectin, which is required for entry into lymph nodes, has been found on the majority of CD25+ Tregs (13, 14). Other papers report the presence of receptors for inflammatory chemokines (CCR2, CCR4, CCR5, and CCR8) and increased levels of adhesion molecules (CD54 and LFA-1) on regulatory subsets (5, 13, 15, 16), suggesting that these cells are able to enter inflamed tissues and might act directly at sites of inflammation (17). However, a comprehensive analysis on trafficking properties of Tregs in vivo is still lacking.
We and others have identified the integrin αEβ7 as a marker for highly potent regulatory CD4+ T cells isolated from murine secondary lymphoid organs (18–20). The integrin not only subdivides the “classical” regulatory CD25+ compartment into two subsets (αE −CD25+ and αE +CD25+) but also identifies unique CD25− suppressor T cells (αE +CD25−) with characteristic properties (18).
In the present work, by analyzing adhesion molecule and chemokine receptor expression as well as migration under homeostatic and inflammatory conditions, we show that the αE/CD25-defined subsets display distinct homing properties: CD25 single positive cells (αE −CD25+) preferentially recirculate through lymph nodes, whereas αE-positive CD4+ T cells represent inflammation-seeking Tregs. The functional importance of the aforementioned diversity is underlined by the unique immunosuppressive capacity of αE-positive regulators in models of acute and chronic inflammation. Thus, the findings of this paper define differences in developmental stage, trafficking properties, and functional activity among suppressors, which provide a conclusive framework for understanding how specialized subsets of Tregs might fulfill divergent tasks in homeostasis and control of ongoing immune reactions.
Materials and Methods
Mice.
Female Balb/c and C57Bl6 mice were bred in the Bundesinstitut für Risikobewertung in Berlin, Germany or purchased from Charles River and used at 6–12 wk of age. All animal experiments were performed under specific pathogen-free conditions and in accordance with institutional, state, and federal guidelines.
Antibodies, Staining and Sorting Reagents.
The following antibodies were produced in our laboratory: anti–FcR II/III (2.4G2), anti-CD3 (145.2C11), anti-CD28 (37.51), FITC- and Cy5-labeled anti-CD4 (GK1.5), FITC-labeled anti–CD4-F(ab) (GK1.5), biotinylated anti-αE (M290), and biotinylated anti–αE-F(ab)2 (M290). The anti–αE-Ab–producing hybridoma was provided by P. Kilshaw (The Babraham Institute, Cambridge, UK). The recombinant P-selectin– and E-selectin–human IgG fusion proteins were provided by D. Vestweber (University Muenster, Muenster, Germany) and PE-labeled anti–inducible costimulator (ICOS) antibody (MIC-280) by R. Kroczek (Robert Koch Institute, Berlin, Germany). PE- and Cy5-labeled anti–human IgG antibodies were obtained from Jackson ImmunoResearch Laboratories. The following antibodies and secondary reagents were purchased from BD Biosciences: anti-CD4 (RM4–5), anti-CD8α (Ly-2), anti-CD25 (7D4), anti-CD25 (PC61), anti-CD29 (Ha2/5), anti-CD44 (IM7), anti-CD45RB (16A), anti-CD54 (3E2), anti–L-selectin (Mel-14), anti-CD69 (H1.2F3), anti-α4β7 (DAKT32), anti-CD11a (2D7), streptavidin (SA), and appropriate isotype controls. All microbeads were obtained from Miltenyi Biotec.
Sorting of Treg Subsets.
T cell subsets were isolated from spleen and peripheral and mesenteric lymph nodes of Balb/c mice. Erythrocyte-depleted cell suspensions were stained with anti–CD25-FITC and biotinylated anti-αE followed by PE-labeled SA. All stained cells were isolated using anti-PE and anti-FITC microbeads and the AutoMACS magnetic separation system (Miltenyi Biotec). Subsequently, CD4+ subsets were separated according to αE and CD25 expression with FACS® (DIVA; BD Biosciences). All sorted subsets were >90–95% pure on reanalysis (Fig. S1 A available at http://www.jem.org/cgi/content/full/jem.20031562/DC1).
DNA Microarray Hybridization and Analysis.
Total RNA was purified from 2 × 10⁶ sorted cells and applied for DNA microarray analysis as described in supplemental Materials and Methods.
Real-Time Quantitative RT-PCR Assay.
Real-time quantitative RT-PCR for Foxp3 and chemokine receptors was performed as described in supplemental Materials and Methods.
Quantification of TRECs by Real-Time PCR.
High molecular weight DNA was extracted from the encoded samples of sorted T cells from Balb/c mice using the QIAamp DNA Mini Kit (QIAGEN). The T cell receptor excision circle (TREC) number was determined by quantitative real-time PCR using the sequence detector TaqMan (ABI PRISM model 7700; PE Biosystems) (for details, see supplemental Materials and Methods).
Flow Cytometry.
Cytometric analysis was performed as described previously (21) using a FACSCalibur™ or an LSR (BD Biosciences) and the CELLQuest™ software. Dead cells were excluded by propidium iodide or diamidophenylindole staining (Sigma-Aldrich).
Chemotaxis Assay.
T cells were enriched from lymph node and spleen cells of Balb/c mice by B cell depletion on anti-Ig–coated plates (DakoCytomation) and subjected to chemotaxis without further subset isolation or treatment. For the determination of the differential migration rates of the subsets, their frequency and absolute number was analyzed by FACS® in the input as well in the migrated populations as described previously (22). The recombinant murine chemokines CCL19, CCL20, and CXCL9 were purchased from R&D Systems, and CCL17 was purified from transfected insect cells, provided by I. Foerster (Institute for Medical Microbiology, Munich, Germany). All chemokines were titrated to identify optimal concentrations.
Adoptive Transfer of Treg Subsets for Analysis of Migration Behavior (Homing).
For in vivo homing assays, Treg subsets were isolated from lymphoid organs of Balb/c or C57Bl6 mice (arthritis model). A modified isolation method with a combination of negative selection and preferential use of Fab fragments was used: CD4+ T cells were enriched by panning using anti-CD8– and anti-Ig–coated plates. The subsets were separated by staining with FITC-labeled anti–CD4-F(ab), biotinylated αE-F(ab)2, PE-labeled SA and allophycocyanin-labeled anti-CD25 with FACS® (DIVA; BD Biosciences; MoFlow; DakoCytomation). Control experiments demonstrated that the sorting procedure or the types of antibodies chosen for staining did not significantly influence the migration behavior of labeled cells. Purity of the sorted subsets varied from >98% for αE −CD25−, 85–93% for αE −CD25+, 80–94% for αE +CD25+, and 70–85% for αE +CD25− (Fig. S1 B). Cells were labeled with 111In (Indiumoxin) or [51Cr]chromate (Amersham Biosciences) for 20 min at room temperature (2 × 10⁸ cells/ml; 10 μCi/ml) or for 1 h at 37°C (2 × 10⁷ cells/ml; 20 μCi/ml), respectively, followed by a 1-h incubation at 37°C in fresh medium and removal of dead cells on Nycodenz (17.1% isotonic Nycodenz; Nyegaard). Labeled cells were injected i.v., and 24 h later, mice were killed and the distribution of radioactivity in different organs, serum, and the remaining body was measured in a γ-counter (Wallac Counter).
DNFB-induced Skin Inflammation.
Balb/c mice were sensitized to 2,4-dinitrofluorobenzene (DNFB; Sigma-Aldrich) by skin painting on the abdomen with a solution of 0.5% DNFB in acetone–olive oil (4:1) at days −21 and −20. 24 h before the homing assay, the immunized mice were challenged with 0.5% DNFB at one ear pinna, whereas the untreated ear served as an internal control.
Antigen-induced Arthritis.
Arthritis was induced according to Brackertz et al. (23). In brief, C57Bl6 mice were immunized by subcutaneous injection of 100 μg (2 mg/ml) methylated BSA (mBSA; Sigma-Aldrich) in complete Freund's adjuvant (Sigma-Aldrich) 21 and 14 d before arthritis induction. Simultaneously, mice received 2 × 10⁹ killed Bordetella pertussis bacteria i.p. (Chiron Corp.). Arthritis was induced by injection of 25 μl of sterile mBSA-solution (4 mg/ml in saline) into one knee joint cavity.
Clinical severity of arthritis was evaluated by measurement of lateral joint diameter with an Oditest micrometer gauge (Kröplin Längenmesstechnik) and calculated as difference between the arthritic and untreated knee joint diameter. For histological evaluation, knee joints were fixed, decalcified in EDTA, and embedded in paraffin. Sections were stained with hematoxilin eosin. Six sections per knee joint were examined and scored blindly by two investigators on a 0–3 point basis for the extent of inflammatory changes (lining layer hyperplasia and cellular infiltration of synovial tissue) and joint destruction (pannus formation and cartilage destruction). A final arthritis score was evaluated for each animal by calculating the sum of the individual points.
Adoptive Transfer of Treg Subsets for Suppression of Arthritis.
CD4+ Treg subsets from lymph nodes and spleens of C57Bl6 mice were separated on a FACS® (DIVA; BD Biosciences) after MACS-enrichment of αE and CD25-expressing cells as aforementioned. αE −CD25−CD4+ control cells were isolated from the magnetic bead-negative fraction using MACS technology. All sorted subsets were >95–98% pure on reanalysis (unpublished data).
Before adoptive transfer, all CD4+ T cell subsets were preactivated for 24 h with 3 μg/ml plate-bound anti-CD3 plus 10 μg/ml of soluble anti-CD28 and 40 ng/ml recombinant murine IL-2 (R&D Systems) at 106 cells/ml. Cell culture was done with RPMI 1640 (GIBCO BRL) supplemented with 10% FCS (Sigma-Aldrich). Preactivated cells were gently removed from the plates, extensively washed with PBS, and 200 μl cell suspension (5 × 10⁵ cells/ml in PBS) was i.v. injected.
Statistics.
Data were presented as mean ± SD. In case of chemotaxis, data were corrected for differences in the general migration activity between experiments by normalization to the average migration rate. Significance was determined by Student's t test (after testing normal distribution, chemotaxis assay), Wilcoxon test (phenotyping, homing), Mann-Whitney-U (arthritis score), and repeated measure analyses (knee joint swelling). Differences were considered statistically significant with P ≤ 0.05 and highly significant with P ≤ 0.01. In case of multiple sample comparisons, adjusted significance levels according to Bonferroni were applied or overall significance was tested in advance with the Kruskall-Wallis or Friedman test.
Online Supplemental Material.
Fig. S1 shows the purity of sorted Treg subsets used for gene expression analysis and homing assays. Fig. S2 summarizes all genes being differentially expressed between αE −CD25+, αE +CD25+, and αE +CD25− CD4+ T cells. Table SI depicts real-time quantitative RT-PCR data for the expression of chemokine receptors within the investigated Treg subsets. Fig. S3 demonstrates that the differential expression of adhesion molecules and the in vivo migration behavior of the Treg subsets is not changed upon in vitro preactivation, and that the preactivation step does not result in differential survival. Fig. S4 shows the histological examination of knee joints from the antigen-induced arthritis model. Online supplemental material is available at http://www.jem.org/cgi/content/full/jem.20031562/DC1.
Results
Divergent Developmental Stages of Treg Subsets.
To obtain a comprehensive picture of the phenotype and developmental stage of αE-expressing Tregs in comparison to CD25 single positive cells, we applied cDNA microarray technology for gene expression profiling of αE −CD25+, αE +CD25+, and αE +CD25− CD4+ T cell subsets isolated directly ex vivo from secondary lymphoid organs. From ∼12,400 murine full-length genes and expressed sequence tags that were analyzed on Affymetrix microarrays, ∼90 (without expressed sequence tags) proved to be differentially expressed between the three Treg subsets when a ratio >2 in three independent experiments or confirmation by other techniques was presupposed (Fig. S2 available at http://www.jem.org/cgi/content/full/jem.20031562/DC1). Intriguingly, many molecules associated with effector/memory differentiation or homing mechanisms appeared to be differentially regulated between the Treg subsets. In general, the largest differences were found between αE −CD25+ and αE +CD25− cells, whereas the double positive αE +CD25+ subset often displayed intermediate levels of mRNA expression. A smaller number of genes was found to be expressed at higher levels in αE −CD25+ than in αE +CD25− cells, including CCR7 and L-selectin (CD62L) (2–5 fold difference), whereas the majority of genes showed higher levels in αE +CD25− than in αE −CD25+ cells, including molecules such as CD44, ICOS, granzyme B, FucTVII, integrin β1, CD54, CCR2, CXCR3, CCR6, and Ki67 (2–10 fold difference), which have been associated with activation and effector/memory status. Because the Affymetrix MG-U74Av2 microarray did not admit evaluation of Foxp3, we additionally performed a quantitative RT-PCR and observed a high Foxp3 expression level in all three Treg subsets in comparison to naive T cells (Fig. 1).
Figure 1.

Foxp3 expression in Treg subsets. Foxp3 mRNA expression was determined in sorted Treg subsets by real-time quantitative RT-PCR. Obtained values were normalized to the housekeeping gene hypoxanthine phosphoribosyltransferase and expressed as percentage of the level found in CD25 single positive cells (mean ± SD of three independent experiments).
To confirm the differences observed by gene profiling, we performed quantitative RT-PCR (Table SI available at http://www.jem.org/cgi/content/full/jem.20031562/DC1) and surface stainings on CD4+ T cells for several molecules used as markers to discriminate naive and antigen-experienced T cells, or known as costimulatory and adhesion molecules involved in lymphocyte trafficking (Fig. 2). CD45RB expression was reduced in all three Treg subsets in comparison with the predominantly naive control cells (αE −CD25−), as reported previously (18). However, the αE-expressing subsets and especially αE +CD25− cells showed significantly lower CD45RB levels than CD25 single positive cells (P < 0.01). This pattern (a naivelike phenotype of CD25 single positive and an effector/memory-like phenotype of αE-expressing cells) was even more obvious for two other well-established markers, CD44 and L-selectin. Additionally, a large number of further adhesion and costimulatory molecules known to be associated with an effector/memory status, such as CD54 (intercellular adhesion molecule 1), ICOS, β1-integrin (CD29), or LFA-1, were expressed at higher levels or on a greater fraction of cells among the αE + subsets. In general, αE +CD25+ cells showed intermediate expression levels (CD44, CD54, and LFA-1) or a more heterogeneous distribution (CD45RB, L-selectin, ICOS, and β1-integrin). In contrast, another differentially expressed activation marker, CD69, displayed the highest frequency among the αE +CD25+ subset.
Figure 2.
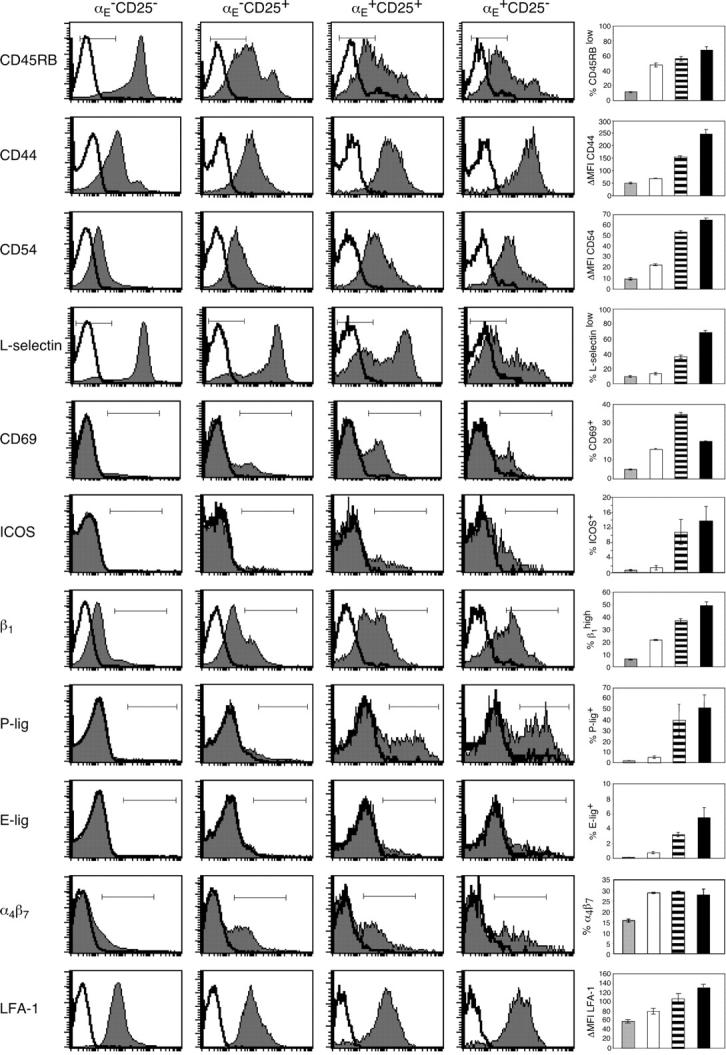
Phenotyping for effector/memory markers as well as adhesion molecules unravels a high degree of heterogeneity among Treg subsets. FACS® analysis of pooled spleen and lymph node cells shows the expression of several effector/memory markers and adhesion molecules on indicated CD4+ T cell subsets. Representative histogram plots from three independent experiments were selected showing stainings (gray) plus isotype controls (white). The graphs summarize data from one representative experiment and show frequency or mean fluorescence intensity of the indicated subsets as mean ± SD from three independently analyzed animals.
The expression profiles demonstrate developmental heterogeneity among the Treg subsets and suggest that αE + cells, in contrast with CD25 single positive cells, might be induced or expanded in response to antigenic stimulation. The latter hypothesis was tested by analysis of the TREC number, which is an indicator of the proliferative history of T cells: naive T cells without any antigen encounter and only low homeostatic proliferation display a high TREC content, whereas the frequency of excision circle positive cells is strongly reduced in subsets that have undergone excessive proliferation (24). As shown in Fig. 3, CD25 single positive cells contained a relatively high TREC number, comparable to αE −CD25− control cells. However, αE +CD25+ and especially αE single positive cells showed significantly lower TREC numbers, indicating that they have undergone repetitive cell divisions.
Figure 3.

αE-expressing Treg subsets have undergone excessive proliferation. Sorted Treg subsets from pooled spleen and lymph node cells were analyzed for their TREC content. Shown is the TREC number per 1,000 cells of the indicated subsets as mean ± SD of three parallel samples from one representative out of six independent measurements. Significance (*, P < 0.05) was computed from the six means. The average TREC number per 1,000 cells in CD4+CD8− thymocytes (“high control”) and cultured Th1 cells (“low control”) was 80 and 1, respectively (not depicted).
αE + Treg Subsets Display an Inflammation-seeking Phenotype.
The differential expression level of adhesion molecules not only distinguishes naive from effector/memory cells, but also has important implications for their migration behavior. As aforementioned, L-selectin was high on CD25 single positive cells and low on a large part of αE + cells. L-Selectin enables entry into lymph nodes via high endothelial venules and is crucial for recirculation of naive cells. In contrast, cells that extravasate into inflamed areas require expression of ligands for E- and P-selectin (25). When we analyzed the E- and P-selectin binding capacity of the Treg subsets using recombinant E- and P-selectin–Ig chimera, respectively, we observed striking differences between the subsets (Fig. 2). Reactivity with selectin chimeras was detected among αE + Treg subsets, whereas αE −CD25+ cells, comparable to predominantly naive αE −CD25− cells, showed no E-selectin and only little P-selectin binding.
That αE + cells display an inflammation-seeking phenotype was further supported by the differential expression of β1- and β2-integrins, known to synergize with selectins and chemokines in the extravasation process and to mediate firm adhesion to endothelium in lymphoid, nonlymphoid, and inflammatory sites. Both the β1-chain and the β2-integrin LFA-1 were found to be increased on αE + cells (Fig. 2). In conclusion, Tregs that are equipped with a whole set of adhesion molecules that allow them to migrate into peripheral tissues and inflamed sites are highly enriched within αE-expressing Treg subsets.
Differences in Chemokine Responsiveness.
Chemokines have important functions in guiding distinct subsets of leukocytes into specific tissues or into inflamed areas. To confirm the results from the cDNA microarrays, where differential expression of several chemokine receptors between Treg subsets was observed, we performed quantitative RT-PCR (Table SI). In support of the microarray data, we observed an increased expression of CXCR3 mRNA on αE +CD25+ and especially on αE +CD25− cells compared with the αE −CD25+ subset. Additionally, αE single positive cells showed a slightly enhanced expression of CXCR4 mRNA compared with both CD25+ subsets. No significant differences were observed for CCR5 and CCR9 expression. In discordance to the microarray data, quantitative RT-PCR revealed slightly higher values for CCR7 mRNA expression in the αE + subsets compared with the CD25 single positive cells, by unknown reasons. To get conclusive results, especially on functional properties, we performed chemotaxis assays, which also take into account that chemokine responsiveness often dissociates from receptor expression (26). For these assays, we took untouched total T cells freshly isolated from lymphoid organs and analyzed the responsiveness of the different subsets contained therein. All Treg subsets harbored high frequencies of cells responding toward the CCR7 ligand CCL19 (ELC), however, αE −CD25+ cells reproducibly showed a significantly higher migratory response toward CCL19 than both αE-expressing subsets in four experiments (Fig. 4). A contrasting pattern was found for the inflammatory chemokines CXCL9 (Mig), CCL17 (TARC), and also for CCL20 (LARC), which bind to the receptors CXCR3, CCR4, and CCR6, respectively. Both, αE +CD25+ and especially αE single positive cells displayed a significantly higher responsiveness toward these inflammatory chemokines than did CD25 single positive cells (Fig. 4). Titration of selected chemokines assured that the graduated response is not merely caused by different response curves (unpublished data). Furthermore, we tested CCL2 (MCP-1) and CCL4 (MIP-1β), which bind to the receptors CCR2 and CCR5, respectively. CCL2 and CCL4 did not induce a significant migration of freshly isolated cells at chemokine concentrations of 10 nM or 0.1–10 nM, respectively (unpublished data). In conclusion, αE + cells respond preferentially to several inflammatory chemokines, whereas the CD25 single positive subset is more reactive to chemokines involved in recirculation through lymphoid tissues.
Figure 4.

αE-expressing subsets have a higher migratory capacity toward inflammatory chemokines. The chemotactic response of pooled spleen and lymph node T cells to 30 nM CCL19, 100 nM CXCL9, 100 nM CCL17, and 10 nM CCL20 was analyzed in an in vitro chemotaxis assay. The number of migrating cells of each subset was measured by flow cytometry. Results are expressed as the percentage of the indicated subset that migrated to the lower chamber and where normalized to the mean migration rate of all subsets. Shown is the mean ± SD of three (CCL17, CCL20) or four (CCL19, CXCL9) experiments (*, P < 0.05; **, P < 0.01). Basal migration toward medium alone (dotted lines) showed no significant differences between the subsets.
Differential Migration Patterns of Treg Subsets In Vivo.
The phenotyping of Treg subsets for adhesion molecules and chemokine responsiveness supported a concept in which the Treg compartment can be subdivided into naivelike CD25 single positive cells that preferentially migrate into lymph nodes, and into effector/memory-like αE-expressing cells that predominantly enter peripheral tissues and inflamed effector sites. To test this hypothesis under in vivo conditions, we performed homing experiments using Treg subpopulations freshly isolated from lymphoid organs. An isolation method with a combination of negative selection and preferential use of Fab fragments was used, to avoid distribution artifacts due to beads or interfering levels of Fc-bearing IgG remaining on the surface of the migrating cells. Sorted subsets were radioactively labeled and injected i.v. into recipient mice. After 24 h, mice were killed, and their organs were analyzed.
First, we investigated the migration behavior of αE − CD25+, αE +CD25+, and αE +CD25−CD4+ Treg subsets, as well as αE −CD25− CD4+ T cells as a control population, in untreated mice (Fig. 5 A). CD25 single positive cells showed a higher migration rate into peripheral and mesenteric lymph nodes compared with αE-expressing Tregs. In contrast, both αE-expressing subsets showed a significantly higher migration rate into the liver. A similar pattern was already detectable at 3 h after injection (unpublished data).
Figure 5.

CD25 single positive cells display a stronger migration into lymph nodes, but αE single positive cells can efficiently enter inflamed sites. (A) Radioactively labeled T cell subsets were injected i.v. into naive Balb/c mice followed by the determination of radioactivity in the indicated organs after 24 h using a γ-counter. Percentage of total recovered radioactivity is shown (n = 4; mean ± SD; one representative out of two independent experiments). (B) Radioactively labeled T cell subsets were injected i.v. in Balb/c mice that had been sensitized and challenged with DNFB. Recovered radioactivity from control and inflamed ear pinna was determined after 24 h (n = 6; mean ± SD; *, P < 0.05; **, P < 0.01).
Next, we tested the migration of Treg subsets in a model of acute skin inflammation. Skin sensitization and challenge with DNFB induces a strong inflammatory response accompanied by ear swelling and immigration of T effector cells (25). 24 h after challenge, radioactively labeled Treg subsets were injected i.v., and 24 h later, radioactivity in the inflamed or control ear pinna was measured. Striking differences between the analyzed subsets were recorded with respect to their ability to immigrate into the inflamed area (Fig. 5 B). Only αE single positive cells showed an efficient migration into the inflamed skin, whereas migration into the noninflamed control site was low. Accumulation of both αE +CD25+ and CD25 single positive cells over 24 h was not significantly different from predominantly naive (αE −CD25−) control cells, indicating that αE +CD25− are unique in their ability to travel into sites of acute skin inflammation, as predicted from their homing and chemokine receptor expression profiles.
Only αE-expressing Treg Subsets Are Capable of Suppressing Acute Inflammatory Reactions.
Recently, we have shown that αE-expressing Treg subsets can efficiently inhibit the development of an intestinal inflammation in the induced SCID colitis model (18). Whether these subsets also can suppress acute inflammatory reactions in nonlymphopenic models and whether this is linked to their preferential migration into inflamed sites was tested in antigen-induced arthritis (23). This model has previously been shown to be a T cell–dependent autoimmune model, with an acute, antigen-reactive phase and autoreactivity developing in the chronic phase (27, 28).
Mice were immunized s.c. with mBSA, and arthritis was induced by injection of mBSA into one knee joint. 1 d before arthritis induction, preactivated Treg or control subsets were adoptively transferred into the mice. In this model, preactivation of the polyclonal Treg subsets is required to get an optimal suppression of the antigen-induced immune response (unpublished data). Control experiments showed that preactivation did not change the migration pattern of the Treg subsets. Furthermore, all adoptively transferred subsets survived equally well in vivo (Fig. S3 available at http://www.jem.org/cgi/content/full/jem.20031562/DC1).
The measurement of knee joint swelling at various time points revealed that only αE-expressing Treg subsets could efficiently inhibit the acute inflammation (Fig. 6 A), with especially the αE +CD25+ cells displaying a high suppressive capacity. Adoptive transfer of CD25 single positive cells had no curative effect on knee joint swelling, which was similar to mice receiving control cells (αE −CD25−) or PBS only. Histological examinations of knee joints in the chronic phase of arthritis revealed that mice receiving αE-expressing Treg subsets had reduced mononuclear infiltrates, whereas marked inflammatory signs were observed in mice adoptively transferred with CD25 single positive cells (Fig. 6 B and Fig. S4 available at http://www.jem.org/cgi/content/full/jem.20031562/DC1). Lack of suppression by CD25 single positive cells and antiinflammatory activity of αE-expressing Tregs was also found in a transgenic, Th1-mediated footpad delayed-type hypersensitivity model (unpublished data).
Figure 6.

αE-expressing subsets show the strongest suppression of inflammatory reactions in antigen-induced arthritis. (A and B) mBSA-immunized C57Bl6 mice received 105 FACS®-sorted and polyclonally preactivated cells 24 h before intraarticular mBSA injection (αE +CD25+, n = 4; αE +CD25−, n = 4; αE −CD25+, n = 11; αE −CD25−, n = 11; and PBS alone, n = 10). (A) The progression of arthritis was monitored by the measurement of knee joint swelling (mean ± SD; one representative out of two independent experiments). αE +CD25+ and αE +CD25− cells showed a higher suppressive capacity than CD25 single positive cells (P < 0.01 and P = 0.085, respectively). (B) At day 14, tissues were taken for histological examination. The final arthritis score was evaluated for each animal (mean ± SEM; one representative out of two independent experiments). αE +CD25+ cells showed a significantly lower arthritis score than CD25 single positive cells (*, P < 0.05). (C) Radioactively labeled T cell subsets were injected i.v. in mBSA-immunized mice that had received an intraarticular mBSA injection 4 d before the homing experiment. Recovered radioactivity from the inflamed knee was determined after 24 h using a γ-counter. Percentage of total recovered radioactivity is shown (n = 6; mean ± SD; one representative out of two independent experiments). αE +CD25+ and αE +CD25− cells showed a significantly higher migration into the inflamed knee joint compared with CD25 single positive cells (*, P < 0.05).
Finally, we analyzed the migration behavior of the Treg subsets in this arthritis model. Radioactively labeled T cell subsets were injected i.v. 4 d after arthritis induction when inflammatory signs in the knee joint were clearly visible (23). Consistent with previous studies on effector cells (25), 24 h after transfer, a small percentage (<0.5%) of total labeled cells could be found in the inflamed knee. Both αE-expressing subsets showed a significantly higher migration rate into the inflamed site compared with CD25 single positive and αE −CD25− control cells (Fig. 6 C). A similar migration pattern was observed for the contralateral knee joint, which in this model shows minor signs of inflammation, too. No recruitment of any subset was seen in knee joints of nonimmunized animals (unpublished data). In summary, using antigen-induced arthritis as a model, we were able to show a correlation of the suppressive capacity of αE-expressing Treg subsets with their preferential migration into inflamed sites.
Discussion
Functional and Phenotypic Heterogeneity of Tregs.
Previous analyses suggested a considerable functional and phenotypic heterogeneity among Tregs (1). Gene expression profiling is useful to reveal unique patterns of gene usage and to identify molecular pathways involved in specific properties. We took advantage of our previous finding that expression of the integrin αEβ7 subdivides murine Tregs into subsets, which differ with respect to suppressive and other functional capacities (18), and performed a detailed study on their expression profile. Important findings were confirmed by flow cytometry, quantitative RT-PCR, and functional assays.
The results revealed fundamental differences between αE + and αE − populations, which suggests that this marker is useful to distinguish distinct lineages or differentiation stages of murine Tregs. A restricted number of genes was reproducibly found to be differentially expressed between the subsets. Besides markers for activation or memory status and molecules involved in homing, which are discussed in more detail below, some molecules emerged (e.g., S100A6 [calcyclin], S100A11 [calpactin I], and granzyme B) that have been shown in former gene expression analyses to be exclusively expressed in CD25+ versus CD25−CD4+ T cell subsets (19). However, by subdividing the CD25+ compartment into αE + and αE − subsets and adding αE + CD25− cells to the analysis, we can demonstrate that these genes do not segregate with CD25, but are predominantly expressed within αE + subsets, supporting the concept of a heterogeneous Treg compartment.
Consistently, the data indicate that CD25 single positive cells resemble naive T cells, displaying high expression of L-selectin and higher CCR7 responsiveness as well as low expression of CD44 and other adhesion molecules and, somewhat less pronounced, higher CD45RB levels. In contrast, the αE single positive population shows typical features of effector/memory cells, including expression of receptors required for immigration into peripheral and inflamed tissues. The increased mRNA levels for CD25 on αE single positive cells (compared with CD45RBhigh cells) and surface expression of CD25 upon activation in vitro (unpublished data) might suggest that the αE +CD25+ subset, which also expresses higher levels of CD69, merely represents an activated stage of αE single positive cells. However, all other markers related to activation and differentiation into effector/memory stage, including CD44, L-selectin, and several adhesion and chemokine receptors, consistently favor the view that the αE +CD25+ subset represents an intermediate stage or a more heterogeneous population in between CD25 and αE single positive cells and does not originate from the αE single positive subset. This is confirmed by the content of TRECs, which is high in CD25 single positive and lowest in αE single positive cells, indicating that the former represent a rather naive developmental stage, whereas the latter cells are those that have most often divided after TCR recombination within the thymus (24).
A model recently suggested by Bluestone et al. reconciles the functional and developmental heterogeneity among Tregs in proposing the existence of natural and adaptive regulators differing not only in terms of origin but also of specificity and effector mechanisms (11). According to their model, natural, self-antigen–specific Tregs develop during the normal process of T cell maturation in the thymus and survive as a long-lived population in the periphery, poised to sustain self-tolerance. In contrast, adaptive Tregs develop upon T cell activation under particular conditions. Several sets of data in the present work provide evidence that the expression of CD25 and αE can be used to differentiate these subsets in the murine system; their differential developmental stage according to TREC content and effector/memory markers as well as unique migratory phenotypes consistently define them as distinct subsets. Apparently, CD25 single positive and αE-expressing cells can be envisaged as prototypes of natural and adaptive Tregs, respectively, with the adaptive regulators developing either from thymus-derived natural Tregs or from naive cells upon encounter with cognate antigen (Fig. 7). In accordance with this, only CD25 single positive cells were detected in significant frequencies among CD4+CD8− cells in thymus early after birth (unpublished data).
Figure 7.

CD25 single positive cells represent natural Tregs, whereas αE-expressing subsets are prototypes of adaptive Tregs.
Expression of αEβ7 at very high levels is a hallmark of intraepithelial lymphocytes residing in the gut wall and other epithelial compartments, such as skin and lung (29). It is tempting to speculate that αE + Tregs isolated from secondary lymphoid organs originate from these compartments. However, we did not find significant in vitro suppressive capacity among total αE +CD4+ cells isolated from the gut wall (unpublished data). However, not excluded is the presence of a subpopulation representing developing Tregs in this compartment. Furthermore, αEβ7 can be induced upon activation in presence of TGFβ (30); therefore, its expression might be seen as an indication of their previous maturation in a TGFβ-rich milieu. Consistent with the view that αE + regulators originate in response to peripheral antigen, transfer studies with antigen-specific T cells into mice that express the antigen under organ-specific promoters in the periphery reveal an induction of the integrin αEβ7 on transgenic T cells (unpublished data). Whether the same applies for the adoptively transferred CD25+CD4+ T cells, which recently have been reported to undergo excessive in vivo proliferation under particular conditions (31, 32), remains to be shown. However, it is already known that oral antigen application led to a reduction of L-selectin levels on antigen-specific CD25+CD4+ T cells (9, 33), which suggests that these cells might belong to the αE +CD25+ subset, which is predominantly L-selectinlow.
Migration Behavior and Different Suppressive Capacity In Vivo.
A critical issue as yet insufficiently addressed is the question of where Tregs exert their suppressive function. Is their presence in lymphoid tissue required to prevent development of autoimmune reactions at initial stages of T cell activation, or is it the effector site where suppression of autoaggressive cells occurs that have escaped central tolerance mechanisms? Our findings suggest that Tregs are able to act at both stages, yet with a conspicuous division of labor between natural regulators recirculating through lymphoid tissue and adaptive regulators equipped to migrate into inflamed tissues. The distinct migratory behavior of the Treg subsets described in this paper emphasizes the importance of subset localization for their suppressive capacity in vivo.
Some data suggest that Tregs are most efficient in preventing priming of naive cells (12), which requires their presence in lymphoid tissue. CD25 single positive cells display typical properties of recirculating T cells with high levels of L-selectin and responsiveness toward CCR7 ligands, which both have been shown to be a prerequisite for the migration into lymph nodes (34–36). Additionally, the lack of homing and chemokine receptors for inflammatory sites suggests that this population is unlikely to perform a function in acute inflammation. Indeed, here we were able to directly demonstrate efficient trafficking into lymphoid tissues but poor migration into inflamed sites.
A distinct function of the L-selectinhigh/CCR7high subset of CD25+CD4+ Tregs in the prevention of autoimmunity has been described in the NOD model, where this subset efficiently suppressed development of diabetes, indicating that, in this model, the homeostatic regulation by naivelike regulators is of major importance (14, 37). However, in vitro studies did not reveal a higher suppressive potential of the L-selectinhigh subset (19). These findings indicate that the differential regulatory capacities of the L-selectinhigh and L-selectinlow subsets in vivo reflect differences in homing properties, rather than suppressor potential by itself. Interestingly, those Tregs recovered from the inflamed islets were L-selectinlow (14), suggesting that part of the regulatory cells might differentiate into the effector/memory stage in vivo.
The present work shows that αE + subsets represent the lineage or developmental stage of adaptive, effector/memory-like regulators. Effector/memory cells preferentially localize within nonlymphoid and inflamed tissues, which correlate with increased levels of a variety of adhesion molecules and chemokine receptors (25, 38–41). This was also found for the αE-expressing subsets, notably for molecules such as LFA-1, β1-integrin, CD44, ligands for inflammatory selectins, and chemokine receptors. Furthermore, αE + Tregs showed increased trapping within the liver, a partially LFA-1–dependent mechanism (42), which resembles a similar feature of CD4+ effector/memory or CD8+ T cells (43, 44). It is tempting to speculate that those T cells with suppressive potential that could be isolated from effector sites such as synovial fluid of rheumatoid arthritis patients (45), lung tumors (46), transplants (47), skin lesions of Leishmania major–infected mice (17), islets of Langerhans in a diabetes model (48), or the inflamed intestine in the SCID colitis model (49), might represent typical examples of adaptive Tregs.
In most types of inflammation, E- and P-selectin play a dominant role in recruiting effector cells (25, 39). Expression of ligands for both selectins as well as increased message for the enzyme fucosyltransferase VII, which generates the selectin-binding epitopes (50), was found to be a prominent feature of αE + cells. These findings have important implications for the use of migratory pathways as targets for antiinflammatory therapy; inhibition of such functions might not only prevent the infiltration of autoaggressive effector cells but also that of protective regulators. This issue has to be considered in therapeutic concepts.
αE + Tregs also show high levels of mRNA for inflammatory chemokine receptors such as CCR2, CXCR3, CCR4, and CCR5, which are absent on naive T cells, and display increased responsiveness toward CXCL9/Mig and CCL17/TARC. These data fit to a separate analysis of L-selectinhigh and L-selectinlow subsets of murine CD25+ cells, which largely might correspond with CD25 single positive and αE +CD25+ cells, respectively, revealing that CCR7 is predominantly expressed on the L-selectinhigh subset, whereas levels of CCR2, CCR4, and CXCR3 were much higher on CD25+L-selectinlow cells (37). Differential expression of chemokine receptors might not only effect tissue- or inflammation-specific migration, but also guide subsets of T cells, including Tregs to different types of antigen-presenting cells, as recently proposed (15, 51). To what extent this might contribute to differential functioning of Treg subsets is completely unknown.
Here, we provide direct evidence that the differential expression of adhesion molecules and chemokine receptors translates into different migratory properties in vivo. Especially αE single positive cells migrate very efficiently into inflamed skin, where E/P-selectins as well as CCR4 ligands play a predominant role (39, 52), whereas both αE-expressing subsets were efficiently recruited into inflamed joints. The number of αE + Tregs accumulating in the inflamed tissues was similar to that of Th1 effector cells in the same inflammatory models (reference 25 and unpublished data).
Previously, we have shown that αE single positive cells efficiently prevent development of colitis in the SCID model, although these cells display rather poor suppressive capacity in vitro (18). By combining high in vitro suppressive capacity with specific migration into effector sites, αE +CD25+ cells showed the highest capacity to prevent inflammatory disease. In this lymphopenic model, Tregs undergo extensive expansion in vivo (49) and it has been argued that even homeostatic competition suffices to obtain protection (53). Here, we show that partial protection by adoptive transfer of Treg subsets can also be demonstrated in inflammatory models using immunocompetent mice, and even when given after priming. αE single positive and αE +CD25+ Treg subsets were both able to reduce acute and chronic inflammation in antigen-induced arthritis. In fact, CD25 single positive cells, which showed no preferential migration into the inflamed knee joint, were not protective in the acute phase and showed only weak suppressive effects on chronic inflammation.
Conversion of an established immune pathology by Tregs has only been described recently (49). It is tempting to predict that αE-expressing subsets, by combining high suppressive potential with specific migration behavior into inflamed sites, could have a strong therapeutic potential in established autoimmune diseases. Immunosuppressive strategies based on adoptive transfer of Tregs have to take this requirement into account.
Acknowledgments
We thank P. Kilshaw for providing the anti–αE-Ab-producing hybridoma, T. Kaiser and K. Raba for FACS® sorting, J. Bahr and T. Toepfer for technical assistance, D. Huscher for statistical analysis, I. Foerster for providing the TARC-producing cell line, R. Kroczek for anti-ICOS mAb and D. Vestweber for the recombinant selectin–human IgG fusion proteins, M. Drayson for instructions regarding Indium labeling, and M. Tapp for help with the graphics.
This work was supported by the Deutsche Forschungsgemeinschaft (SFB 421, Ha 1505/7), the Bundesministerium fuer Bildung, Wissenschaft, Forschung, und Technologie (BerlInflameD5), the Competence Network Rheumatology (01 G1 0344), and the Alfried Krupp von Bohlen und Halbach Stiftung.
J. Huehn and K. Siegmund contributed equally to this work.
The online version of this article includes supplemental material.
Abbreviations used in this paper: DNFB, 2,4-dinitrofluorobenzene; ICOS, inducible costimulator; mBSA, methylated BSA; SA, streptavidin; TREC, T cell receptor excision circle; Treg, regulatory T cell.
References
- 1.Shevach, E.M. 2002. CD4+ CD25+ suppressor T cells: more questions than answers. Nat. Rev. Immunol. 2:389–400. [DOI] [PubMed] [Google Scholar]
- 2.Hori, S., T. Nomura, and S. Sakaguchi. 2003. Control of regulatory T cell development by the transcription factor Foxp3. Science. 299:1057–1061. [DOI] [PubMed] [Google Scholar]
- 3.Itoh, M., T. Takahashi, N. Sakaguchi, Y. Kuniyasu, J. Shimizu, F. Otsuka, and S. Sakaguchi. 1999. Thymus and autoimmunity: production of CD25+CD4+ naturally anergic and suppressive T cells as a key function of the thymus in maintaining immunologic self-tolerance. J. Immunol. 162:5317–5326. [PubMed] [Google Scholar]
- 4.Papiernik, M., M.L. de Moraes, C. Pontoux, F. Vasseur, and C. Penit. 1998. Regulatory CD4 T cells: expression of IL-2R alpha chain, resistance to clonal deletion and IL-2 dependency. Int. Immunol. 10:371–378. [DOI] [PubMed] [Google Scholar]
- 5.Annunziato, F., L. Cosmi, F. Liotta, E. Lazzeri, R. Manetti, V. Vanini, P. Romagnani, E. Maggi, and S. Romagnani. 2002. Phenotype, localization, and mechanism of suppression of CD4+CD25+ human thymocytes. J. Exp. Med. 196:379–387. [DOI] [PMC free article] [PubMed] [Google Scholar]
- 6.Jordan, M.S., A. Boesteanu, A.J. Reed, A.L. Petrone, A.E. Holenbeck, M.A. Lerman, A. Naji, and A.J. Caton. 2001. Thymic selection of CD4+CD25+ regulatory T cells induced by an agonist self-peptide. Nat. Immunol. 2:301–306. [DOI] [PubMed] [Google Scholar]
- 7.Apostolou, I., A. Sarukhan, L. Klein, and H. von Boehmer. 2002. Origin of regulatory T cells with known specificity for antigen. Nat. Immunol. 3:756–763. [DOI] [PubMed] [Google Scholar]
- 8.Thorstenson, K.M., and A. Khoruts. 2001. Generation of anergic and potentially immunoregulatory CD25+CD4 T cells in vivo after induction of peripheral tolerance with intravenous or oral antigen. J. Immunol. 167:188–195. [DOI] [PubMed] [Google Scholar]
- 9.Zhang, X., L. Izikson, L. Liu, and H.L. Weiner. 2001. Activation of CD25(+)CD4(+) regulatory T cells by oral antigen administration. J. Immunol. 167:4245–4253. [DOI] [PubMed] [Google Scholar]
- 10.Waldmann, H., and S. Cobbold. 2001. Regulating the immune response to transplants. a role for CD4+ regulatory cells? Immunity. 14:399–406. [DOI] [PubMed] [Google Scholar]
- 11.Bluestone, J.A., and A.K. Abbas. 2003. Natural versus adaptive regulatory T cells. Nat. Rev. Immunol. 3:253–257. [DOI] [PubMed] [Google Scholar]
- 12.Annacker, O., R. Pimenta-Araujo, O. Burlen-Defranoux, T.C. Barbosa, A. Cumano, and A. Bandeira. 2001. CD25+ CD4+ T cells regulate the expansion of peripheral CD4 T cells through the production of IL-10. J. Immunol. 166:3008–3018. [DOI] [PubMed] [Google Scholar]
- 13.Sakaguchi, S., N. Sakaguchi, M. Asano, M. Itoh, and M. Toda. 1995. Immunologic self-tolerance maintained by activated T cells expressing IL-2 receptor alpha-chains (CD25). Breakdown of a single mechanism of self-tolerance causes various autoimmune diseases. J. Immunol. 155:1151–1164. [PubMed] [Google Scholar]
- 14.Lepault, F., and M.C. Gagnerault. 2000. Characterization of peripheral regulatory CD4+ T cells that prevent diabetes onset in nonobese diabetic mice. J. Immunol. 164:240–247. [DOI] [PubMed] [Google Scholar]
- 15.Bystry, R.S., V. Aluvihare, K.A. Welch, M. Kallikourdis, and A.G. Betz. 2001. B cells and professional APCs recruit regulatory T cells via CCL4. Nat. Immunol. 2:1126–1132. [DOI] [PubMed] [Google Scholar]
- 16.Iellem, A., L. Colantonio, and D. D'Ambrosio. 2003. Skin-versus gut-skewed homing receptor expression and intrinsic CCR4 expression on human peripheral blood CD4+ CD25+ suppressor T cells. Eur. J. Immunol. 33:1488–1496. [DOI] [PubMed] [Google Scholar]
- 17.Belkaid, Y., C.A. Piccirillo, S. Mendez, E.M. Shevach, and D.L. Sacks. 2002. CD4+CD25+ regulatory T cells control Leishmania major persistence and immunity. Nature. 420:502–507. [DOI] [PubMed] [Google Scholar]
- 18.Lehmann, J., J. Huehn, M. de la Rosa, F. Maszyna, U. Kretschmer, M. Brunner, A. Scheffold, V. Krenn, and A. Hamann. 2002. Expression of the integrin alpha Ebeta 7 identifies unique subsets of CD25+ as well as CD25- regulatory T cells. Proc. Natl. Acad. Sci. USA. 99:13031–13036. [DOI] [PMC free article] [PubMed] [Google Scholar]
- 19.McHugh, R., M.J. Whitters, C.A. Piccorillo, D.A. Young, E.M. Shevach, M. Collins, and M.C. Byrne. 2002. CD4+ CD25+ immunoregulatory T cells: gene expression analysis reveals a functional role for the glucocorticoid-induced TNF receptor. Immunity. 16:311–323. [DOI] [PubMed] [Google Scholar]
- 20.Banz, A., A. Peixoto, C. Pontoux, C. Cordier, B. Rocha, and M. Papiernik. 2003. A unique subpopulation of CD4+ cells regulatory T cells controls wasting disease, IL-10 secretion and T cell homeostasis. Eur. J. Immunol. 33:2419–2428. [DOI] [PubMed] [Google Scholar]
- 21.Assenmacher, M., J.A. Schmitz, and A. Radbruch. 1994. Flow cytometric determination of cytokines in activated murine T helper lymphocytes: expression of interleukin-10 in interferon-γ and in interleukin-4-expressing cells. Eur. J. Immunol. 24:1097–1101. [DOI] [PubMed] [Google Scholar]
- 22.Debes, G., U. Höpken, and A. Hamann. 2002. In vivo differentiated cytokine-producing CD4+ T cells express functional CCR7. J. Immunol. 168:5441–5447. [DOI] [PubMed] [Google Scholar]
- 23.Brackertz, D., G.F. Mitchell, and I.R. Mackay. 1977. Antigen-induced arthritis in mice. Arthritis Rheum. 20:841. [DOI] [PubMed] [Google Scholar]
- 24.Hazenberg, M.D., M.C. Verschuren, D. Hamann, F. Miedema, and J.J. van Dongen. 2001. T cell receptor excision circles as markers for recent thymic emigrants: basic aspects, technical approach, and guidelines for interpretation. J. Mol. Med. 79:631–640. [DOI] [PubMed] [Google Scholar]
- 25.Austrup, F., D. Vestweber, E. Borges, M. Löhning, R. Bräuer, U. Herz, H. Renz, R. Hallmann, A. Scheffold, A. Radbruch, and A. Hamann. 1997. P- and E-selectin mediate recruitment of T helper 1 but not T helper 2 cells into inflamed tissues. Nature. 385:81–83. [DOI] [PubMed] [Google Scholar]
- 26.Bleul, C.C., L. Wu, J.A. Hoxie, T.A. Springer, and C.R. Mackay. 1997. The HIV coreceptors CXCR4 and CCR5 are differentially expressed and regulated on human T lymphocytes. Proc. Natl. Acad. Sci. USA. 94:1925–1930. [DOI] [PMC free article] [PubMed] [Google Scholar]
- 27.Petrow, P.K., K. Thoss, D. Katenkamp, and R. Brauer. 1996. Adoptive transfer of susceptibility to antigen-induced arthritis into severe combined immunodeficient (SCID) mice: role of CD4+ and CD8+ T cells. Immunol. Invest. 25:341–353. [DOI] [PubMed] [Google Scholar]
- 28.Bräuer, R., K. Thoss, and S. Henzgen. 1993. Humoral and cell-mediated sensitivity to cartilage constituents in mice within antigen-induced arthritis. Agents Actions. 39(Suppl.):69–73. [DOI] [PubMed] [Google Scholar]
- 29.Cerf-Bensussan, N., A. Jarry, N. Brousse, B. Lisowska-Grospierre, D. Guy-Grand, and C. Griscelli. 1987. A monoclonal antibody (HML-1) defining a novel membrane molecule present on human intestinal lymphocytes. Eur. J. Immunol. 17:1279–1285. [DOI] [PubMed] [Google Scholar]
- 30.Kilshaw, P.J., and S.J. Murant. 1991. Expression and regulation of beta 7(beta p) integrins on mouse lymphocytes: relevance to the mucosal immune system. Eur. J. Immunol. 21:2591–2597. [DOI] [PubMed] [Google Scholar]
- 31.Klein, L., K. Khazaie, and H. von Boehmer. 2003. In vivo dynamics of antigen-specific regulatory T cells not predicted from behavior in vitro. Proc. Natl. Acad. Sci. USA. 100:8886–8891. [DOI] [PMC free article] [PubMed] [Google Scholar]
- 32.Walker, L.S., A. Chodos, M. Eggena, H. Dooms, and A.K. Abbas. 2003. Antigen-dependent proliferation of CD4+ CD25+ regulatory T cells in vivo. J. Exp. Med. 198:249–258. [DOI] [PMC free article] [PubMed] [Google Scholar]
- 33.Jump, R.L., and A.D. Levine. 2002. Murine Peyer's patches favor development of an IL-10-secreting, regulatory T cell population. J. Immunol. 168:6113–6119. [DOI] [PubMed] [Google Scholar]
- 34.Gallatin, W.M., I.L. Weissman, and E.C. Butcher. 1983. A cell-surface molecule involved in organ-specific homing of lymphocytes. Nature. 304:30–34. [DOI] [PubMed] [Google Scholar]
- 35.Forster, R., A. Schubel, D. Breitfeld, E. Kremmer, I. Renner Muller, E. Wolf, and M. Lipp. 1999. CCR7 coordinates the primary immune response by establishing functional microenvironments in secondary lymphoid organs. Cell. 99:23–33. [DOI] [PubMed] [Google Scholar]
- 36.Luther, S.A., H.L. Tang, P.L. Hyman, A.G. Farr, and J.G. Cyster. 2000. Coexpression of the chemokines ELC and SLC by T zone stromal cells and deletion of the ELC gene in the plt/plt mouse. Proc. Natl. Acad. Sci. USA. 97:12694–12699. [DOI] [PMC free article] [PubMed] [Google Scholar]
- 37.Szanya, V., J. Ermann, C. Taylor, C. Holness, and C.G. Fathman. 2002. The subpopulation of CD4+CD25+ splenocytes that delays adoptive transfer of diabetes expresses L-selectin and high levels of CCR7. J. Immunol. 169:2461–2465. [DOI] [PubMed] [Google Scholar]
- 38.Mackay, C.R., W.L. Marston, and L. Dudler. 1990. Naive and memory T cells show distinct pathways of lymphocyte recirculation. J. Exp. Med. 171:801–817. [DOI] [PMC free article] [PubMed] [Google Scholar]
- 39.Tietz, W., Y. Allemand, E. Borges, D. von Laer, R. Hallmann, D. Vestweber, and A. Hamann. 1998. CD4+ T-cells only migrate into inflamed skin if they express ligands for E- and P-selectin. J. Immunol. 161:963–970. [PubMed] [Google Scholar]
- 40.Masopust, D., V. Vezys, A.L. Marzo, and L. Lefrancois. 2001. Preferential localization of effector memory cells in nonlymphoid tissue. Science. 291:2413–2417. [DOI] [PubMed] [Google Scholar]
- 41.Moser, B., and P. Loetscher. 2001. Lymphocyte traffic control by chemokines. Nat. Immunol. 2:123–128. [DOI] [PubMed] [Google Scholar]
- 42.Mehal, W.Z., A.E. Juedes, and I.N. Crispe. 1999. Selective retention of activated CD8+ T cells by the normal liver. J. Immunol. 163:3202–3210. [PubMed] [Google Scholar]
- 43.Tietz, W., and A. Hamann. 1997. The migratory behavior of murine CD4+ cells of memory phenotype. Eur. J. Immunol. 27:2225–2232. [DOI] [PubMed] [Google Scholar]
- 44.Klugewitz, K., S. Topp, U. Dahmen, T. Kaiser, S. Sommer, E. Kury, and A. Hamann. 2002. Differentiation-dependent and subset-specific recruitment of T-helper cells into the liver. Hepatology. 35:568–578. [DOI] [PubMed] [Google Scholar]
- 45.Cao, D., V. Malmstrom, C. Baecher-Allan, D. Hafler, L. Klareskog, and C. Trollmo. 2003. Isolation and functional characterization of regulatory CD25brightCD4+ T cells from the target organ of patients with rheumatoid arthritis. Eur. J. Immunol. 33:215–223. [DOI] [PubMed] [Google Scholar]
- 46.Woo, E.Y., H. Yeh, C.S. Chu, K. Schlienger, R.G. Carroll, J.L. Riley, L.R. Kaiser, and C.H. June. 2002. Cutting edge: Regulatory T cells from lung cancer patients directly inhibit autologous T cell proliferation. J. Immunol. 168:4272–4276. [DOI] [PubMed] [Google Scholar]
- 47.Graca, L., S.P. Cobbold, and H. Waldmann. 2002. Identification of regulatory T cells in tolerated allografts. J. Exp. Med. 195:1641–1646. [DOI] [PMC free article] [PubMed] [Google Scholar]
- 48.Green, E.A., Y. Choi, and R.A. Flavell. 2002. Pancreatic lymph node-derived CD4(+)CD25(+) Treg cells: highly potent regulators of diabetes that require TRANCE-RANK signals. Immunity. 16:183–191. [DOI] [PubMed] [Google Scholar]
- 49.Mottet, C., H.H. Uhlig, and F. Powrie. 2003. Cutting edge: cure of colitis by CD4(+)CD25(+) regulatory T cells. J. Immunol. 170:3939–3943. [DOI] [PubMed] [Google Scholar]
- 50.Maly, P., A. Thall, B. Petryniak, C.E. Rogers, P.L. Smith, R.M. Marks, R.J. Kelly, K.M. Gersten, G. Cheng, T.L. Saunders, et al. 1996. The alpha(1,3)fucosyltransferase Fuc-TVII controls leukocyte trafficking through an essential role in L-, E-, and P-selectin ligand biosynthesis. Cell. 86:643–653. [DOI] [PubMed] [Google Scholar]
- 51.D'Ambrosio, D., F. Sinigaglia, and L. Adorini. 2003. Special attractions for suppressor T cells. Trends Immunol. 24:122–126. [DOI] [PubMed] [Google Scholar]
- 52.Campbell, J.J., G. Haraldsen, J. Pan, J. Rottman, S. Qin, P. Ponath, D.P. Andrew, R. Warnke, N. Ruffing, N. Kassam, et al. 1999. The chemokine receptor CCR4 in vascular recognition by cutaneous but not intestinal memory T cells. Nature. 400:776–780. [DOI] [PubMed] [Google Scholar]
- 53.Barthlott, T., G. Kassiotis, and B. Stockinger. 2003. T cell regulation as a side effect of homeostasis and competition. J. Exp. Med. 197:451–460. [DOI] [PMC free article] [PubMed] [Google Scholar]