

Abstract
Many growth factors and cytokines prevent apoptosis. Using an expression cloning method, we identified a novel antiapoptotic molecule named Anamorsin, which does not show any homology to known apoptosis regulatory molecules such as Bcl-2 family, caspase family, or signal transduction molecules. The expression of Anamorsin was completely dependent on stimulation with growth factors such as interleukin 3, stem cell factor, and thrombopoietin in factor-dependent hematopoietic cell lines, and forced expression of Anamorsin conferred resistance to apoptosis caused by growth factor deprivation in vitro. Furthermore, Anamorsin was found to act as an antiapoptotic molecule in vivo because Anamorsin−/− mice die in late gestation due to defective definitive hematopoiesis in the fetal liver (FL). Although the number of hematopoietic stem/progenitor cells in the FL did not decrease in these mice, myeloid, and particularly erythroid colony formation in response to cytokines, was severely disrupted. Also, Anamorsin−/− erythroid cells initiated apoptosis during terminal maturation. As for the mechanism of Anamorsin-mediated cell survival, a microarray analysis revealed that the expression of Bcl-xL and Jak2 was severely impaired in the FL of Anamorsin−/− mice. Thus, Anamorsin is considered to be a necessary molecule for hematopoiesis that mediates antiapoptotic effects of various cytokines.
Keywords: antiapoptosis, cytokine signal, expression cloning, definitive hematopoiesis, gene targeting
Introduction
Growth, differentiation, and survival of hematopoietic cells are positively or negatively regulated by a number of cytokines. Among these factors, several cytokines such as erythropoietin (EPO), thrombopoietin (TPO), G-CSF, and stem cell factor (SCF) are considered to play crucial roles in hematopoiesis because the targeted disruption or spontaneous loss of function mutation of these factors or their receptors leads to severe defects in mutant mice (1–4).
Upon binding to their receptors, cytokines initially evoke phosphorylation and activation of cell surface tyrosine kinases such as receptor tyrosine kinases or JAK family tyrosine kinases. Activated tyrosine kinases transmit mitogenic and antiapoptotic signals through simultaneous activation of downstream signaling molecules including Ras/MAPK, PI3-K/Akt, and signal transducers and activators of transcription (STATs; 5, 6). During the last decade, accumulated experimental evidence has suggested that each of the Ras/MAPK, PI3-K, and STATs can mediate both cell growth and survival. In the case of Ras/MAPK, dominant negative Ras inhibits IL-3–dependent growth of the murine IL-3–dependent cell line Ba/F3 (7), and oncogenic Ras enables Ba/F3 cells to survive under conditions of IL-3 deprivation (8). In this system, Ras/MAPK was found to induce expression of antiapoptotic Bcl-2 family members, Bcl-2 and Bcl-xL (8, 9). However, the induction of these molecules by Ras/MAPK seems to be indirect and it remains unknown which molecule(s) are involved in their induction. In addition, Ras promotes cell survival, at least in part, through the activation of PI3-K, which is observed in several, but not all, cell types (10). The PI3-K/Akt pathway exerts antiapoptotic effects by phosphorylating and inhibiting the function of proapoptotic molecules, BAD and FKHRL1. Also, the PI3-K/Akt pathway degrades the death effector, caspase-9 (11). Both Ras/MAPK and PI3-K/Akt pathways inhibit expression of the proapoptotic Bcl-2 family member, Bim, which plays a pivotal role in factor-deprived apoptosis (12). On the other hand, similarly to oncogenic Ras, a constitutively active form of STAT5A enables Ba/F3 cells to proliferate and survive under IL-3–starved conditions (13). Regarding the mechanism of STAT-mediated cell survival, STAT5 and STAT1 were found to induce the expression of Bcl-xL mRNA through direct binding to its promoter as transcription factors (14, 15). Supporting these findings, hematopoietic cells obtained from STAT5A−/− 5B−/− mice were more likely to undergo apoptosis due to a defect in induction of Bcl-xL (15, 16). Moreover, STAT3 and STAT5 were reported to induce expression of Bcl-2 mRNA, but its induction seems to be indirect (9, 17). Although great advances have been made in understanding signal transduction pathways mediated by cytokines, several critical points still remain unelucidated. In particular, it remains largely unknown how Ras/MAPK induces expression of Bcl-2 family members, and thus it has been speculated that some critical, intermediary signaling molecules might be missing in this pathway.
Factor-dependent cell lines such as Ba/F3 (pro–B cells), FL.5.12 (pro–B cells), and 32D (myeloid cells) are useful tools for analyzing the mechanism of cytokine-dependent cell growth and survival. Indeed, most previous studies were performed with these cell lines. Moreover, recent studies identified two apoptosis regulatory molecules with cDNA microarray analyses by using FL5.12 cells cultured with or without IL-3. One is a proapoptotic molecule, 24p3, encoding a lipocalin, whose expression is up-regulated after IL-3 depletion (18). By contrast, the expression of a serine/threonine kinase, Pim-2, which confers resistance to a variety of apoptotic stimuli, was down-regulated by IL-3 deprivation in a microarray analysis (19). These cell lines have also been used to evaluate oncogenic properties of uncharacterized molecules and find activating mutations of certain genes. For example, activating mutants of STAT5 and c-mpl were both originally identified as molecules that confer factor-independent growth and survival of Ba/F3 cells by using retrovirus-mediated expression cloning (13, 20).
By using a retrovirus expression library prepared from Ba/F3-Ad, an IL-3–independent sub-line established from Ba/F3 (unpublished data), we cloned a novel antiapoptotic molecule, Anamorsin (ana-mors-in was designated to mean an anti-death molecule in Latin), which can confer resistance to IL-3 deprivation apoptosis in Ba/F3 cells. In addition to antiapoptotic activities of Anamorsin in in vitro assays, we also demonstrated its antiapoptotic function in vivo by generating KO mice. The Anamorsin−/− genotype is lethal at late gestation due to apoptosis of hematopoietic cells in the fetal liver (FL). Thus, Anamorsin appears to play a crucial role in definitive hematopoiesis as an antiapoptotic molecule.
Materials and Methods
Cell Culture and cDNA Transfection.
The murine IL-3–dependent cell lines, Ba/F3 and 32D, were cultured in RPMI 1640 supplemented with 10% FCS in the presence of 0.1 ng/ml mIL-3 (Kirin Brewery Company). EPO receptor, c-kit, and c-mpl were individually engineered to be expressed in Ba/F3 cells, and their clones were able to proliferate in the presence of the corresponding cytokines. To construct expression vectors for Anamorsin and H-RasG12V, these cDNAs were subcloned into pcDNA3 (Invitrogen). Ba/F3 cells or 32D cells were transfected with the Anamorsin or H-RasG12V expression vector by electroporation and selected by culturing in media containing 1.0 mg/ml G-418. Out of several G-418–resistant clones, two clones, in which the transgene was most intensely expressed, were used for further experiments.
DNA Content Analysis.
The DNA content of cultured cells was examined by staining with propidium iodide and then analyzed on a FACSort™ (Becton Dickinson) as previously described (7).
Assays for Caspase-3 Activities.
Caspase-3 activities were measured with the PhiPhiLux-G1D2 kit (OncoImmunin). In this system, caspase-3 activities are measured by fluorescence that is derived from the cleaved substrate specific for caspase-3.
Northern Blot Analysis.
Northern blot analysis was performed as previously described (21). Membranes were hybridized with 32P-labeled Anamorsin probe (nucleotides 255–564 of Anamorsin cDNA: BamHI fragment) and β-actin probe (as a loading control) in rapid hybridization buffer (Amersham Biosciences).
Anti-Anamorsin mAbs.
Three kinds of rat mAbs against murine Anamorsin (named KM3048, KM3052, and KM3056) were generated according to methods previously described (22). The sequences of the synthesized peptide antigens were CLFLKEPVETAEVNNDKMKTASKL (Anamorsin 1, amino acid residues 92–115), CRVTGKKPNFEVGSSSQ (Anamorsin 2, amino acid residues 158–173), and CGLAEELEREQSKAQSSQPKSA (Anamorsin 3, amino acid residues 249–270), respectively. All antibodies used were appropriate for immunoblotting, immunoprecipitation, and immunofluorescence staining.
Immunofluorescence Staining.
Ba/F3 cells were attached to Silane-coated slide glasses (DakoCytomation) by cytospin centrifugation (Shandon, Inc.). Cytospin preparations were fixed with methanol at 4°C for 10 min, washed three times in PBS, blocked in PBS containing 1% BSA and 10% mouse serum for 30 min, and then incubated with 10 μg/ml of an anti-Anamorsin mAb for 1 h. These slides were next incubated with FITC-conjugated goat anti–rat IgG (1:50 dilution; ICN Biomedicals) for 1 h, washed twice in PBS containing 0.2 μg/ml DAPI, and observed by fluorescent microscopy.
Lac-inducible System.
To express the dominant negative H-Ras gene (H-RasS17N), we used a LacSwitch II–inducible expression system (Stratagene) as previously described (7). In this system, isopropyl-β-D-thiogalactopyranoside (IPTG) is added to the culture medium causing the Lac repressor to be released from the lactose operon and transcription of the targeted cDNA (H-RasS17N in this case) is initiated.
Genotypic Analyses.
High molecular weight genomic DNA was extracted from tails or whole embryos, digested with SacI, and subjected to electrophoresis on 0.8% agarose gels. Southern blot analysis was performed with a 5′ flanking probe. The sequences of primers used for PCR analysis were as follows: α, 5′-ACCTTCGGAAAAGTAGTCGGGTGCTCTTAC-3′; β, 5′-CGCATCGCCTTCTATCGCCTTCTTGACGAG-3′; γ, 5′-GTGTCTAAAACCCATGACCTTTCACCAG-3′. Genomic DNA from the wild-type allele yields a 310-bp fragment with a primer pair α/β, and that from the targeted allele yields a 730-bp fragment with primer pair α/γ.
Treatments of the Embryos.
Embryos of the stated age were dissected free of maternal tissues and photographed, and then fixed in 10% buffered formalin and embedded in paraffin. 4-μm thick sections were cut and stained. Cell suspensions were isolated from FLs and subjected to flow cytometric analysis, morphologic analysis of cytospin preparations, and methylcellulose colony assay analysis.
Colony Assays.
104 FL cells were obtained from Anamorsin+/+ (n = 10), Anamorsin+/− (n = 36), and Anamorsin−/− (n = 11) embryos at E14.5, and cultured in methylcellulose medium containing the cytokine cocktail, SCF, IL-3, IL-6, and EPO (MethoCult; StemCell Technologies Inc.). The numbers of hematopoietic colonies were counted under phase contrast light microscopy after 8 d in culture. Also, 105 FL cells isolated from Anamorsin+/+ (n = 11), Anamorsin+/− (n = 40), and Anamorsin−/− (n = 6) embryos at E14.5 were cultured with SCF and EPO for 8 d, and the numbers of burst-forming unit-erythroid (BFU-E) colonies were counted.
Flow Cytometry Analysis.
5 × 10⁵ cells were incubated with 2 μl avidin-conjugated anti–mouse Ter-119 mAb (BD Biosciences; reference 23) at 4°C for 30 min and washed twice in PBS. Cells were incubated with 2 μl biotin-PE (Becton Dickinson) and annexin V–FITC (Immunotech; reference 24) at 4°C for 30 min, washed twice in PBS, and then analyzed on a FACSort™ (Becton Dickinson). Cells were also stained with PE-conjugated anti–mouse CD44 mAb (BD Biosciences). For CD34, c-kit, and Ter-119 staining, cells were first incubated with rat anti–mouse CD34 mAb (Caltag Laboratories), biotin-conjugated rat anti–mouse c-kit mAb (Immunotech), or avidin-conjugated anti–mouse Ter-119 mAb, and then incubated with FITC-conjugated anti–rat IgG (BD Biosciences), streptavidin-PE (Becton Dickinson), or biotin-FITC (Becton Dickinson), respectively. Appropriate isotype control antibodies were used. Cell surface expression of the different markers were analyzed on a FACSort™ (Becton Dickinson).
Immunoblotting.
Isolation of total cellular lysates, gel electrophoresis, and immunoblotting were performed according to methods previously described (25). In brief, the embryo limbs were lysed in lysis buffer containing protease and phosphatase inhibitors. Insoluble fractions were removed by centrifugation. Whole cell lysates were separated by SDS-PAGE and transferred to PVDF membrane (Immobilon; Millipore). Membranes were blocked in TBS-T with 2% BSA for 1.5 h and incubated with 10 μg/ml of an anti-Anamorsin mAb for 1.5 h. Immunoreactive proteins were visualized by a horseradish peroxidase–conjugated anti–rat IgG Ab with ECL system (Amersham Biosciences). To reprobe with an anti-GAPDH Ab (American Research Products), membranes were incubated in stripping buffer at 70°C for 1 h, washed, and reused.
cDNA Microarray Analysis.
We performed a cDNA microarray analysis with IntelliGene II Mouse CHIP (TaKaRa Shuzo Co.). In brief, poly(A)+ mRNA was prepared from total RNA using Oligotex-dT30 Super mRNA Purification Kit (TaKaRa Shuzo Co.). 1-μg aliquots of mRNA from E14.5 Anamorsin+/+ and Anamorsin−/− FL cells were labeled with Cy3-dUTP and Cy5-dUTP (Amersham Biosciences), respectively, using an RNA Fluorescence Labeling Core Kit (M-MLV version; TaKaRa Shuzo Co.). Labeled probes were mixed with hybridization solution (6× SCC, 0.2% SDS, 5× Denhardt's solution, 0.1 mg/ml denatured salmon sperm DNA). After hybridization for 16 h at 55°C, the slides were washed twice in 2× SSC and 0.1% SDS for 5 min at 55°C, washed in 2× SSC and 0.1% SDS for 5 min at 65°C, and washed in 0.05× SSC for 5 min at room temperature. The slides were scanned using the Affymetrix 428 scanner (Affymetrix, Inc.). The signal intensity of hybridization was evaluated photometrically by the ImaGene computer program (BioDiscovery) and normalized to the averaged signals of housekeeping genes. A cut off value for each expression level was calculated according to the background fluctuation. The fluctuation can be estimated as the variance of the ratio of Cy5/Cy3.
RT-PCR Assays.
Total RNA was isolated from E14.5 Anamorsin+/+ FL cells and Anamorsin−/− FL cells with TRIsol reagent (GIBCO BRL). 1.5 μg total RNA was reverse transcribed to first strand cDNA with Moloney murine leukemia virus transcriptase (MMLV-RT; Invitrogen) in the presence of dNTPs, oligo(dT) (Roche), RNasin (Promega), and DTT in a total volume of 30 μl for 60 min at 42°C, followed by heating for 10 min at 75°C. PCR was performed in a total volume of 50 μl with 5 μl reverse-transcribed product, 2.5 U Taq-polymerase, dNTPs, and 0.5 μM primers in 1× PCR buffer. The sequences of primer sets are as follows: Jak2, (sense) 5′-GTTCTTACCGAAGTGCGTGCGA-3′ and (antisense) 5′-GGTAATGGTGTGCATCGCAGTT-3′); Bcl-xL, (sense) 5′-CACTGTGCGTGGAAAGCGTA-3′ and (antisense) 5′-AAAGTGTCCCAGCCGCC-3′; GAPDH, (sense) 5′-AATGTGTCCGTCGTGGATCTGA-3′ and (antisense) 5′-GATGCCTGCTTCACCACCTTCT-3′.
Online Supplemental Material.
Table S1 shows the data of cDNA microarray analysis concerning the apoptosis-related genes within IntelliGene II Mouse CHIP. Table S1 is available at http://www.jem.org/cgi/content/full/jem.20031858/DC1.
Results
Isolation of Anamorsin by Expression Cloning from IL-3–independent Subline Ba/F3-Ad.
We have established a subline named Ba/F3-Ad that can grow and survive under IL-3–deprived conditions from a murine IL-3–dependent cell line, Ba/F3 (unpublished data). To identify the molecule(s) that conferred the observed resistance to factor-deprived apoptosis on Ba/F3, we performed expression cloning by constructing a retroviral cDNA library from IL-3–starved Ba/F3-Ad according to the procedure previously described (26). In short, we infected the retrovirus library into parental Ba/F3 (5 × 10⁵ clones, the average size of the inserts, 1.3 kb; the infection efficacy was estimated to be ∼35%) and screened the clones that survived under IL-3–starved conditions for more than 1 wk and then started to proliferate in the medium containing IL-3. After isolation of several clones that survived under IL-3–deprived conditions, we isolated the integrated cDNA from genomic DNA extracted from one clone by the PCR method.
cDNA and Amino Acid Sequence of Anamorsin.
By sequencing the integrated cDNA, we found that the coding region of a murine protein, Anamorsin, cDNA consisted of 930 bp (Fig. 1 a). Comparison with a DNA database search revealed that the sequence of Anamorsin does not exhibit homology with any known antiapoptotic molecules, including Bcl-2 family proteins, caspase inhibitors, or signal transduction molecules. Also, we found a human homologue of Anamorsin in GenBank data libraries, which revealed 82.6% similarity to murine Anamorsin at the DNA level and 81.9% similarity at the amino acid level. The human homologue of Anamorsin was originally found by Loftus et al. (27) as a molecule with unknown function on chromosome 16 (sequence data are available from GenBank/EMBL/DDBJ under accession no. AC004382). Anamorsin encodes a protein with a molecular weight of ∼37 kD and the protein sequence database indicates that Anamorsin has a generic methyltransferase motif around amino acids 60–99 (Fig. 1 a).
Figure 1.
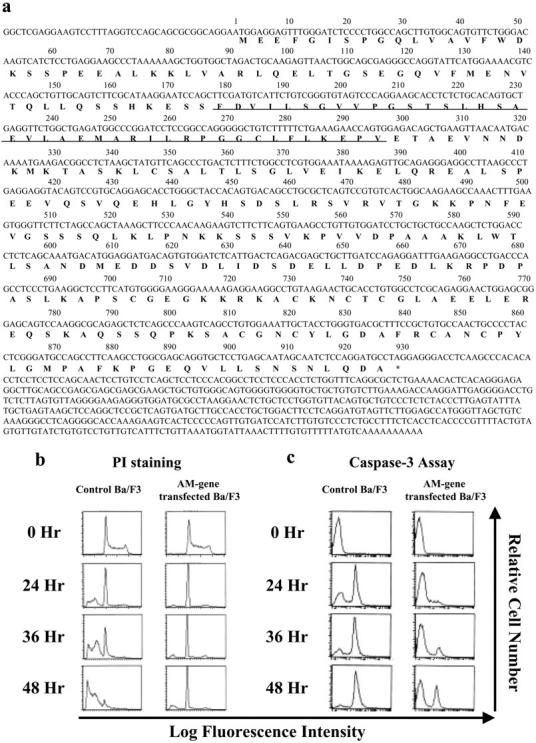
Anamorsin confers resistance to apoptosis caused by IL-3 depletion in Ba/F3 cells. (a) Anamorsin cDNA sequence and corresponding amino acid sequence. The underlined amino acid sequence shows generic methyltransferase motif. (b and c) Ba/F3 cells transfected with an empty vector or Anamorsin (AM) cDNA were deprived of IL-3 for the time indicated and the apoptotic cells were subjected to DNA content analysis (b) and caspase-3 assays (c).
Anamorsin Confers Resistance to Apoptosis Induced by IL-3 Depletion.
First, we examined whether Anamorsin was actually involved in resistance to factor-deprived apoptosis of Ba/F3-Ad. For this purpose, we stably expressed murine Anamorsin cDNA in parental Ba/F3 cells and investigated sensitivity to IL-3–deprived apoptosis. In control Ba/F3 cells, the subdiploid fraction formed from apoptotic cells emerged as early as 24 h after IL-3 depletion, but this fraction was effectively reduced in Anamorsin-transfected Ba/F3 cells (percent of apoptotic fraction: control Ba/F3, 37% at 24 h, 64% at 36 h, and 86% at 48 h; Anamorsin-transfected Ba/F3, 7% at 24 h, 11% at 36 h, and 20% at 48 h; Fig. 1 b). In agreement with this finding, the activation of caspase-3, which is detected as a shift in fluorescent intensity, was significantly suppressed in Anamorsin-transfected Ba/F3 cells as compared with that seen in control Ba/F3 cells (Fig. 1 c). However, it should be noted that Anamorsin alone could not support the growth of Ba/F3 cells because the number of proliferating cells dramatically decreased in Anamorsin-transfected Ba/F3 cells under IL-3–deprived conditions (percent of the cells in S-G2/M phase before and after IL-3 depletion: 56% at 0 h vs. 6% at 48 h; Fig. 1 b, right). Furthermore, Anamorsin-transfected cells were found to become small and enter G0 phase after IL-3 depletion (unpublished data). We also confirmed that Anamorsin confers resistance to apoptosis caused by IL-3 depletion in another murine IL-3–dependent cell line, 32D (unpublished data).
The Expression Profile of Anamorsin and Its Regulation by Cytokines.
Next, we examined the expression profile of the human Anamorsin homologue in various organs using MTA panels (CLONTECH Laboratories, Inc.). As shown in Fig. 2 a, left, the homologue was expressed ubiquitously in various tissues, with especially high expression levels detected in heart, liver, and pancreas. As for hematopoietic tissues, the homologue was abundantly expressed in FL and spleen (Fig. 2 a, right). Also, we found that expression of Anamorsin was detectable in early stages (7 d) of embryogenesis by the PCR method (not depicted).
Figure 2.
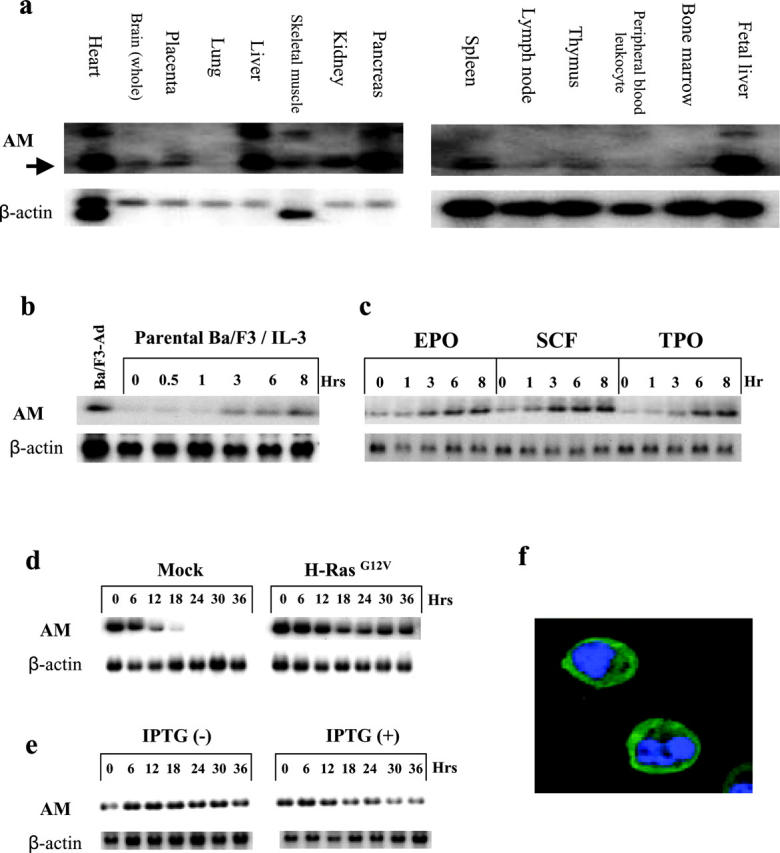
Anamorsin (AM) was expressed ubiquitously in various tissues and its expression was induced by various cytokines through the Ras signaling pathway. (a) The expression of the human Anamorsin homologue in various human organs (MTC panels, CLONTECH Laboratories, Inc.) was examined by Northern hybridization. (b) Ba/F3 cells were IL-3 depleted for 15–18 h and then cultured with 0.1 ng/ml mIL-3 for the time indicated. Induction of Anamorsin gene was examined by Northern blot analysis. Ba/F3-Ad, Ba/F3-Ad in the absence of IL-3. (c) Ba/F3 cells each transfected with EPO receptor, c-kit, and c-mpl were deprived of IL-3 for 15–18 h and cultured with 5 u/ml mEPO, 100 ng/ml mSCF, and 30 ng/ml mTPO, respectively, for the time indicated. Induction of Anamorsin gene was examined by Northern blot analysis. (d) Ba/F3 cells transfected with an empty vector (Mock) or oncogenic H-Ras (H-RasG12V) were deprived of IL-3 for the time indicated. The expression levels of Anamorsin were examined by Northern blot analysis. (e) Ba/F3 cells, in which dominant negative H-Ras (H-RasS17N) was inducibly expressed by a LacSwitch-II–inducible expression system, were cultured with IL-3 in the presence or absence of IPTG for the time indicated. The expression levels of Anamorsin were examined by Northern blot analysis. (f) The localization of Anamorsin was examined by an immunofluorescence staining with an anti-Anamorsin mAb. Nucleus was visualized with staining with DAPI. Green, Anamorsin; blue, nucleus.
Because Anamorsin was supposed to exert antiapoptotic effects in Ba/F3-Ad under IL-3–deprived conditions, we examined its expression levels in parental Ba/F3 and Ba/F3-Ad after IL-3 depletion. As expected, Anamorsin was still expressed in Ba/F3-Ad after 18 h of IL-3 deprivation, whereas its expression was hardly detectable in parental Ba/F3 cells (Fig. 2 b, lane 1 vs. 2). However, the addition of IL-3 recovered expression in parental Ba/F3 cells after 3 h (Fig. 2 b, lanes 2–7). Next, we investigated whether expression of Anamorsin was also regulated by other cytokines in Ba/F3 cells. After IL-3 depletion, clones of Ba/F3 that expressed receptors for EPO, SCF (c-Kit), and TPO (c-Mpl) were cultured with their corresponding cytokines for the time indicated. As shown in Fig. 2 c, EPO, SCF, and TPO individually induced expression of Anamorsin as efficiently as IL-3, suggesting that expression of Anamorsin would be regulated by the common signaling molecule(s) shared by various cytokines. Based on the fact that Ras is activated by various cytokines and was constitutively activated in Ba/F3-Ad (unpublished data), we speculated that Ras might control expression of Anamorsin in Ba/F3 cells. To examine this possibility, we stably expressed oncogenic H-Ras (H-RasG12V) in Ba/F3 cells. Also, we prepared a clone from Ba/F3, in which dominant negative H-Ras (H-RasS17N) was inducibly expressed by the IPTG treatment. As expected, the Ba/F3 cells expressing constitutively active H-Ras survived under IL-3–starved conditions better than control Ba/F3 cells. In contrast, the Ba/F3 cells expressing dominant negative H-Ras died more rapidly after IL-3 withdrawal than control Ba/F3 cells. In Ba/F3 cells transfected with H-RasG12V, expression of Anamorsin was maintained after IL-3 depletion for up to 36 h, whereas its expression declined to undetectable levels in a mock clone transfected with empty vector (Fig. 2 d). Furthermore, induced expression of H-RasS17N led to reduction of Anamorsin expression, even in the presence of IL-3 (Fig. 2 e). Collectively, these results suggest that expression of Anamorsin is completely dependent on cytokine stimulation and, at least partially, regulated by Ras signaling in Ba/F3 cells. Next, we investigated the intracellular localization of Anamorsin using immunofluorescence staining with an anti-Anamorsin mAb. As shown in Fig. 2 f, Anamorsin was exclusively localized in the cytoplasm of Ba/F3 cells, regardless of stimulation with IL-3.
Generation of Anamorsin-null Mice.
To assess in vivo roles of Anamorsin, we tried to generate Anamorsin-null (Anamorsin−/−) mice. We constructed a targeting vector, in which the first exon was replaced by the neomycin-resistant cassette (a positive selection marker). The vector also included diphtheria toxin as a negative selection marker (Fig. 3 a). The targeting vector was introduced into an embryonic stem (ES) cell line R1 by electroporation and transfected cells were cultured with 150 μg/ml G418. We confirmed homologous recombination in selected ES cell lines by Southern blot and PCR analyses. As expected from Fig. 3 a, the wild-type allele was detected as a 5-kb SacI fragment in Southern blot analysis with a 5′ flanking probe, whereas the targeted allele was detected as a 13-kb SacI fragment (unpublished data). Also, in PCR analyses, the 310-bp fragment was amplified from the wild-type allelic genomic DNA with a primer pair α/β, whereas the 730-bp fragment was amplified from the targeted allelic genomic DNA with a primer pair α/γ (unpublished data). To generate chimeras, we injected three ES cell lines that were confirmed to contain the homologous recombination into blastocysts of C57BL/6J mice. Male offspring with a high degree of chimerism were crossed with C57BL/6J females to generate Anamorsin+/− mice. Genotyping was performed by Southern blot and PCR analyses using tail- and embryo-derived DNA (Fig. 3, b and c). Finally, we confirmed that expression of Anamorsin protein in the limb was partially reduced in Anamorsin+/− embryos and completely lost in Anamorsin−/− embryos by Western blot analysis using an anti-Anamorsin mAb (Fig. 3 d).
Figure 3.

Targeted disruption of the murine Anamorsin locus. (a) Partial restriction map of the murine Anamorsin locus and the targeting construct. The first to fifth exons of Anamorsin gene are indicated as closed boxes in the top diagram. K, KpnI; S, SpeI; Sa, SacI; Sm, SmaI; X, XhoI. (b) Southern blot analysis was preformed with genomic DNA extracted from tails of embryos by hybridizing with a 5′ flanking probe. The wild-type allele is detected as a 5-kb SacI fragment and the targeted allele as a 13-kb SacI fragment. (c) PCR analysis was performed with primer pairs α/β and α/γ. Genomic DNA from the wild-type allele yields a 310-bp fragment with a primer pair α/β, and that from the targeted allele yields a 730-bp fragment with a primer pair α/γ. (d) Western blot analysis was performed on total cellular lysates obtained from limb of embryos with the indicated genotypes using an anti-Anamorsin mAb.
Anamorsin-null Mice Are Lethal at Late Gestation Due to the Defect of Hematopoiesis.
Genotypic analysis of embryos from Anamorsin+/− mice intercrosses revealed that Anamorsin−/− embryos began to die between E12.5 and E14.5. The rate of dead Anamorsin−/− embryos increased after E14.5 (0% until E12.5, 18.8% at E14.5, 36.4% at E16.5, and 44.4% at E18.5) and all Anamorsin−/− mice died at birth, suggesting that Anamorsin−/− mice expire in late gestation (Table I). Anamorsin−/− embryos were smaller in body size than Anamorsin+/+ embryos, whereas Anamorsin+/− embryos displayed phenotypes similar to Anamorsin+/+ embryos (Fig. 4 a). Despite no significant difference in the formation of blood islands in yolk sacs, the FLs and spleens of Anamorsin−/− embryos were remarkably smaller than those of Anamorsin+/+ embryos. The size of FL of Anamorsin−/− embryos was about one third of that of Anamorsin+/+ embryos, and the spleen of Anamorsin−/− embryos appeared scarce (Fig. 4 b). Furthermore, Anamorsin−/− embryos later than E14.5 looked anemic (Fig. 4 a). Anamorsin−/− embryos at E18.5 showed nearly half of RBCs, hemoglobin, and hematocrit in the peripheral blood (RBC: 365 ± 50.8, 335.5 ± 50.6, and 210 ± 67.0×10⁴/mm3; hemoglobin: 11.7 ± 1.5, 10.6 ± 1.3, and 6.7 ± 2.3 g/dl; hematocrit: 39.7 ± 5.8, 37.8 ± 5.3, and 26.3 ± 7.6% in Anamorsin+/+ [n = 10], Anamorsin+/− [n = 22], and Anamorsin−/− [n = 8] embryos, respectively). Moreover, RBCs of Anamorsin−/− embryos were macrocytic (mean corpuscular volume in Anamorsin+/+, Anamorsin+/−, and Anamorsin−/− embryos were 108.8 ± 4.3, 113.1 ± 9.5, and 128.2 ± 16.6, respectively). In addition to defects in hematopoietic organs, the heart walls of Anamorsin−/− embryos were thinner than those in Anamorsin+/+ or Anamorsin+/− embryos, whereas Anamorsin−/− embryos displayed no apparent macroscopic or histological abnormalities in other organs (not depicted). It was unlikely that the abnormality in the heart walls caused death in Anamorsin+/− embryos.
Table I.
Genotypes of Embryos from Timed Pregnancies
| Stage | AM+/+ a | AM+/− | AM−/− | Total No. |
|---|---|---|---|---|
| E10.5 | 6 | 17 | 5 | 28 |
| E12.5 | 7 | 14 | 4 | 25 |
| E14.5 | 17 | 68 | 16 (3b) | 101 (3b) |
| E16.5 | 15 | 16 | 11 (4b) | 42 (4b) |
| E18.5 | 12 | 32 | 9 (4b) | 53 (4b) |
| At birth | 15 | 45 | 6 (6c) | 66 (6c) |
AM, Anamorsin.
Number of embryos absorbed in uterus.
Number of dead babies.
Figure 4.
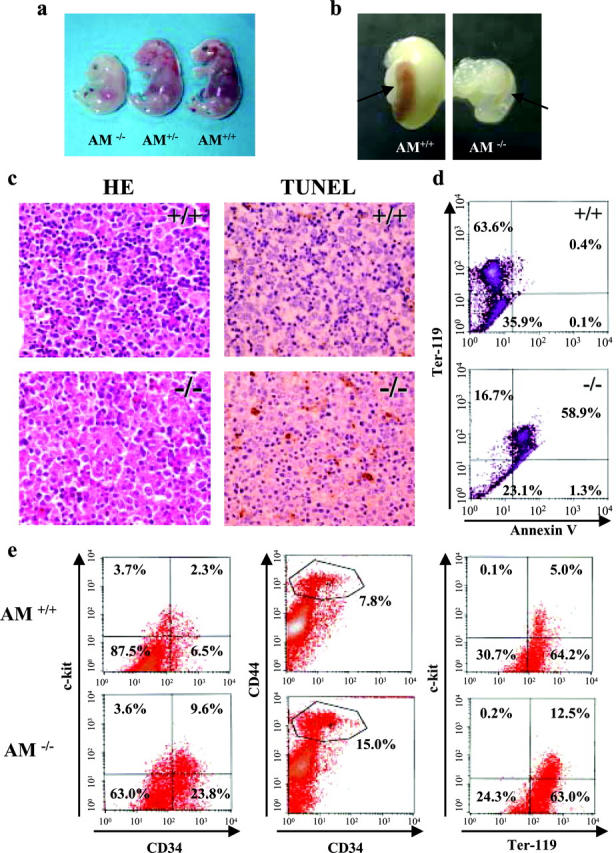
Phenotypes of Anamorsin (AM)−/− embryos, spleens, and FLs. (a) E16.5 embryos of Anamorsin−/− and the littermate control are shown. (b) The spleens (arrows) with stomach of Anamorsin+/+ and Anamorsin−/− mice at birth are shown. (c) Transverse sections of FL at E14.5 obtained from Anamorsin+/+ (top) or Anamorsin−/− (bottom) embryos were stained with hematoxylin and eosin for histological examination (left) and with TUNEL to detect apoptotic cells (right). Apoptotic cells are stained with brown in this TUNEL assay. ×400. (d) Cell suspensions isolated from Anamorsin+/+ (top) and Anamorsin−/− (bottom) FL cells at E14.5 were stained with anti–Ter-119 and annexin V, and subjected to flow cytometric analysis. (e) The proportions of CD34+ c-kit+, CD34low CD44high, and Ter-119+ c-kit+ cells in Anamorsin+/+ and Anamorsin−/− FL cells at E14.5. Cell suspensions isolated from Anamorsin+/+ (top) and Anamorsin−/− (bottom) FL cells at E14.5 were stained with anti–c-kit, anti-CD34, anti-CD44, or anti–Ter-119, and subjected to flow cytometric analysis.
Erythroid Cells Undergo Apoptosis in the FL of Anamorsin−/− Mice.
To clarify the mechanism of anemia seen in Anamorsin−/− embryos, we analyzed the FL, the main hematopoietic organ of the late embryonic stage (28). The number of morphologically identifiable small-sized erythroid cells (erythroblasts) with condensed chromatin nucleus was apparently reduced in FL of Anamorsin−/− embryos compared with that of controls (Fig. 4 c). Furthermore, erythroblasts were larger in Anamorsin−/− embryos than in Anamorsin+/+ embryos, and more mature erythroblasts (i.e., polychromatic and orthochromatic erythroblasts) markedly decreased in Anamorsin−/− embryos (Fig. 5, a and b). In addition, TUNEL assays showed that a substantial fraction of FL cells were apoptotic (stained by brown) at E14.5 in Anamorsin−/− embryos, whereas these apoptotic cells were hardly detected in Anamorsin+/+ embryos (Fig. 4 c). To determine which type of cells undergo apoptosis, we performed flow cytometric analysis using Anamorsin+/+ and Anamorsin−/− FL cells at E14.5. Although annexin V+ apoptotic cells were scarcely (only 0.5%) detected in Anamorsin+/+ FL cells, 60.2% of isolated cells were positive for annexin V in Anamorsin−/− FL (Fig. 4 d). Most importantly, almost all of these apoptotic cells were Ter-119+ erythroid cells, but not Ter-119− cells, mainly composed from hepatocytes (Fig. 4 d). Furthermore, although the cell number of Anamorsin−/− FL cells at E14.5 was approximately one third of Anamorsin+/+ FL cells (unpublished data), the proportions of CD34+ c-kit+ cells, CD34low CD44high cells, or Ter-119+ c-kit+ cells in Anamorsin−/− FL cells at E14.5 was two to four times higher than those in Anamorsin+/+ FL cells (CD34+ c-kit+, 9.6 vs. 2.3%; CD34low CD44high, 15.0 vs. 7.8%; Ter-119+ c-kit+, 12.5 vs. 5.0%; Fig. 4 e), indicating that neither the absolute number of hematopoietic stem/progenitor cells (CD34+ c-kit+ or CD34low CD44high) nor that of very immature proerythroblasts (Ter-119+ c-kit+) decreased in Anamorsin−/− FL. Based on these data, it was speculated that immature hematopoietic cells of Anamorsin−/− mice may succumb to apoptosis and fail to attain terminal differentiation.
Figure 5.
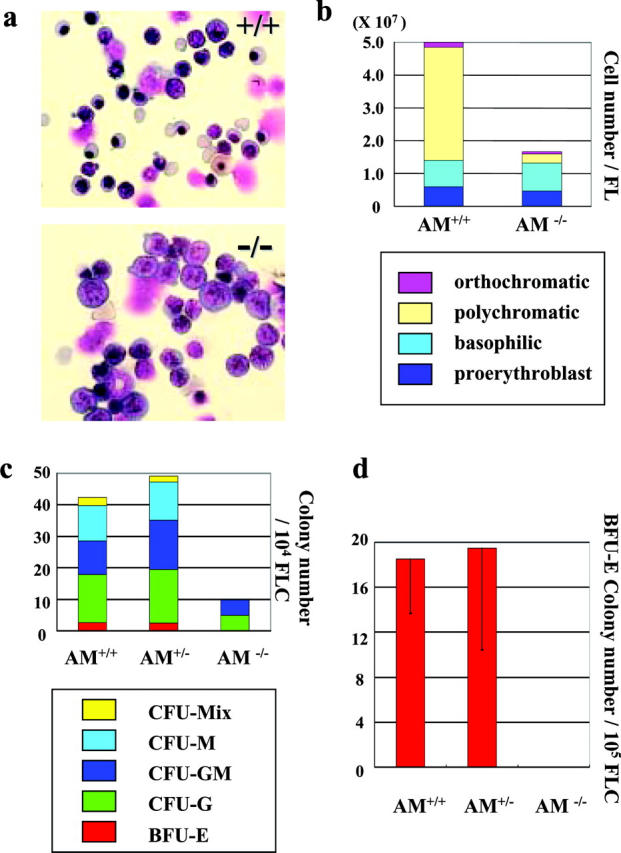
Anamorsin−/− erythroid progenitors could not differentiate in vivo and in vitro. (a and b) Cell suspensions isolated from Anamorsin (AM)+/+ and Anamorsin−/− FL at E16.5 were subjected to cytospin centrifugation, stained with May-Grunwald-Giemsa, and analyzed under light microscopy. ×1,000 (a). The number of erythroid cells at each maturation stage was counted (b). (c and d) 104 FL cells at E14.5 obtained from Anamorsin+/+, Anamorsin+/−, and Anamorsin−/− mice were cultured in the methylcellulose containing SCF, IL-3, IL-6, and EPO, and the number of hematopoietic colonies were counted after 8-d cultures (c). Also, 105 FL cells at E14.5 were cultured with SCF and EPO for 8 d, and the number of BFU-E colonies was counted (d).
Colony Assays of the Anamorsin-null FL Cells.
Next, we examined whether hematopoietic stem/progenitor cells of Anamorsin−/− FL cells could survive, proliferate, and differentiate in response to cytokines in vitro. When E14.5 Anamorsin+/+, Anamorsin+/−, or Anamorsin−/− FL cells were cultured in methylcellulose with the combination of cytokines SCF, IL-3, IL-6, and EPO, the number of myeloid (granulocyte/macrophage and granulocyte) colonies formed from Anamorsin−/− FL cells was one third to one fourth of those formed by Anamorsin+/+ FL cells. Notably, Anamorsin−/− FL cells gave rise to little or no mixed (myeloid/erythroid) or erythroid colonies, whereas such colonies developed from Anamorsin+/− and Anamorsin+/+ FL cells (Fig. 5 c). Furthermore, BFU-E colonies did not develop when E14.5 Anamorsin−/− FL cells were cultured with SCF and EPO (Fig. 5 d). These results suggest that Anamorsin is essential for cytokine-dependent survival and growth of hematopoietic stem/progenitor cells in vitro, especially those of erythroid lineage.
The Expression of Jak2 and Bcl-xL mRNA Was Down-regulated in Anamorsin-null FL Cells.
To characterize the antiapoptotic function of Anamorsin, we compared gene expression profiles between Anamorsin−/− and Anamorsin+/+ FL cells at E14.5 using a cDNA microarray. Among 4289 genes, including Bcl-2 family, caspases, cytokines, and signal transduction molecules, 184 genes were significantly down-regulated and 40 were up-regulated in Anamorsin−/− FL. Among apoptosis-related genes, Bcl-xL and Jak2 were down-regulated most significantly. We also confirmed that expression of these two molecules was decreased in Anamorsin−/− FL cells compared with Anamorsin+/+ FL cells by semiquantitative RT-PCR assays (Fig. 6 and Table S1, available at http://www.jem.org/cgi/content/full/jem.20031858/DC1).
Figure 6.

RT-PCR analysis on the expression of Jak2 and Bcl-xL mRNA in Anamorsin−/−, Anamorsin+/−, and Anamorsin+/+ FL cells. Total RNA was isolated from E14.5 Anamorsin−/−, Anamorsin+/−, and Anamorsin+/+ FL cells. 1.5 μg total RNA was reverse transcribed to first strand cDNA and subjected to PCR reactions. After the indicated cycles of PCR reaction, PCR products were electrophoresed on agarose gels and visualized with ethidium bromide staining.
Discussion
We have identified a novel antiapoptotic molecule, Anamorsin, by using expression cloning with the cytokine-independent subline Ba/F3-Ad. Although Anamorsin was constitutively expressed in Ba/F3-Ad, its expression was completely dependent on cytokine stimulation in Ba/F3 cells. It has been reported that IL-3, TPO, and SCF simultaneously activate the Ras/Raf/MEK/ERK pathway, (Ras)/PI3K/Akt pathway, and STATs in Ba/F3 cells, and that each of these signaling pathways can transmit antiapoptotic signals from these cytokines (5, 6). Among these pathways, cytokine-activated Ras was involved, at least partially, in the induction of Anamorsin. Although expression of Anamorsin mRNA was supposed to be transcriptionally regulated by cytokine stimulation, this expression was only detectable at relatively late phases (from after 3 h), suggesting that this induction is not an immediate early response. Therefore, it is important to identify the molecule(s) that connects Ras signals to expression of Anamorsin. It is also necessary to examine whether other signaling pathways such as STATs and PI-3K/Akt pathway might contribute to induction of Anamorsin.
Anamorsin expression profiles showed that besides hematopoietic organs, Anamorsin was abundantly expressed in liver, heart, and skeletal muscle. Because Anamorsin was expressed in heart tissue, we compared hearts of Anamorsin+/+, Anamorsin+/−, and Anamorsin−/− embryos, and found that heart walls of Anamorsin−/− embryos were thinner than those of Anamorsin+/+ or Anamorsin+/− mice. These results suggest that cells in these organs might also receive cytokine stimulation and Anamorsin might play some roles in cell survival of these cells. In fact, hepatocyte growth factor acts as a crucial regulator of cell growth and survival for hepatocytes (29), IL-6–type cytokines (i.e., cardiotrophin-1, leukemia inhibitory factor, and oncostatin M) for cardiac myocytes (30), and insulin-like growth factor 1, leukemia inhibitory factor, and hepatocyte growth factor for skeletal muscle cells (31). Therefore, it might be interesting to investigate whether expression of Anamorsin is also regulated by these growth factors in nonhematopoietic cells. In contrast to hematopoietic cells and cardiac myocytes, however, FL hepatocytes did not undergo apoptosis. Also, no apparent abnormality was detected in skeletal muscle of Anamorsin−/− mice. These findings suggest that the antiapoptotic roles of Anamorsin might be replaced by other molecule(s) in these cells. Furthermore, it is possible that Anamorsin might be a member of a new family of proteins and other family members might exist in these tissues.
Although expression of Anamorsin was detectable in the early stage of embryos, Anamorsin was not required for survival and development of early embryos. Moreover, primitive hematopoiesis in the yolk sac of Anamorsin−/− embryos seemed normal as judged from its histology. In contrast, Anamorsin−/− erythroid progenitor cells in FL could not proliferate or differentiate in response to cytokine stimulation in colony assays, and underwent apoptosis after the basophilic erythroblast stage in vivo. However, Anamorsin did not affect transcription of ɛy2-globin (embryonic-type), β-major-globin (adult-type), or α-globin (embryonic- and adult-type) because all these globins were normally expressed in Anamorsin−/− FL erythrocytes (unpublished data). From these data, it was assumed that in spite of its essential role as a survival factor, Anamorsin would not be involved in differentiation of erythrocytes.
We speculate that the main cause of death in Anamorsin−/− embryos was anemia because we could not find severe abnormalities in any organs except FL and spleen. By generating KO mice, a number of molecules were shown to be required for primitive and/or definitive hematopoiesis: cytokines and their receptors, EPO/EPO receptor (3), Angiopoietin-1/Tie-2 (32), and Flk1 (VEGF2 receptor; reference 33); signal transduction molecules, Jak2 (34) and p38αMAPK (35); transcription factors, c-Myb (36), GATA-1 (37), GATA-2 (38), GATA-3 (39), FOG-1 (40), AML-1 (41), SCL (42), LMO-2 (43), CBFβ (44), and EKLF (45); Bcl-2 family members, Bcl-xL (46) and DNaseII (47). As was seen in Anamorsin−/− mice, defects in Angiopoietin-1, Jak2, p38αMAPK, c-Myb, GATA-3, AML-1, CBFβ, EKLF, Bcl-xL, or DNaseII genes disrupted definitive hematopoiesis but not primitive hematopoiesis. To determine which molecule is responsible for the observed antiapoptotic effects of Anamorsin, it might be useful to measure expression levels of these molecules in Anamorsin−/− mice. At present, we have found that expression of Jak2 and Bcl-xL was down-regulated in Anamorsin−/− mice by using cDNA microarray and RT-PCR analyses. Because the Jak2/Stat5 pathway was reported to regulate expression of Bcl-xL (15, 16, 48), it was speculated that Jak2 might be a primary mediator of the antiapoptotic effects of Anamorsin. To examine this possibility, it would be effective to recover Jak2 and/or Bcl-xL expression in Anamorsin−/− hematopoietic cells in in vitro and in vivo assays.
In this study, we have shown that Anamorsin is a critical molecule in cytokine-dependent cell survival of hematopoietic cells. In addition, our preliminary studies suggested that Anamorsin expression may not only protect cells against cytokine withdrawal, but also against other apoptotic stimuli because Anamorsin-expressing Ba/F3 cells were less susceptible to apoptosis after treatment with etoposide, γ radiation, or staurosporine than IL-3–starved Ba/F3 cells in which Anamorsin expression was scarcely observed. Further studies on Anamorsin would indubitably reveal a new mechanism underlying antiapoptotic effects of hematopoietic growth factors and might be useful to establish novel therapeutic strategies to correct ineffective hematopoiesis.
Acknowledgments
We thank Dr. T. Kitamura (Tokyo University, Tokyo, Japan) for generous advice on the retrovirus-mediated expression cloning method, and Drs. A. Furuya and K. Shitara (Kyowa Hakko Kogyo Co. Ltd., Tokyo, Japan) for their help in making anti-Anamorsin mAbs. We also thank Drs. Y. Uno and S. Mizuno (Osaka University, Osaka, Japan) for injection of Anamorsin+/− ES clones into blastocysts, and Dr. G. Kondoh (Osaka University, Osaka, Japan) for dissection of mice.
This work was supported in part by grants from the Japanese Ministry of Education, Culture, Sports, Science and Technology, the Japanese Ministry of Health, Labor and Welfare, the Japan Society for the Promotion of Science, and Kanae Foundation for Life and Socio-Medical Science.
H. Shibayama and E. Takai contributed equally to this work.
The online version of this article contains supplemental material.
Abbreviations used in this paper: BFU-E, burst-forming unit-erythroid; EPO, erythropoietin; ES, embryonic stem; FL, fetal liver; IPTG, isopropyl-β-D-thiogalactopyranoside; SCF, stem cell factor; STAT, signal transducer and activator of transcription; TPO, thrombopoietin.
References
- 1.Lieschke, G.J., D. Grail, G. Hodgson, D. Metcalf, E. Stanley, C. Cheers, K.J. Fowler, S. Basu, Y.F. Zhan, and A.R. Dunn. 1994. Mice lacking granulocyte colony-stimulating factor have chronic neutropenia, granulocyte and macrophage progenitor cell deficiency, and impaired neutrophil mobilization. Blood. 84:1737–1746. [PubMed] [Google Scholar]
- 2.Gurney, A.L., K. Carver-Moore, F.J. de Sauvage, and M.W. Moore. 1994. Thrombocytopenia in c-mpl-deficient mice. Science. 265:1445–1447. [DOI] [PubMed] [Google Scholar]
- 3.Wu, H., X. Liu, R. Jaenisch, and H.F. Lodish. 1995. Generation of committed erythroid BFU-E and CFU-E progenitors does not require erythropoietin or the erythropoietin receptor. Cell. 83:59–67. [DOI] [PubMed] [Google Scholar]
- 4.Broudy, V.C. 1997. Stem cell factor and hematopoiesis. Blood. 90:1345–1364. [PubMed] [Google Scholar]
- 5.Miyajima, A., Y. Ito, and T. Kinoshita. 1999. Cytokine signaling for proliferation, survival, and death in hematopoietic cells. Int. J. Hematol. 69:137–146. [PubMed] [Google Scholar]
- 6.Talapatra, S., and C.B. Thompson. 2001. Growth factor signaling in cell survival: implications for cancer treatment. J. Pharmacol. Exp. Ther. 298:873–878. [PubMed] [Google Scholar]
- 7.Odajima, J., I. Matsumura, J. Sonoyama, H. Daino, A. Kawasaki, H. Tanaka, N. Inohara, T. Kitamura, J. Downward, K. Nakajima, et al. 2000. Full oncogenic activities of v-Src are mediated by multiple signaling pathways. J. Biol. Chem. 275:24096–24105. [DOI] [PubMed] [Google Scholar]
- 8.Kinoshita, T., T. Yokota, K-i. Arai, and A. Miyajima. 1995. Regulation of Bcl-2 expression by oncogenic Ras protein in hematopoietic cells. Oncogene. 10:2207–2212. [PubMed] [Google Scholar]
- 9.Sonoyama, J., I. Matsumura, S. Ezoe, Y. Satoh, X. Zhang, Y. Kataoka, E. Takai, M. Mizuki, T. Machii, H. Wakao, et al. 2002. Functional cooperation among Ras, STAT5, and phosphatidylinositol 3-kinase is required for full oncogenic activities of BCR/ABL in K562 cells. J. Biol. Chem. 277:8076–8082. [DOI] [PubMed] [Google Scholar]
- 10.von Gise, A., P. Lorenz, C. Wellbrock, B. Hemmings, F. Berberich-Siebelt, U.R. Rapp, and J. Troppmair. 2001. Apoptosis suppression by Raf-1 and MEK1 requires MEK- and phosphatidylinositol 3-kinase-dependent signals. Mol. Cell. Biol. 21:2324–2336. [DOI] [PMC free article] [PubMed] [Google Scholar]
- 11.Datta, S.R., A. Brunet, and M.E. Greenberg. 1999. Cellular survival: a play in three Akts. Genes Dev. 13:2905–2927. [DOI] [PubMed] [Google Scholar]
- 12.Bouillet, P., D. Metcalf, D.C.S. Huang, D.M. Tarlinton, T.W.H. Kay, F. Kontgen, J.M. Adams, and A. Strasser. 1999. Proapoptotic Bcl-2 relative Bim required for certain apoptotic responses, leukocyte homeostasis, and to preclude autoimmunity. Science. 286:1735–1738. [DOI] [PubMed] [Google Scholar]
- 13.Onishi, M., T. Nosaka, K. Misawa, A.L. Mui, D. Gorman, M. McMahon, A. Miyajima, and T. Kitamura. 1998. Identification and characterization of a constitutively active STAT5 mutant that promotes cell proliferation. Mol. Cell. Biol. 18:3871–3879. [DOI] [PMC free article] [PubMed] [Google Scholar]
- 14.Fujio, Y., K. Kunisada, H. Hirota, K. Yamauchi-Takihara, and T. Kishimoto. 1997. Signals through gp130 upregulate bcl-x gene expression via STAT1-binding cis-element in cardiac myocytes. J. Clin. Invest. 99:2898–2905. [DOI] [PMC free article] [PubMed] [Google Scholar]
- 15.Socolovsky, M., A.E. Fallon, S. Wang, C. Brugnara, and H.F. Lodish. 1999. Fetal anemia and apoptosis of red cell progenitors in Stat5a−/−5b−/− mice: a direct role for Stat5 in Bcl-X(L) induction. Cell. 98:181–191. [DOI] [PubMed] [Google Scholar]
- 16.Kieslinger, M., I. Woldman, R. Moriggl, J. Hofmann, J.C. Marine, J.N. Ihle, H. Beug, and T. Decker. 2000. Antiapoptotic activity of Stat5 required during terminal stages of myeloid differentiation. Genes Dev. 14:232–244. [PMC free article] [PubMed] [Google Scholar]
- 17.Hirano, T., K. Ishihara, and M. Hibi. 2000. Roles of STAT3 in mediating the cell growth, differentiation and survival signals relayed through the IL-6 family of cytokine receptors. Oncogene. 19:2548–2556. [DOI] [PubMed] [Google Scholar]
- 18.Devireddy, L.R., J.G. Teodoro, F.A. Richard, and M.R. Green. 2001. Induction of apoptosis by a secreted lipocalin that is transcriptionally regulated by IL-3 deprivation. Science. 293:829–834. [DOI] [PubMed] [Google Scholar]
- 19.Fox, C.J., P.S. Hammerman, R.M. Cinalli, S.R. Master, L.A. Chodosh, and C.B. Thompson. 2003. The serine/threonine kinase Pim-2 is a transcriptionally regulated apoptotic inhibitor. Genes Dev. 17:1841–1854. [DOI] [PMC free article] [PubMed] [Google Scholar]
- 20.Onishi, M., A.L. Mui, Y. Morikawa, L. Cho, S. Kinoshita, G.P. Nolan, D.M. Gorman, A. Miyajima, and T. Kitamura. 1996. Identification of an oncogenic form of the thrombopoietin receptor MPL using retrovirus-mediated gene transfer. Blood. 88:1399–1406. [PubMed] [Google Scholar]
- 21.Matsumura, I., T. Kitamura, H. Wakao, H. Tanaka, K. Hashimoto, C. Albanese, J. Downward, R.G. Pestell, and Y. Kanakura. 1999. Transcriptional regulation of the cyclin D1 promoter by STAT5: its involvement in cytokine-dependent growth of hematopoietic cells. EMBO J. 18:1367–1377. [DOI] [PMC free article] [PubMed] [Google Scholar]
- 22.Sugiyama, T., A. Furuya, T. Monkawa, M. Yamamoto-Hino, S. Satoh, K. Ohmori, A. Miyawaki, N. Hanai, K. Mikoshiba, and M. Hasegawa. 1994. Monoclonal antibodies distinctively recognizing the subtypes of inositol 1, 4, 5-trisphosphate receptor: application to the studies on inflammatory cells. FEBS Lett. 354:149–154. [DOI] [PubMed] [Google Scholar]
- 23.Kina, T., K. Ikuta, E. Takayama, K. Wada, A.S. Majumdar, I.L. Weissman, and Y. Katsura. 2000. The monoclonal antibody TER-119 recognizes a molecule associated with glycophorin A and specifically marks the late stages of murine erythroid lineage. Br. J. Haematol. 109:280–287. [DOI] [PubMed] [Google Scholar]
- 24.Koopman, G., C.P.M. Reutelingsperger, G.A.M. Kuijten, R.M.J. Keehnen, S.T. Pals, and M.H.J. van Oers. 1994. Annexin V for flow cytometric detection of phosphatidylserine expression on B cells undergoing apoptosis. Blood. 84:1415–1420. [PubMed] [Google Scholar]
- 25.Shibayama, H., N. Anzai, S.E. Braun, S. Fukuda, C. Mantel, and H.E. Broxmeyer. 1999. H-Ras is involved in the inside-out signaling pathway of interleukin-3-induced integrin activation. Blood. 93:1540–1548. [PubMed] [Google Scholar]
- 26.Kitamura, T., M. Onishi, S. Kinoshita, A. Shibuya, A. Miyajima, and G.P. Nolan. 1995. Efficient screening of retroviral cDNA expression libraries. Proc. Natl. Acad. Sci. USA. 92:9146–9150. [DOI] [PMC free article] [PubMed] [Google Scholar]
- 27.Loftus, B.J., U.J. Kim, V.P. Sneddon, F. Kalush, R. Brandon, J. Fuhrmann, T. Mason, M.L. Crosby, M. Barnstead, L. Cronin, et al. 1999. Genome duplications and other features in 12 Mb of DNA sequence from human chromosome 16p and 16q. Genomics. 60:295–308. [DOI] [PubMed] [Google Scholar]
- 28.Dzierzak, E., A. Medvinsky, and M. de Bruijn. 1998. Qualitative and quantitative aspects of haematopoietic cell development in the mammalian embryo. Immunol. Today. 19:228–236. [DOI] [PubMed] [Google Scholar]
- 29.Uehara, Y., O. Minowa, C. Mori, K. Shiota, J. Kuno, T. Noda, and N. Kitamura. 1995. Placental defect and embryonic lethality in mice lacking hepatocyte growth factor/scatter factor. Nature. 373:702–705. [DOI] [PubMed] [Google Scholar]
- 30.Yamauchi-Takihara, K., and T. Kishimoto. 2000. Cytokines and their receptors in cardiovascular diseases-role of gp130 signaling pathway in cardiac myocyte growth and maintenance. Int. J. Exp. Pathol. 81:1–16. [DOI] [PMC free article] [PubMed] [Google Scholar]
- 31.Husmann, I., L. Soulet, J. Gautron, I. Martelly, and D. Barritault. 1996. Growth factors in skeletal muscle regeneration. Cytokine Growth Factor Rev. 7:249–258. [DOI] [PubMed] [Google Scholar]
- 32.Takakura, N., X.-L. Huang, T. Naruse, I. Hamaguchi, D.J. Dumont, G.D. Yancopoulos, and T. Suda. 1998. Critical role of the Tie2 endothelial cell receptor in the development of definitive hematopoiesis. Immunity. 9:677–686. [DOI] [PubMed] [Google Scholar]
- 33.Shalaby, F., J. Ho, W.L. Stanford, K.-D. Fischer, A.C. Schuh, L. Schwartz, A. Bernstein, and J. Rossant. 1997. A requirement for Flk1 in primitive and definitive hematopoiesis and vasculogenesis. Cell. 89:981–990. [DOI] [PubMed] [Google Scholar]
- 34.Neubauer, H., A. Cumano, M. Muller, H. Wu, U. Huffstadt, and K. Pfeffer. 1998. Jak2 deficiency defines an essential developmental checkpoint in definitive hematopoiesis. Cell. 93:397–409. [DOI] [PubMed] [Google Scholar]
- 35.Tamura, K., T. Sudo, U. Senftleben, A.M. Dadak, R. Johnson, and M. Karin. 2000. Requirement for p38α in erythropoietin expression: a role for stress kinases in erythropoiesis. Cell. 102:221–231. [DOI] [PubMed] [Google Scholar]
- 36.Mucenski, M.L., K. McLain, A.B. Kier, S.H. Swerdlow, C.M. Schreiner, T.A. Miller, D.W. Pietryga, W.J. Scott, Jr., and S.S. Potter. 1991. A functional c-myb gene is required for normal murine fetal hepatic hematopoiesis. Cell. 65:677–689. [DOI] [PubMed] [Google Scholar]
- 37.Pevny, L., M.C. Simon, E. Robertson, W.H. Klein, S.-F. Tsai, V. D'Agati, S.H. Orkin, and F. Costantini. 1991. Erythroid differentiation in chimaeric mice blocked by a targeted mutation in the gene for transcription factor GATA-1. Nature. 349:257–260. [DOI] [PubMed] [Google Scholar]
- 38.Tsai, F.-Y., G. Keller, F.C. Kuo, M. Weiss, J. Chen, M. Rosenblatt, F.W. Alt, and S.H. Orkin. 1994. An early haematopoietic defect in mice lacking the transcription factor GATA-2. Nature. 371:221–226. [DOI] [PubMed] [Google Scholar]
- 39.Pandolfi, P.P., M.E. Roth, A. Karis, M.W. Leonard, E. Dzierzak, F.G. Grosveld, J.D. Engel, and M.H. Lindenbaum. 1995. Targeted disruption of the GATA3 gene causes severe abnormalities in the nervous system and in fetal liver haematopoiesis. Nat. Genet. 11:40–44. [DOI] [PubMed] [Google Scholar]
- 40.Tsang, A.P., Y. Fujiwara, D.B. Hom, and S.H. Orkin. 1998. Failure of megakaryopoiesis and arrested erythropoiesis in mice lacking the GATA-1 transcriptional cofactor FOG. Genes Dev. 12:1176–1188. [DOI] [PMC free article] [PubMed] [Google Scholar]
- 41.Okuda, T., J. van Deursen, S.W. Hiebert, G. Grosveld, and J.R. Downing. 1996. AML1, the target of multiple chromosomal translocations in human leukemia, is essential for normal fetal liver hematopoiesis. Cell. 84:321–330. [DOI] [PubMed] [Google Scholar]
- 42.Shivdasani, R.A., E.L. Mayer, and S.H. Orkin. 1995. Absence of blood formation in mice lacking the T-cell leukemia oncoprotein tal-1/SCL. Nature. 373:432–434. [DOI] [PubMed] [Google Scholar]
- 43.Warren, A.J., W.H. Colledge, M.B.L. Carlton, M.J. Evans, A.J.H. Smith, and T.H. Rabbitts. 1994. The oncogenic cysteine-rich LIM domain protein Rbtn2 is essential for erythroid development. Cell. 78:45–57. [DOI] [PubMed] [Google Scholar]
- 44.Sasaki, K., H. Yagi, R.T. Bronson, K. Tominaga, T. Matsunashi, K. Deguchi, Y. Tani, T. Kishimoto, and T. Komori. 1996. Absence of fetal liver hematopoiesis in mice deficient in transcriptional coativator core binding factor β. Proc. Natl. Acad. Sci. USA. 93:12359–12363. [DOI] [PMC free article] [PubMed] [Google Scholar]
- 45.Nuez, B., D. Michalovich, A. Bygrave, R. Ploemacher, and F. Grosveld. 1995. Defective haematopoiesis in fetal liver resulting from inactivation of the EKLF gene. Nature. 375:316–318. [DOI] [PubMed] [Google Scholar]
- 46.Motoyama, N., F. Wang, K.A. Roth, H. Sawa, K. Nakayama, K. Nakayama, I. Negishi, S. Senju, Q. Zhang, S. Fujii, et al. 1995. Massive cell death of immature hematopoietic cells and neurons in Bcl-x-deficient mice. Science. 267:1506–1510. [DOI] [PubMed] [Google Scholar]
- 47.Kawane, K., H. Fukuyama, G. Kondoh, J. Takeda, Y. Ohsawa, Y. Uchiyama, and S. Nagata. 2001. Requirement of DNaseII for definitive erythropoiesis in the mouse fetal liver. Science. 292:1546–1549. [DOI] [PubMed] [Google Scholar]
- 48.Kirito, K., T. Watanabe, K. Sawada, H. Endo, K. Ozawa, and N. Komatsu. 2002. Thrombopoietin regulates Bcl-xL gene expression through Stat5 and phosphatidylinositol 3-kinase activation pathways. J. Biol. Chem. 277:8329–8337. [DOI] [PubMed] [Google Scholar]