Abstract
Glucocorticoids (GCs) are important steroid hormones with widespread activities in metabolism, development, and immune regulation. The adrenal glands are the major source of GCs and release these hormones in response to psychological and immunological stress. However, there is increasing evidence that GCs may also be synthesized by nonadrenal tissues. Here, we report that the intestinal mucosa expresses steroidogenic enzymes and releases the GC corticosterone in response to T cell activation. T cell activation causes an increase in the intestinal expression of the steroidogenic enzymes required for GC synthesis. In situ hybridization analysis revealed that these enzymes are confined to the crypt region of the intestinal epithelial layer. Surprisingly, in situ–produced GCs exhibit both an inhibitory and a costimulatory role on intestinal T cell activation. In the absence of intestinal GCs in vivo, activation by anti-CD3 injection resulted in reduced CD69 expression and interferon-γ production by intestinal T cells, whereas activation by viral infection led to increased T cell activation. We conclude that the intestinal mucosa is a potent source of immunoregulatory GCs.
Keywords: mucosal immunology, intraepithelial lymphocytes, costimulation, extraadrenal glucocorticoid synthesis, immune regulation
Introduction
The intestinal mucosa contains the largest number of immune cells in our body, mainly to protect the enormous epithelial surface that is responsible for the absorption of nutrients and separates outside from inside. This extensive immune system is not only in constant contact with harmless food antigen and commensal bacteria but also with potentially dangerous pathogenic bacteria, parasites, and viruses. Although efficient intestinal immune responses protect the host from invading pathogens, the inappropriate activation of intestinal T cells may also result in chronic inflammatory reactions and tissue destruction, e.g., as observed in inflammatory bowel disease (for review see reference 1). Thus, a tight regulation of intestinal immune cells and their activation is crucial to maintain tissue homeostasis and ensure protective host defense. Several mechanisms that regulate intestinal immune responses have been described. The intestinal mucosa contains high levels of the immunosuppressive cytokines TGFβ and IL-10 produced by the regulatory T cell subsets, DCs, and even epithelial cells (2, 3). The importance of these immunoregulatory cytokines in the maintenance of immune homeostasis in the gut is illustrated by the fact that TGFβ and IL-10–deficient mice develop spontaneous inflammatory bowel disease (for review see reference 1). In addition, the presence of CD4+CD25+ regulatory T cells has been reported in the intestinal mucosa, which can inhibit the induction of experimental colitis by mechanisms yet to be defined (4, 5). However, additional mechanisms may exist to maintain locally confined and balanced immune responses in the intestinal mucosa.
Glucocorticoids (GCs) are lipid hormones playing an important role in the regulation of the immune system (for review see reference 6). GCs are synthesized from cholesterol via an enzymatic cascade (see Fig. 2 A), primarily in the cortex of the adrenal glands. The inhibitory role of GCs on immune cells is well characterized. For example, GCs potently inhibit the production of proinflammatory cytokines, such as TNFα, presumably through the inhibition of the transcription factors NFκB and AP-1 (7). The importance of this antiinflammatory action of GCs is well illustrated by the fact that GC inhibition or adrenalectomy results in a rapid septic shock and death upon systemic immune stimulation (8, 9). Thus, as early as 1948 GCs and other synthetic derivatives have been therapeutically used to treat inflammatory diseases, including inflammatory diseases of the intestine. Although the antiinflammatory activity of GCs is well described, there is also accumulating evidence that GCs are not only inhibitory, but may also enhance immune cell activation and induce gene transcription (10, 11).
Figure 2.
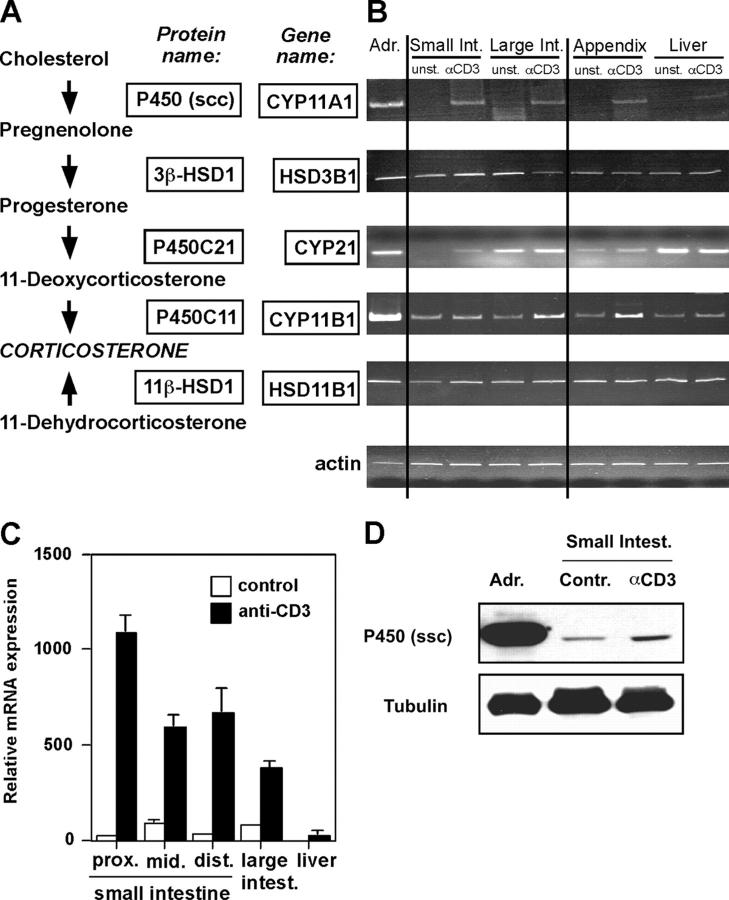
Detection of steroidogenic enzyme expression in intestinal tissue. (A) A simplified scheme of the biosynthesis pathway from cholesterol to corticosterone. The protein and gene names of the enzymes involved in the specific biosynthesis steps are boxed. (B) Adrenal glands, small and large intestine, appendix, and liver from control mice or anti-CD3–injected mice were isolated, and gene expression of steroidogenic enzymes was assessed by RT-PCR. Equal loading was controlled by amplification of actin. A typical experiment out of four is shown. (C) Detection of CYP11A1 expression in different sections of the small intestine (proximal [prox.], middle [mid.], distal [dist.]), the large intestine, and the liver by quantitative real-time RT-PCR. A typical experiment out of two is shown. (D) Detection of P450 (ssc) protein. Protein extracts from adrenal gland (positive control) or small intestine from control or anti-CD3–treated mice were assessed for P450 (ssc) expression by Western blot. Equal protein loading was confirmed by the detection of tubulin. Adr., adrenal glands; Contr., control.
Adrenal glands synthesize and release GCs in enormous quantities, i.e., upon induction by the pituitary gland–released hormone ATCH (adrenocorticotropic hormone). Recently, however, alternative sources of GCs have been described. In particular, Ashwell and colleagues found that thymic epithelial cells express the entire enzyme cascade required for GC synthesis, enabling the release of bioactive GCs (12–14). Thymocytes are exquisitely sensitive to GC receptor (GR) activation and rapidly die by apoptosis. Although GCs directly induce apoptosis, they also antagonize T cell receptor–induced negative selection. Thus, thymic epithelium-produced GCs have been implicated in the regulation of thymic positive selection. However, the physiological role of GCs in the thymus remains controversial (13, 15, 16).
Similar to the thymus, the expression of steroidogenic enzymes has also been described in the brain (17, 18). However, only adrenals and thymus have been found so far to synthesize bioactive GCs from cholesterol. The intestinal mucosa of fetal mice expresses steroidogenic enzymes (19). Similarly, steroids were found to be synthesized in the small intestine of frogs (20). In this study, we investigated whether the intestinal mucosa is a source of GCs and the involvement of intestinal GCs in the regulation of the local immune system. We here show that upon T cell stimulation intestinal epithelial cells express all steroidogenic enzymes required for the synthesis of GCs and release the GC corticosterone. Our results further support a regulatory role for in situ–produced GCs in intestinal T cell activation. These findings define a novel source of extraadrenal GC synthesis and shed new light on GC-mediated immune regulation.
Materials and Methods
Cells and Reagents.
A1.1 T cell hybridoma cells have been described previously (21). A1.1 were cultured in RPMI 1640, supplemented with 5% FCS, 2 mM l-glutamine, 100 U/ml penicillin, 100 μg/ml streptomycin, 50 μM β-mercaptoethanol, and 20 mM Hepes, pH 7.4. The murine epithelial cell line m-ICc12 was a gift of J.P. Kraehenbuehl (University of Lausanne, Lausanne, Switzerland) and was cultured as described (22). Primary T cells and mouse organs were cultured in IMDM containing 10% steroid-free FCS, 2 mM l-glutamine, 100 U/ml penicillin, 100 μg/ml streptomycin, 50 μM β-mercaptoethanol, and 20 mM Hepes, pH 7.4. Steroid-free serum was prepared using dextran T-70–coated Norit A charcoal as described previously (23). Metyrapone and RU486 were from Sigma-Aldrich, and spironolactone, pregnenolone, and corticosterone were from Acros Organics. Anti–mouse CD3ɛ (clone 145-2C11), B220, CD11c, and MAC-1 were purified from hybridoma cell culture supernatant using a protein A column. Anti–CD69-FITC, anti–TCRβ-FITC, anti–CD8α-Cy-chrome, anti–CD8β-PE, anti–CD4-PE, and anti–αEβ7-PE were obtained from BD Biosciences. Anti-CD25 and anti-Vα2 were from eBioscience, anti-P450 (ssc) was from Chemicon, and anti–α-tubulin was from Sigma-Aldrich.
Detection of Corticosterone Synthesis in Intestinal Organ Cultures.
C57BL/6 mice (10–16 wk old) were breed and kept in the Central Animal Facility of the Department of Medicine, University of Bern. All animal experiments were performed in compliance with the laws and guidelines of the State of Bern. To assess the corticosterone synthesis in the intestinal mucosa or adrenal glands, mice were injected with saline or 100 μg anti-CD3. After 4 h, mice were killed, serum was collected, and adrenal glands, testes, liver, appendix, and small and large intestine were collected for RNA isolation, in situ hybridization, or organ culture. The entire small intestine was placed in cold Ca2+/Mg2+-free HBSS containing 2% horse serum, Peyer's patches were removed, and the intestine was opened longitudinally and cut in 5-mm-long pieces. These were washed extensively in HBSS/2% horse serum and then incubated for 10 min in HBSS/2% horse serum containing 1 mM 1,4-dithiothreitol at 4°C to remove the excess mucus. After additional washing in HBSS/2% horse serum, tissue pieces were equally distributed in a 24-well plate and incubated in IMDM containing 10% steroid-free FCS at 37°C. The right and left adrenal gland were cut in half, and the right half was incubated with the left half in a 24-well plate in steroid-free medium. In some experiments, glucocorticoid synthesis was blocked by addition of 200 μg/ml metyrapone to the organ culture. Metyrapone specifically blocks the activity of the two corticosterone-producing enzymes P450C11 and 11β-HSD1 (24, 25). After 4–5 h, cell-free supernatant was harvested and the corticosterone concentration was measured using a commercially available radio-immuno assay kit (RIA; ICN). Metyrapone, at the concentrations used (200 μg/ml), did not interfere with the corticosterone assay (unpublished data). In some experiments, the tissue volume was assessed after centrifugation in a graded tube.
Isolation of Intestinal Epithelial Cells.
Intestinal epithelial cells from the small intestine of control or anti-CD3–injected animals were isolated as described previously (26). Epithelial cells were then further purified by cell sorting on a FACS Vantage (Becton Dickinson), based on forward/side scatter properties and gating out contaminating intraepithelial lymphocytes stained with anti-CD4 and anti-CD8α. The purity of the preparations was found to be >98%.
Differential Isolation of Intestinal Epithelial Cells along the Villus-Crypt Axis.
Intestinal epithelial cells were isolated following a modified nonenzymatic method described by Traber et al. (27). Briefly, the entire small intestine was placed in cold HBSS/2% horse serum. Peyer's patches were removed and the small intestine was opened longitudinally, cut in 5–10-mm-long pieces, and washed extensively in HBSS/2% horse serum. The tissue was then incubated in HBSS/2% horse serum containing 1 mM DTT for 10 min at 4°C to remove off the excess mucus. Afterwards, tissue pieces were incubated in HBSS/2% horse serum containing 2 mM DTT and 0.5 mM EDTA for 2 min at 37°C under stirring conditions. The detached cells were collected and referred to as fraction 1. Fractions 2–10 were generated by the same procedure over nine cycles with time intervals of 2, 2, 2, 2, 5, 5, 5, 10, and 10 min. Cells from each fraction were washed and further processed for total RNA or protein isolation. Alkaline phosphatase is expressed in the villus epithelial cells but not in the crypt cells. To validate the isolation procedure, endogenous alkaline phosphatase activity was assessed by incubating 20 μg protein of each fraction with p-nitrophenyl phosphate as substrate and measurement of OD 405 nm. To visualize endogenous alkaline phosphatase in small intestinal tissue, 5-μm frozen sections were fixed in acetone, incubated with alkaline phosphatase substrate, and counterstained with hematoxylin and eosin.
Detection of Gene Products of Steroidogenic Enzymes by RT-PCR.
Sorted epithelial cells or frozen tissue was lysed in RNA isolation reagent (TRI-reagent; Sigma-Aldrich), and RNA was isolated according to manufacturer's protocol. Total RNA was DNase treated to remove genomic DNA and reverse transcribed using a commercially available kit (Promega). The PCR reaction mixture consisted of 37.85 μl nuclease-free water, 5 μl 10× reaction buffer, 1 μl dNTPs (10 μM), 2U Taq polymerase, 0.25 μl of each primer (100 μM), 1.25 μl of MgCl2 (50 mM) (all from Invitrogen), and 4 μl cDNA (50 ng/μl). The following amplification parameters were used: actin: 1 min at 95°C, 1 min at 55°C, and 1 min at 72°C for 20 cycles; CYP11A1 and CYP21: 1 min at 95°C, 1 min at 60°C, and 1 min at 72°C for 38 cycles; CYP11B1: 1 min at 95°C, 1 min at 55°C, and 1 min at 72°C for 40 cycles; HSD11B1 and HSD3B1: 1 min at 95°C, 1 min at 55°C, and 1 min at 72°C for 35 cycles. All amplifications included a final extension of 10 min at 72°C and were performed in a Biometra T3 Thermocycler (Whatman Biometra). The primers used were: β-actin forward, 5′-TGGAATCCTGTGGCATCCATGAAAC-3′, and reverse, 5′-TAAAACGCAGCTCAGTAACAGTCCG-3′; mouse CYP11A1 forward, 5′-CCAGGCCAACATTACCGAGAT-3′, and reverse, 5′-GACTTCAGCCC-GCAGCAT-3′; mouse CYP21 forward, 5′-AACCACTGGTCCATCCAAATCT-3′, and reverse, 5′-TCTTCGTCTTTGCCATCCCT-3′; mouse HSD3B1 forward, 5′-AATCTGAAAGGTACCCAGAA-3′, and reverse, 5′-CTCAGGGTGCAATT-TAAATC-3′; mouse CYP11B1 forward, 5′-CCATAGAAG-CTAGCCACTTGT-3′, and reverse, 5′-GGGTTGATGTC-GTGTCAGT-3′; mouse HSD11B1 forward, 5′-TCTCGTGCCTTGAACTCG-3′, and reverse, 5′-CCTTGGTTATGTAGA-GTTCTG-3′. PCR products were separated on a 4% polyacrylamide-Tris-borate-EDTA gel and stained with ethidium bromide. The correct amplification of CYP11A1, CYP11B1, and HSD11B1 was confirmed by sequencing.
CYP11A1 expression was also assessed by real-time PCR using the above described CYP11A1 primers and SYBR green mix (Applied Biosystems). DNA was amplified on an ABI prism 7700, and the increase in gene expression was calculated using the Sequence Detection System 1.7 software (Applied Biosystems).
In Situ Hybridization.
The PCR products of CYP11A1, CYP11B1, and HSD11B1 were cloned into the pGEM-T-easy vector (Promega), sequenced, and used to prepare 35S-labeled antisense and sense RNA probes as described previously (28). 5-μm cryostat sections on poly-l-lysine slides were fixed in PBS/4% paraformaldehyde for 20 min, washed in PBS and H2O, and dehydrated in an ethanol row. Sections were then hybridized with the probes at a concentration of 2 × 10⁵ cpm/μl in hybridization solution as described previously (28). After overnight hybridization, nonhybridized probe was removed by washing, slides were dipped in NTB-2 emulsion (Eastman Kodak Co), 1:2 diluted in 800 mM ammonium acetate, and exposed in the dark at 4°C for 3 wk. Then, slides were developed using Kodak PL 12 developer, fixed, and counterstained with nuclear fast red.
Detection of P450 (ssc) by Western Blot.
Purified epithelial cells, intestinal tissue, or adrenal glands were solubilized in RIPA buffer (150 mM NaCl, 10 mM Tris, 0.1% SDS, 1% Triton X-100, 1% deoxycholate, 5 mM EDTA) plus protease inhibitors (1 mM phenylmethylsulfonyl fluoride, 10 mM benzamidine, 2 μg/ml leupeptin). 20 μg of protein were resolved on a 12% SDS-PAGE and blotted on nitrocellulose. P450 (ssc) was detected using a polyclonal rabbit anti–rat P450 (ssc) antibody and goat anti–rabbit peroxidase conjugate (Bio-Rad Laboratories). Equal protein loading was confirmed by the detection of α-tubulin.
Adrenalectomy and In Vivo T Cell Activation.
Mice were anesthetized by i.p. injection of ketamine (100 mg/kg body weight) and xylazine (10 mg/kg body weight), and adrenal glands were removed as previously described (29). Animals were given 0.9% NaCl and 5% glucose in drinking water ad libitum and were allowed to recover for 10 d before the experiment. At this point, the removal of the adrenal glands was confirmed by the absence of serum corticosterone as assessed by RIA. In addition, after the experiments the periadrenal fat was visually examined to verify complete removal of the adrenals.
To assess the role of intestinal corticosterone in the regulation of intestinal T cells, mice were treated with saline or 100 mg metyrapone/kg body weight by i.p. injection for 1 h before injection of saline or 50 μg anti-CD3. A single dose of metyrapone has been shown previously to completely block GC synthesis in vivo (30). After 3 h, mice were killed. Serum was collected and analyzed for the absence of corticosterone release. Peyer's patches were removed from the small intestine, and lymphocyte suspension was prepared by physical dissociation between frosted slides. Intraepithelial lymphocytes (IELs) were prepared from the remaining small intestinal tissue by Percoll density gradients as described previously (26, 31). Isolated cells were resuspended in IMDM with 10% steroid-free serum for further analysis. The experimental procedure is summarized in a flow chart in Fig. 4 A.
Figure 4.
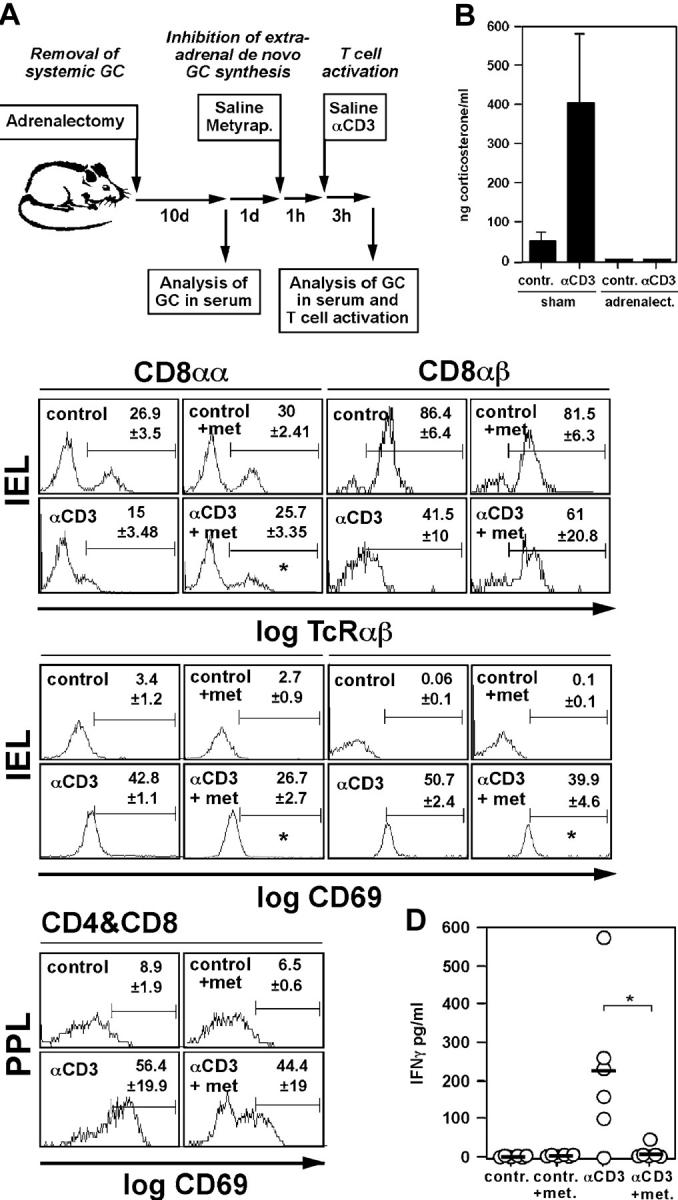
In situ–produced GCs regulate intestinal T cell activation in vivo. (A) Schematic overview of the in vivo experiments. Mice were adrenalectomized to remove the major source of systemic GCs. After 10 d recovery, animals were pretreated for 1 h with saline or metyrapone before injection of saline or anti-CD3 to activate T cells in vivo. After 3 h, GCs in the serum and the activation status of intestinal T cells were assessed. (B) Adrenalectomized animals fail to secrete GCs into the serum upon immune stimulation. Control mice (sham) or adrenalectomized animals were treated with saline (contr.) or anti-CD3, and corticosterone levels in the serum were assessed after 3 h (mean values ± SD of six mice per group). (C) Animals were treated as shown in A. IELs and PPLs were isolated and TCRαβ and CD69 expression on the CD8αα and CD8αβ subsets (IEL), or CD69 expression on CD4+ and CD8+ T cells (PPL), was monitored by flow cytometry. A typical experiment out of four is shown. Numbers indicate mean values of the percentage of positive cells in the indicated gates of three animals per group. An asterisk indicates a p-value of <0.05 for αCD3 vs. αCD3+ metyrapone. Note that TCRαβ− in the CD8αα+ IEL population are TCRγδ+ T cells. (D) Animals were treated as indicated in A. PPLs from control-, metyrapone- (met.), anti-CD3– or metyrapone plus anti-CD3–treated animals were isolated and cultured overnight. IFNγ in the cell-free supernatant was analyzed by ELISA. Bullets indicate values obtained with cells from individual animals (n = 6 per group), horizontal bars indicate mean values, and the asterisk indicates P < 0.05.
Viral Infection of Adrenalectomized Mice.
TCR transgenic (tg) mice, specific for the gp33-41 (gp33) peptide of lymphocytic choriomeningitis virus (LCMV) (line 318), were adrenalectomized and subsequently infected with 2 × 10⁴ pfu LCMV strain WE by i.p. injection (32). At 0, 8, and 16 h after viral infection, mice were injected i.p. with 50 mg metyrapone per kg body weight or control vehicle. After 30 h, mice were killed and intestinal lymphocytes were isolated as described above. The experimental procedure is summarized in a flow chart in Fig. 5 A.
Figure 5.
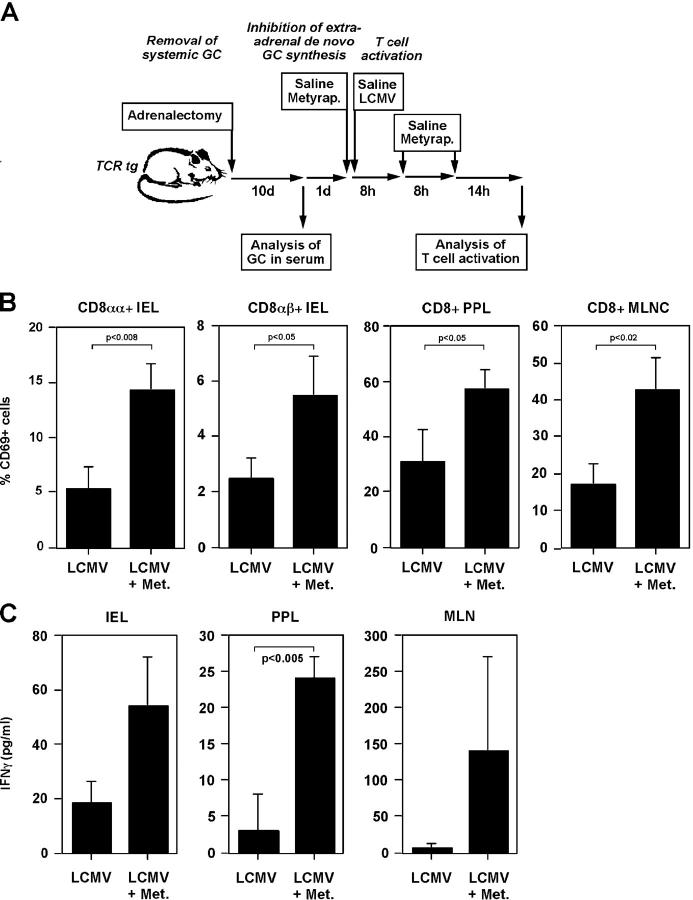
In situ–produced GCs inhibit the activation of virus-specific intestinal T cells. (A) Schematic overview of the in vivo experiments. TCR tg mice were adrenalectomized to remove the major source of systemic GCs. After 10 d recovery, animals were treated with saline or metyrapone before infection with LCMV. Metyrapone or saline treatment was repeated after 8 and 16 h. 30 h postviral infection, the activation status of intestinal T cells were assessed. (B) Animals were treated as shown in A. IELs, PPLs, and mesentheric lymph node cells (MLNCs) were isolated. CD69 expression on the TCR tg T cells (Vα2+) on CD8αα and CD8αβ subsets (IEL), or CD69 expression on the TCR tg T cells on CD8+ T cells (PPL, MLNC) was monitored by flow cytometry. A typical experiment is shown (n = 3 per group; two experiments). Numbers indicate p-values of the Student's t test. (C) Animals were treated as described in A. IELs, PPLs, and MLNCs from LCMV-infected or LCMV-infected and metyrapone-treated (Met.) were isolated and cultured overnight. IFNγ in the culture supernatant was assessed by ELISA. Numbers indicate p-values.
Flow Cytometry.
IELs were stained with anti-CD8α and anti-CD8β to distinguish between CD8αα and CD8αβ IELs. Peyer's patch lymphocytes (PPLs) were stained with anti-CD4 and anti-CD8. The in vivo activation of all T cell subsets was then assessed by counterstaining with anti-TCRβ or anti-CD69. After washing, cells were fixed in 4% paraformaldehyde in PBS and analyzed on a FACScan flow cytometer using Cell Quest software (Becton Dickinson). Electronic gates were drawn around the lymphocyte population, and TCR and CD69 expression was assessed on individual T cell subsets. The presence of dendritic cells was excluded by staining with anti-CD11c. TCR tg T cells (Vα2/Vβ8) were detected by staining with anti-Vα2 antibody
Ex Vivo IFNγ Production.
PPLs were cultured for 16 h at 6 × 10⁶/ml in steroid-free medium in 24-well plates followed assessment of IFNγ production by ELISA (R&D Systems).
In Vitro T Cell Activation.
A1.1 T cells were cultured at 100,000 cells/well on anti-CD3–coated 96-well plates for various time intervals. T cell activation was modified by 30 min preincubation with various concentrations of corticosterone, pregnenolone, or metyrapone, and assessed by CD69 staining as described above. The glucocorticoid receptor was blocked by addition of RU486, and the mineralocorticoid receptor was inhibited by spironolactone. Cell viability was assessed by annexin V staining (31), and only viable cells were analyzed.
Alternatively, splenic T cells were isolated from WT C57Bl/6 mice or TCR tg mice. Briefly, splenocytes were depleted from B220+, CD11c+, and MAC-1+ cells by MACS according to manufacturer's instruction (Miltenyi Biotec). The resulting T cell fraction was always >94% CD3+. T cells were either stimulated with plate-bound anti-CD3 (4 μg/ml) or irradiated C57Bl/6 spleen cells pulsed previously with 100 ng/ml gp33 peptide or adn5 control peptide (32), in the presence or absence of various concentrations of corticosterone. Cell activation and IFNγ production was assessed as described above.
Accession Numbers.
Sequence data is available for the following genes from GenBank/EMBL/DDBJ:mouse CYP11A1, accession no. AF19511; mouse CYP21, accession no. M15009; mouse HSD3B1, accession no. M58567; and mouse HSD11B1, accession no. S75207.
Statistical Analyses.
Data are expressed as mean ± SD. Statistical differences were analyzed by two-tailed unpaired Student's t test with unequal variances.
Results
Detection of Corticosterone Production in the Small Intestinal Mucosa of Immune-stimulated Mice.
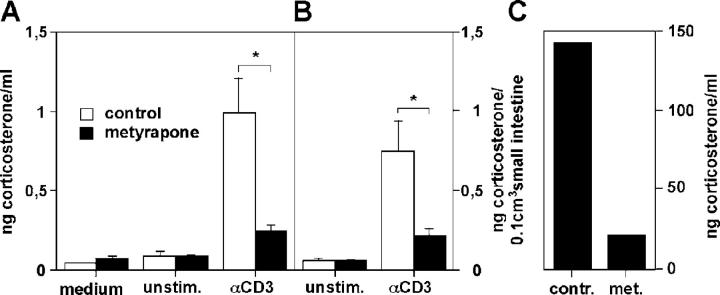
Corticosterone is the most abundantly produced and bioactive GCs in rats and mice and crucially involved in the regulation of immune cells and their responses. Thus, we aimed at analyzing the corticosterone production in the intestinal mucosa of mice. For this purpose, we obtained small intestinal tissue from C57Bl/6 mice for subsequent ex vivo culture in steroid-free medium for 4–5 h and analysis of corticosterone synthesis by RIA. However, only minimal corticosterone levels were detected in the cell-free culture supernatant. Therefore, we hypothesized that GC production by the intestinal mucosa may only be induced upon immune cell stimulation. Subsequently, mice were injected with saline or anti-CD3 antibody for 4 h, and ex vivo corticosterone synthesis in isolated small intestinal tissue was assessed. Fig. 1 A shows that although only minimal corticosterone was released from intestinal tissue of control mice, considerable amounts of corticosterone were secreted from small intestine of anti-CD3–stimulated mice. These elevated levels of corticosterone were the result of in situ glucocorticoid synthesis and not due to serum GC contamination since metyrapone, a potent inhibitor of corticosterone synthesis (24, 25), blocked both corticosterone release from small intestinal tissue (Fig. 1 A) and from in vitro–cultured adrenal glands (Fig. 1 C). To get an estimate of the steroid-producing capacity of intestinal tissue, we also assessed the total amount of corticosterone produced per cm3 intestinal tissue. Fig. 1 B shows that the small intestinal mucosa synthesized ∼0.75 ng corticosterone per 0.1 cm3 tissue. This corresponds to ∼25 nM corticosterone, a concentration which has been reported to be biologically active, i.e., induction of nuclear translocation of the GR (33) and T cell proliferation (34). Thus, we conclude that the small intestinal mucosa is a potent source of GCs.
Figure 1.
Corticosterone synthesis by the intestinal mucosa. (A) Small intestinal tissue from control mice (unstim.) or anti-CD3–injected mice (αCD3) were cultured ex vivo for 5 h in the presence or absence of metyrapone. Corticosterone in the cell-free supernatant was measured by RIA. (B) Presentation of the data shown in A as ng corticosterone per 0.1 cm3 small intestinal tissue. Mean values of triplicates of a typical experiment out of five are shown. An asterisk indicates P < 0.05 as assessed by the unpaired Student's t test. (C) Isolated adrenal glands were cultured with control medium or metyrapone (met.) for 5 h, and corticosterone released into the supernatant was assessed by RIA. A typical experiment out of four is shown.
Expression of Steroidogenic Enzyme Genes in the Intestinal Mucosa.
The results described above support the idea that GCs are produced in situ. Subsequently, all enzymes required for the biosynthesis of corticosterone from cholesterol (Fig. 2 A) must be expressed within the intestinal mucosa. Thus, the steroidogenic enzyme expression in adrenal glands, small and large intestine, appendix, and liver from control mice or anti-CD3–injected animals was analyzed by RT-PCR (Fig. 2 B). As expected, CYP11A1, HSD3B1, CYP21, CYP11B1, and HSD11B1, i.e., the genes of the steroidogenic enzymes involved in corticosterone synthesis, were found to be expressed within the adrenal glands. In the different parts of the intestine (small and large intestine and appendix) some genes were expressed in a constitutive manner, whereas others were specifically detected only in anti-CD3–injected animals. In particular, the rate-limiting enzyme CYP11A1 (P450 ssc) was not detected in the intestinal tissue and liver of control mice but became induced in the intestine in response to T cell activation. This data was confirmed using quantitative real-time RT-PCR. Fig. 2 C illustrates that in the different sections of the small intestine (proximal, middle, and distal) and in the large intestine the expression of CYP11A1 was strongly up-regulated in response to anti-CD3 injection but failed to be induced in the liver. This observation is in agreement with our finding that ex vivo cultured liver tissue did not release metyrapone-blockable corticosterone (unpublished data). The presence and increased expression of the CYP11A1 gene product P450 (ssc) in anti-CD3–treated small intestine was also confirmed by Western blot (Fig. 2 D).
Intestinal Epithelial Cells Express Steroidogenic Enzymes.
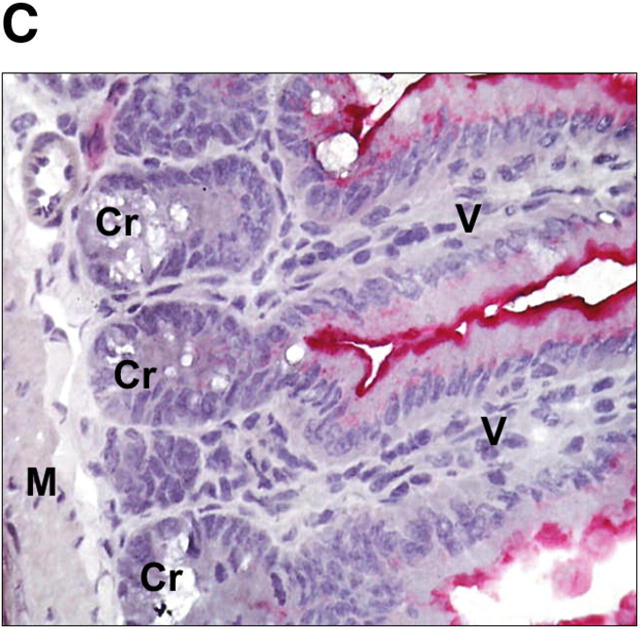
To identify the cellular source of GCs, we performed in situ hybridization for the three most crucial enzymes of the biosynthesis of corticosterone, i.e., CYP11A1 (P450 ssc), converting cholesterol to pregnenolone and CYP11B1 (P450C11) and HSD11B1 (11β-HSD1), synthesizing bioactive corticosterone from 11-deoxycorticosterone and 11-dehydrocorticosterone, respectively (Fig. 2 A). Tissue sections of adrenal gland, testis, and small intestine from anti-CD3–injected animals were hybridized with radiolabeled antisense probes or CYP11B1 sense probe as negative control. Fig. 3 A shows that mRNAs for all enzymes were abundantly expressed in the cortex of the adrenal glands, confirming the specificity of the probes. In the testis, only CYP11A1 expression, but not CYP11B1 and HSD11B1, was detected in Leydig cells. This finding is in agreement with the important role of the testis in sex hormone (e.g., testosterone) but not GC synthesis. Importantly, however, mRNAs of all three enzymes (CYP11A1, CYP11B1, and HSD11B1) were clearly detected in the crypt region of the small intestine (Fig. 3 A). CYP11A1 appeared to be expressed most abundantly, whereas CYP11B1 and HSD11B1 were expressed at lower but still clearly detectable levels. No signals were detected with the sense control.
Figure 3.
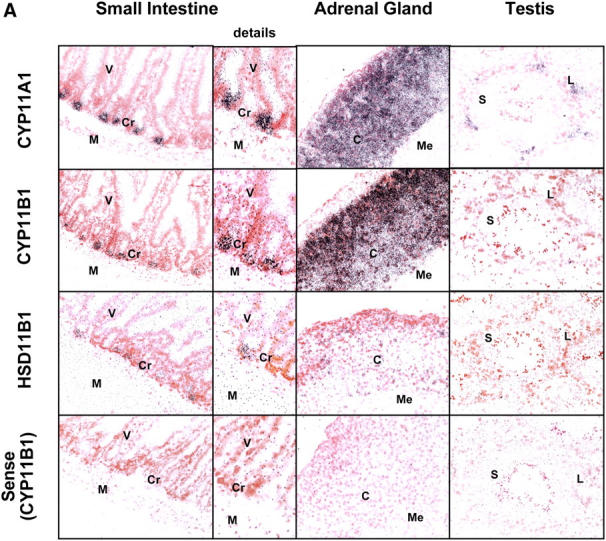
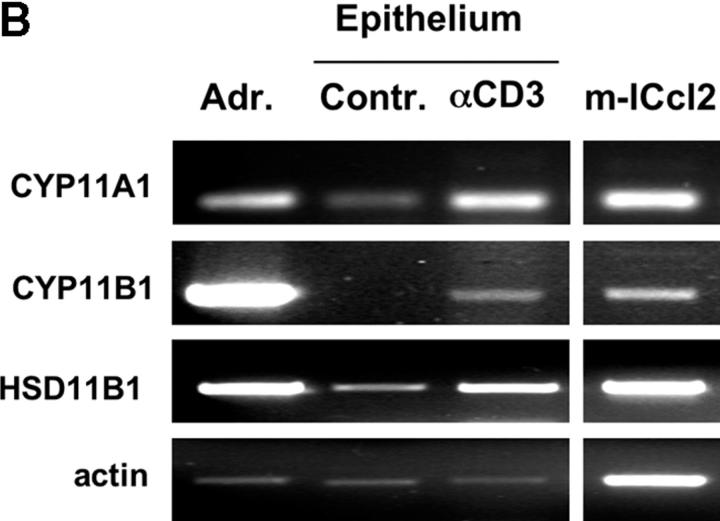
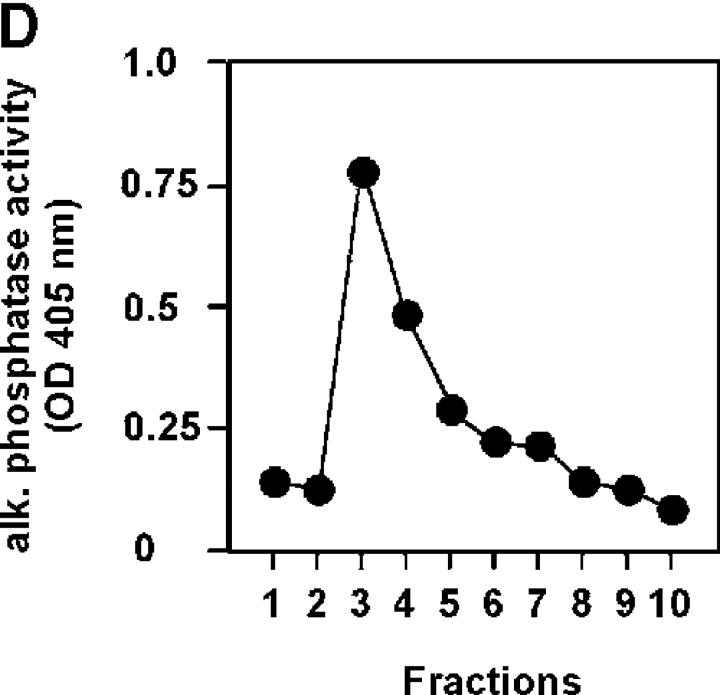
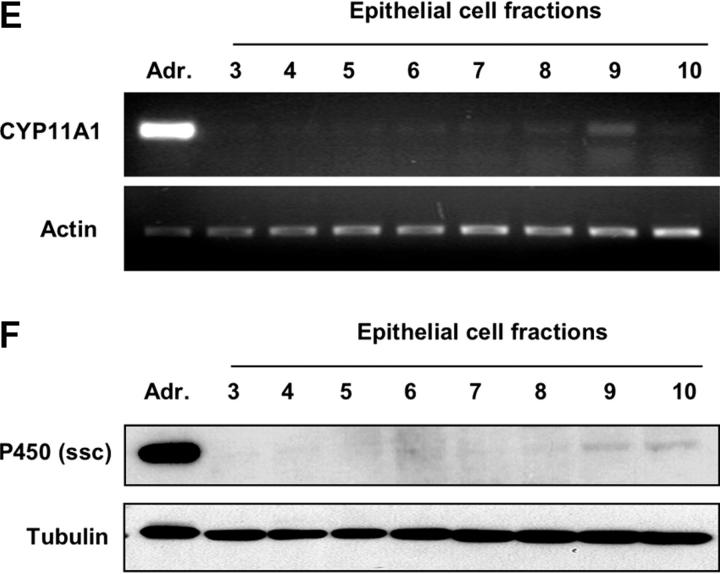
Localization of steroidogenic enzyme expression in small intestinal crypt cells. (A) In situ hybridization for steroidogenic enzymes. Tissue sections from small intestine, adrenal glands, and testis were hybridized with radiolabeled antisense probes for CYP11A1, CYP11B1, and HSD11B1. Unspecific binding was controlled using the CYP11B1 sense probe. M, muscularis; Cr, crypts; V, villi; C, cortex; Me, medulla; L, Leydig cells; S, Sertoli cells. A typical experiment out of two is shown. (B) Detection of steroidogenic enzyme expression in isolated epithelial cells. CYP11A1, CYP11B1, HSD11B1, and actin expression in adrenal glands (Adr.), isolated epithelial cells from control (contr.) and anti-CD3–injected mice (αCD3), or the murine epithelial crypt cell line m-ICc12 was assessed by RT-PCR. (C) Detection of endogenous alkaline phosphatase on small intestinal tissue sections. The luminal site of the epithelial layer stains red for alkaline phosphatase activity, whereas crypt cells are negative. V, villus; Cr, crypts; M, muscularis. (D) Analysis of alkaline phosphatase activity in differentially isolated epithelial cell fractions. Fraction 3 corresponds to the top villus fraction; fraction 10 corresponds to the bottom crypt cell fraction. (E) Analysis of CYP11A1 mRNA expression in the different epithelial cell fractions by RT-PCR. Equal amounts of RNA were confirmed by the detection of actin mRNA. (F) Detection of P450 (ssc) protein in the different epithelial cell fractions by Western blot. Equal protein loading was confirmed by the detection of tubulin.
This finding supports the idea that intestinal epithelial cells, and probably more specifically crypt cells, might be the source of these enzymes. Therefore, we isolated and sorted epithelial cells from control and anti-CD3–injected animals by flow cytometry to high purity and analyzed the expression of CYP11A1, CYP11B1, and HSD11B1 by RT-PCR. In agreement with the in situ hybridization (Fig. 3 A) and RT-PCR from total tissue (Fig. 2, B and C), we found all three enzymes expressed in the epithelial cells from anti-CD3–injected animals (Fig. 3 B). Importantly, mRNAs of CYP11A1, CYP11B1, and HSD11B1 were also detected in the murine intestinal crypt cell line m-Icc12 (22), confirming that intestinal epithelial cells express steroidogenic enzymes. mRNA of all three genes were also found in human colonic tissue, isolated human colonic epithelial cells, and the colonic epithelial cell lines CaCo2 and T84 (unpublished data), further supporting a role of intestinal epithelial cells in the production of GCs.
To further investigate the role of crypt cells as the source of steroidogenic enzymes, we analyzed CYP11A1 RNA expression and P450 (ssc) protein expression in differentially isolated epithelial cells. Whereas villus epithelial cells express endogenous alkaline phosphatase, crypt cells lack the expression of this marker (Fig. 3 C). Differential isolation of epithelial cells from the villus top to the crypts shows a gradual decrease of alkaline phosphatase activity in the different fractions (Fig. 3 D), confirming the alkaline phosphatase expression pattern shown in Fig. 3 C. When the different fractions were analyzed for CYP11A1 mRNA expression (Fig. 3 E) or P450 (ssc) protein expression (Fig. 3 F), it revealed that this enzyme is predominantly expressed by alkaline phosphatase-negative crypt cell fractions. Thus, these data confirm the crypt cells as the source of intestinal glucocorticoids.
In Situ–produced GCs Regulate Intestinal T Cell Activation.
GCs have been proposed to mediate both inhibitory and stimulating activities in immune cells (for review see reference 10). We next analyzed the role of in situ–produced GCs on the activation of resident intestinal T cells by performing the following experiment (Fig. 4 A). Mice were adrenalectomized to exclude a contribution of systemic GCs released by the adrenal glands. After 10 d recovery period, serum GC levels were analyzed to confirm the successful removal of the glands. Then, mice were either injected with saline or with metyrapone to inhibit de novo GC synthesis and 1 h later with saline or anti-CD3 to activate T cells. Previous experiments have shown that a single dose of metyrapone leads to significant in vivo inhibition of P450C11 and 11β-HSD1 and, therefore, specifically blocks GC synthesis (30, 35). After an additional 3 h, mice were killed, and we assessed GC levels in the serum and the activation status of intestinal T cells. Fig. 4 B clearly shows that although sham-operated mice had high GC levels in the serum after anti-CD3 injection, adrenalectomized mice failed to release GCs, demonstrating the efficient removal of systemic GCs. This finding also excludes that GCs produced in other organs than the intestine may be transported to the intestine via the serum.
One of the early activation markers in T cells is the down-regulation of the T cell receptor and the up-regulation of CD69. We next analyzed these two parameters in T cells from two distinct intestinal compartments, i.e., IELs and PPLs, of mice treated with or without metyrapone, and with or without anti-CD3. Fig. 4 C shows that anti-CD3 injection caused a strong activation signal in the CD8αα and CD8αβ IEL subsets and in PPLs. Although the TCRαβ of these intestinal T cells was clearly down-regulated, CD69 expression was strongly up-regulated. Based on the percentage and absolute numbers of bona fide CD8αα+ αEβ7+ IELs, no infiltration of activated peripheral T cells could be detected during the observation period (unpublished data). Thus, we conclude that anti-CD3 injection led to the local activation of IELs and PPLs. Surprisingly, inhibition of GC synthesis by the treatment of the mice with metyrapone did not cause an increase in T cell activation but resulted in significantly reduced cell activation. Importantly, no increase in T cell death was observed during the observation period, excluding the possibility that metyrapone may be toxic to intestinal T cells (unpublished data). Many CD8αα+ IELs express the TCRγδ (CD8αα+ TCRαβ− IELs in Fig. 4 C). Similarly to the TCRαβ+ IELs, anti-CD3–induced TCRγδ down-regulation was reduced upon metyrapone treatment (unpublished data).
This finding was also confirmed when the IFNγ production of in vivo–stimulated and ex vivo–cultured PPLs was analyzed. Although cells from control mice or metyrapone-injected mice failed to synthesize IFNγ, a strong increase in cytokine production was observed in cells from anti-CD3–injected animals. In contrast, only minimal IFNγ was released by PPLs isolated from metyrapone-treated and anti-CD3–injected animals. These data support the idea that in situ produced GCs regulate intestinal T cell activation in a positive manner.
Inhibitory Role of Intestinal GCs on Virus-induced Intestinal T Cell Activation.
Since GCs have been predominantly reported to exhibit an inhibitory activity on the activation of antigen-specific T cells, the role of intestinal GCs was further analyzed in a virus infection model. TCR tg mice, specific for the LCMV peptide gp33 (32), were adrenalectomized, treated with metyrapone or control vehicle, and subsequently infected with LCMV (Fig. 5 A). Again, intestinal T cell activation was assessed by the detection of the activation marker CD69 and the generation of IFNγ ex vivo.
LCMV infection resulted in a clear induction of CD69 expression in all intestinal T cells analyzed (i.e., CD8αα+ IELs, CD8αβ+ IELs, CD8+ PPLs, and CD8+ mesentheric lymph node cells). Surprisingly, however, inhibition of intestinal GC synthesis resulted in a significantly increased T cell activation, as demonstrated by increased numbers of CD69+ T cells (Fig. 5 B). This increased intestinal T cell activation was also confirmed by an elevated IFNγ production by ex vivo cultured intestinal T cells isolated from LCMV-infected and metyrapone-treated mice (Fig. 5 C). Thus, in contrast to intestinal T cell activation by anti-CD3 injection, locally produced GCs exhibit an inhibitory role on the activation of intestinal T cells upon viral infection.
Corticosterone Synergistically Enhances Anti-CD3–mediated T Cell Activation In Vitro.
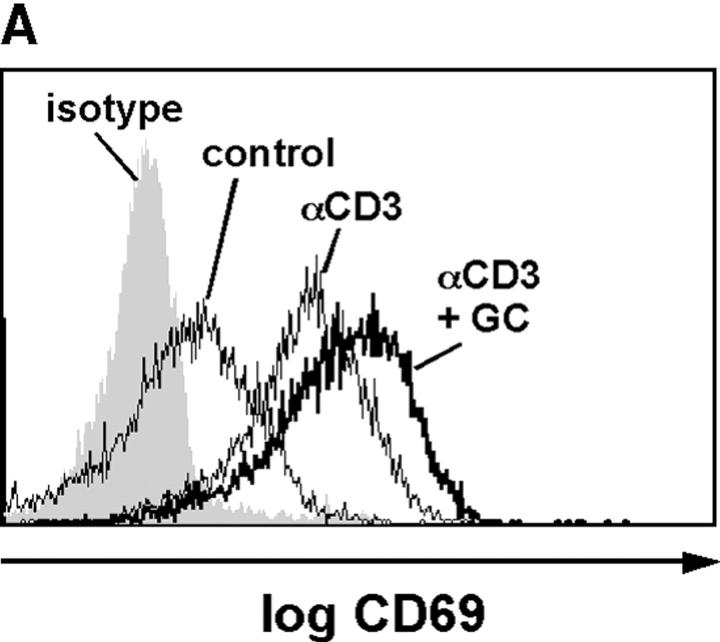
GCs are primarily known for their inhibitory action on immune cell activation. Although stimulatory effects of GCs have also been described, particularly at lower concentrations (10), the enhancing effect of in situ produced intestinal GCs on anti-CD3–induced T cell activation, but inhibitory role on virus-induced T cell activation, was surprising. Thus, we aimed at further characterizing this paradoxical role of GCs on T cell activation in vitro. We first investigated the costimulatory role of GCs on the anti-CD3–induced activation of the T cell hybridoma A1.1 (21). A1.1 cells were stimulated with plate-bound anti-CD3 in the presence or absence of corticosterone, and CD69 expression was analyzed by flow cytometry. Fig. 6, A and B, illustrates that T cell activation caused a significant increase in CD69 expression, which was further enhanced by the addition of corticosterone. This costimulatory effect of corticosterone was found to be dose dependent (Fig. 6 B). In contrast, metyrapone, at concentrations that blocked corticosterone synthesis in adrenal glands and intestinal tissue (Fig. 1), did not modulate anti-CD3–induced CD69 expression (Fig. 6 B), ruling out an unspecific effect of metyrapone on intestinal T cell activation in vivo. Interestingly, costimulation with corticosterone not only resulted in a stronger T cell activation but also in a faster kinetic of CD69 expression than observed in cells stimulated with anti-CD3 only (Fig. 6 C).
Figure 6.
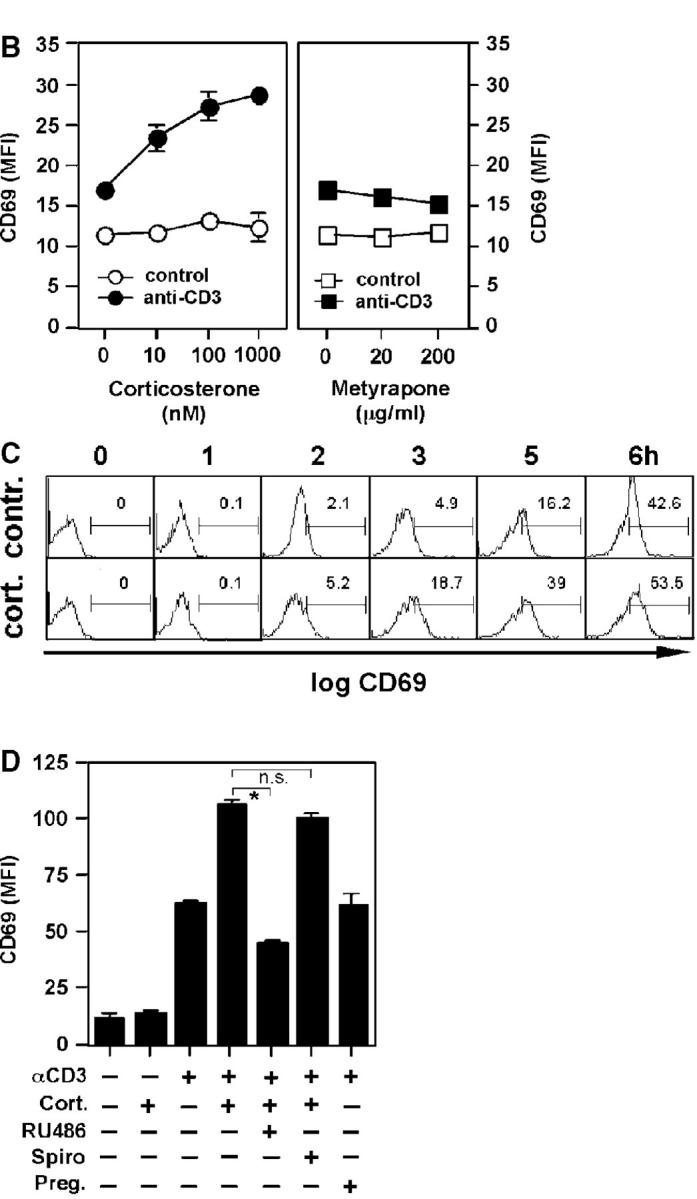
Corticosterone synergistically enhances anti-CD3–induced T cell activation. (A) A1.1 T cells were left untreated or stimulated with anti-CD3 in the presence or absence of corticosterone. Cells were then stained with isotype control (shaded histogram) or anti-CD69 (empty histograms). Fluorescence was analyzed by flow cytometry. (B) A1.1 cells were treated with different concentrations of corticosterone or metyrapone before stimulation with anti-CD3. CD69 expression was assessed by flow cytometry. Mean values of CD69 expression (mean fluorescence intensity [MFI]) of triplicates ± SD are shown. (C) Time course (0–6 h) of CD69 induction in control- or corticosterone-treated and anti-CD3–stimulated cells. Numbers indicate the percentage of positive cells in the gate. (D) A1.1 cells were pretreated with corticosterone (Cort.; 100 nM), RU-486 (1 μM), spironolactone (Spiro; 1 μM) or pregnenolone (Preg.; 1 μM) before stimulation with medium control or anti-CD3 for 6 h. Mean values of CD69 MFI of triplicates ± SD are shown. *P < 0.05; n.s., not significant. All experiments were repeated at least three times.
Costimulation by corticosterone was clearly mediated by the GR since the GR antagonist RU486 but not the mineralocorticoid receptor antagonist spironolactone blocked the corticosterone-mediated increase in CD69 expression. No effect was seen with pregnenolone, a precursor in the GC biosynthesis pathway (Fig. 6 D).
Differential Effects of Corticosterone on Anti-CD3–induced versus Antigen-induced T Cell Activation.
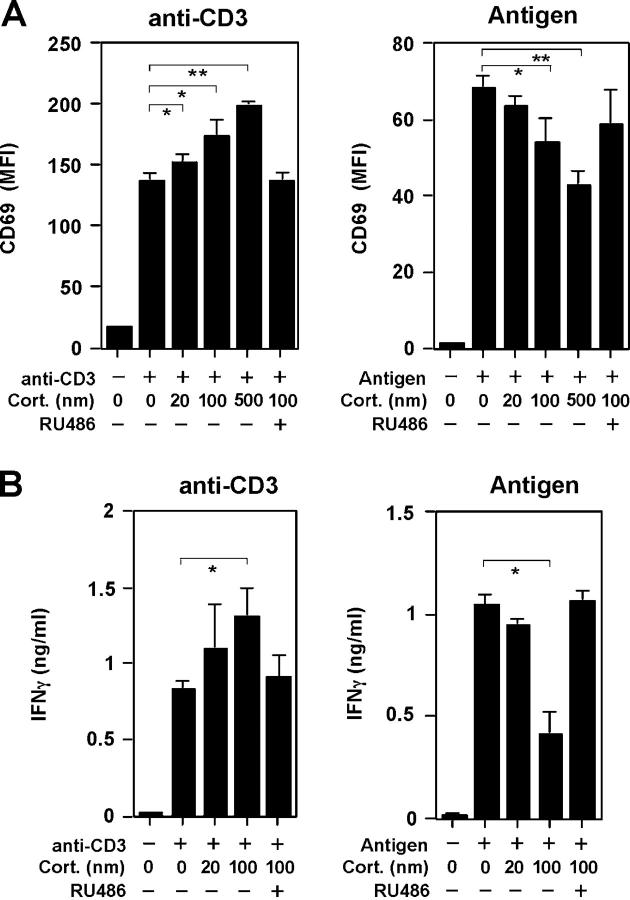
To further investigate this costimulatory versus inhibitory effect on anti-CD3–induced versus antigen–induced T cell activation, TCR tg T cells were either stimulated with plate-bound anti-CD3 or gp33 peptide-pulsed irradiated spleen cells. Interestingly, these in vitro activation experiments revealed again the same results as obtained in vivo. Anti-CD3–induced CD69 expression was enhanced by increasing concentrations of corticosterone, whereas peptide-induced activation was clearly inhibited (Fig. 7 A). Similar findings were obtained when analyzing IFNγ production (Fig. 7 B). Anti-CD3–induced cytokine production was enhanced with corticosterone, whereas antigen-induced IFNγ was inhibited. Both the costimulatory and the inhibitory effect of corticosterone on CD69 expression and IFNγ production was mediated via the GR since it was blocked by the addition of the GR antagonist RU486 (Fig. 7, A and B).
Figure 7.
Differential activity of corticosterone on anti-CD3 or peptide-activated T cells. (A) T cells from TCR tg mice were isolated and either stimulated with plate-bound anti-CD3 or gp33 peptide-pulsed irradiated spleen cells (antigen). Corticosterone at different concentrations or the GR antagonist RU486 were added at the beginning of the experiment. After overnight culture, CD69 expression (MFI) on Vα2+ CD8+ cells (TCR tg T cells) was assessed by flow cytometry. Experiments were performed in triplicates. *P < 0.05; **P < 0.005. (B) T cells were activated as described above, and IFNγ production was analyzed after 48 h. *P < 0.05. A typical experiment out of three is shown.
Discussion
Steroid hormones are crucially involved in the regulation of various physiological and pathophysiological processes, such as metabolism, development, reproduction, and immune responses (for review see reference 10). In particular, the importance of GCs produced by the adrenal glands in response to stress or immune stimulation has been recognized for decades. In the target cell, GCs bind to the GR, and upon translocation to the nucleus, may inhibit the transcription of proinflammatory cytokines, such as IFNγ, TNFα, IL-1β, IL-6, IL-8, and IL-12 (10, 11). Therefore, GCs blunt overly aggressive immune responses and may prevent subsequent serious damage to the host. This immunoregulatory role of adrenal-derived GCs on systemic immune responses has been clearly demonstrated by Gonzalo and colleagues, who showed that adrenalectomy or inhibition of the GR results in lethal septic shock upon systemic T cell activation (8). Similarly, endogenous GCs protect against cytokine-mediated lethality during viral infection (9).
Much to our surprise, we have made the paradoxical observation that GCs have a costimulatory effect on anti-CD3–induced activation of T cells but inhibit T cell activation by antigen presentation in vivo and in vitro. Thus, depending on the mode of activation GCs have both costimulatory and inhibitory activities on T cell activation. Since anti-CD3 ligation represents a direct activation mechanism independent of accessory cells, GCs may enhance T cell activation by potentially replacing the costimulatory second signal usually provided by B7-CD28 interaction. In line of this notion are reports that demonstrate elevated induction of secondary intracellular mediators in the presence of GCs (36). When T cells are activated by APCs, this costimulatory activity of GCs on T cell activation may not be required anymore for full activation, but instead GCs may have an inhibitory activity on the APC and subsequently on the T cell activation. It is thus interesting to note that GCs have potent inhibitory effects on the expression of costimulatory cytokines and cell surface molecules (10, 11).
It is very likely that this costimulatory effect of endogenous GCs on T cell activation is not mediated by the regulation of gene expression but rather based on posttranslational signal modifications (37). Both the in vivo and in vitro activation of T cells and the costimulation by corticosterone were very rapid. In vivo, we observed reduced TCR down-regulation and CD69 expression in the absence of GCs already 3 h post anti-CD3 injection (Fig. 4 C). Similarly, the costimulatory effect of corticosterone on TCR-induced CD69 expression in vitro was clearly evident after 3 h (Fig. 6 C). Taking into account that T cell activation in vivo will first have to initiate the synthesis and release of GCs by epithelial cells, which then act back on the modulation of the T cell activation, this costimulatory feedback loop via GCs has to be considered extremely fast and cannot be explained by gene induction. It is thus interesting to note that the synthetic GC dexamethasone can augment TCR-induced intracellular Ca2+ release in a GR-dependent but protein synthesis–independent manner (36). Since sustained intracellular Ca2+ release is required for proper T cell activation, this transcription-independent GR-mediated costimulation may help to pass over a certain activation threshold.
Although the adrenal glands are small in size, they have an enormous steroid-producing capacity. In response to immunological and psychological stress, the adrenals may release large amounts of GCs into the blood circulation and affect immune responses systemically. Thus, adrenal-released GCs act by definition as hormones. However, GCs can also be released into the surrounding tissue and may thus act in a paracrine manner. For example, the thymic epithelium has been recently recognized as GC-producing tissue (12, 38, 39). Thymic GCs appear to act on thymic epithelium-associated immature thymocytes and modulate their activation in response to TCR cross-linking. Using a GR antisense-targeted transgenic mouse, Ashwell and colleagues have found that locally produced GCs enhance positive selection of thymocytes (14, 40). Although this finding supports our own results, demonstrating a costimulatory role of GCs in mature T cell activation, this predicted role of GCs in thymic negative selection has been recently questioned and thus remains controversial (13, 15, 16)
Apart from the thymus, the results reported here represent the first demonstration of extraadrenal GC synthesis. Although the expression of steroidogenic enzymes has also been detected in other organs, such as brain, skin, and vascular tissue (for review see reference 41), reports on GC synthesis are sparse so far. We have found that the intestinal mucosa is capable of synthesizing and releasing considerable amounts of GCs that are likely to regulate immune effector cells in the close neighborhood. Although it has been technically very difficult to demonstrate a regulatory role for intestinal GCs due to the lack of tissue-specific inhibition of GC synthesis, our results strongly support the notion that in situ–produced GCs exhibit a regulatory activity on intestinal T cells that are in close contact with the GC-producing epithelial cells, i.e., IELs and PPLs. Various reports have shown that these intestinal T cells, in contrast to peripheral T cells, fail to be strongly activated ex vivo and only proliferate weakly in response to mitogenic stimuli (42–45). This almost anergic behavior in response to activation signals has been considered an important adaptation to the delicate local environment. It is possible that in vivo local GC synthesis may both inhibit and enhance intestinal T cell activation, depending on the mode of activation and the requirement for APCs. Thus, activation of intestinal T cells may cause the induction of GC synthesis by neighboring epithelial cells, resulting in a locally restricted regulation of intestinal immune responses. Since the release of GCs appears to be dependent on the activation of intestinal T cells, and in situ–produced GCs may only act within a limited area, it is likely that this GC-mediated costimulation of T cells remains locally confined.
Acknowledgments
The authors would like to thank the members of the Brunner and Mueller lab, and Thierry Hennet for continuous intellectual and technical support.
This work was supported by grants from the Swiss National Science Foundation, Oncosuisse and the Bernese Cancer League to T. Brunner. N. Corazza was supported by the Novartis Foundation.
The authors have no conflicting financial interests.
Abbreviations used in this paper: GC, glucocorticoid; GR, GC receptor; IEL, intraepithelial lymphocyte; LCMV, lymphocytic choriomeningitis virus; PPL, Peyer's patch lymphocyte; tg, transgenic.
References
- 1.Powrie, F. 1995. T cells in inflammatory bowel disease: protective and pathogenic roles. Immunity. 3:171–174. [DOI] [PubMed] [Google Scholar]
- 2.Smith, K.M., A.D. Eaton, L.M. Finlayson, and P. Garside. 2000. Oral tolerance. Am. J. Respir. Crit. Care Med. 162:S175–S178. [DOI] [PubMed] [Google Scholar]
- 3.Husband, A.J., K.W. Beagley, and J.R. McGhee. 1999. Mucosal cytokines. Mucosal Immunology. J.R. McGhee, editor. Academic Press, San Diego, CA. 541–557.
- 4.Maloy, K.J., and F. Powrie. 2001. Regulatory T cells in the control of immune pathology. Nat. Immunol. 2:816–822. [DOI] [PubMed] [Google Scholar]
- 5.Groux, H., and F. Powrie. 1999. Regulatory T cells and inflammatory bowel disease. Immunol. Today. 20:442–445. [DOI] [PubMed] [Google Scholar]
- 6.Chrousos, G.P. 1995. The hypothalamic-pituitary-adrenal axis and immune-mediated inflammation. N. Engl. J. Med. 332:1351–1362. [DOI] [PubMed] [Google Scholar]
- 7.De Bosscher, K., W. Vanden Berghe, and G. Haegeman. 2003. The interplay between the blucocorticoid receptor and nuclear factor-kappaB or activator protein-1: molecular mechanisms for gene repression. Endocr. Rev. 24:488–522. [DOI] [PubMed] [Google Scholar]
- 8.Gonzalo, J.A., A. Gonzalez-Garcia, C. Martinez-A., and G. Kroemer. 1993. Glucocorticoid-mediated control of the activation and clonal deletion of peripheral T cells in vivo. J. Exp. Med. 177:1239–1246. [DOI] [PMC free article] [PubMed] [Google Scholar]
- 9.Ruzek, M.C., B.D. Pearce, A.H. Miller, and C.A. Biron. 1999. Endogenous glucocorticoids protect against cytokine-mediated lethality during viral infection. J. Immunol. 162:3527–3533. [PubMed] [Google Scholar]
- 10.Sapolsky, R.M., L.M. Romero, and A.U. Munck. 2000. How do glucocorticoids influence stress responses? Integrating permissive, suppressive, stimulatory, and preparative actions. Endocr. Rev. 21:55–89. [DOI] [PubMed] [Google Scholar]
- 11.Wilckens, T., and R. De Rijk. 1997. Glucocorticoids and immune function: unknown dimensions and new frontiers. Immunol. Today. 18:418–424. [DOI] [PubMed] [Google Scholar]
- 12.Vacchio, M.S., V. Papadopoulos, and J.D. Ashwell. 1994. Steroid production in the thymus: implications for thymocyte selection. J. Exp. Med. 179:1835–1846. [DOI] [PMC free article] [PubMed] [Google Scholar]
- 13.Ashwell, J.D., F.W. Lu, and M.S. Vacchio. 2000. Glucocorticoids in T cell development and function. Annu. Rev. Immunol. 18:309–345. [DOI] [PubMed] [Google Scholar]
- 14.Vacchio, M.S., and J.D. Ashwell. 1997. Thymus-derived glucocorticoids regulate antigen-specific positive selection. J. Exp. Med. 185:2033–2038. [DOI] [PMC free article] [PubMed] [Google Scholar]
- 15.Mittelstadt, P.R., and J.D. Ashwell. 2003. Disruption of glucocorticoid receptor exon 2 yields a ligand-responsive C-terminal fragment that regulates gene expression. Mol. Endocrinol. 17:1534–1542. [DOI] [PubMed] [Google Scholar]
- 16.Godfrey, D.I., J.F. Purton, R.L. Boyd, and T.J. Cole. 2000. Stress-free T-cell development: glucocorticoids are not obligatory. Immunol. Today. 21:606–611. [DOI] [PubMed] [Google Scholar]
- 17.MacKenzie, S.M., C.J. Clark, R. Fraser, C.E. Gomez-Sanchez, J.M. Connell, and E. Davies. 2000. Expression of 11beta-hydroxylase and aldosterone synthase genes in the rat brain. J. Mol. Endocrinol. 24:321–328. [DOI] [PubMed] [Google Scholar]
- 18.Gomez-Sanchez, C.E., M.Y. Zhou, E.N. Cozza, H. Morita, F.C. Eddleman, and E.P. Gomez-Sanchez. 1996. Corticosteroid synthesis in the central nervous system. Endocr. Res. 22:463–470. [DOI] [PubMed] [Google Scholar]
- 19.Keeney, D.S., Y. Ikeda, M.R. Waterman, and K.L. Parker. 1995. Cholesterol side-chain cleavage cytochrome P450 gene expression in the primitive gut of the mouse embryo does not require steroidogenic factor 1. Mol. Endocrinol. 9:1091–1098. [DOI] [PubMed] [Google Scholar]
- 20.Belvedere, P., L. Dalla Valle, S. Vianello, O. Carnevali, and L. Colombo. 2001. Hormonal steroidogenesis in liver and small intestine of the green frog, Rana esculenta L. Life Sci. 69:2921–2930. [DOI] [PubMed] [Google Scholar]
- 21.Brunner, T., R.J. Mogil, D. La Face, N.J. Yoo, A. Mahboubi, F. Echeverri, S.J. Martin, W.R. Force, D.H. Lynch, C.F. Ware, et al. 1995. Cell-autonomous Fas (CD95)/Fas-ligand interaction mediates activation-induced apoptosis in T-cell hybridomas. Nature. 373:441–444. [DOI] [PubMed] [Google Scholar]
- 22.Bens, M., A. Bogdanova, F. Cluzeaud, L. Miquerol, S. Kerneis, J.P. Kraehenbuhl, A. Kahn, E. Pringault, and A. Vandewalle. 1996. Transimmortalized mouse intestinal cells (m-ICc12) that maintain a crypt phenotype. Am. J. Physiol. 270:C1666–C1674. [DOI] [PubMed] [Google Scholar]
- 23.Hibberts, N.A., A.E. Howell, and V.A. Randall. 1998. Balding hair follicle dermal papilla cells contain higher levels of androgen receptors than those from non-balding scalp. J. Endocrinol. 156:59–65. [DOI] [PubMed] [Google Scholar]
- 24.Sampath-Kumar, R., M. Yu, M.W. Khalil, and K. Yang. 1997. Metyrapone is a competitive inhibitor of 11beta-hydroxysteroid dehydrogenase type 1 reductase. J. Steroid Biochem. Mol. Biol. 62:195–199. [DOI] [PubMed] [Google Scholar]
- 25.Sprunt, J.G., and D.M. Hannah. 1968. A comparison of the potency of some 11beta-hydroxylase inhibitors using rat and human adrenal tissue. J. Endocrinol. 41:xxvi. [PubMed] [Google Scholar]
- 26.Lin, T., T. Brunner, B. Tietz, J. Madsen, E. Bonfoco, M. Reaves, M. Huflejt, and D.R. Green. 1998. Fas ligand-mediated killing by intestinal intraepithelial lymphocytes. Participation in intestinal graft-versus-host disease. J. Clin. Invest. 101:570–577. [DOI] [PMC free article] [PubMed] [Google Scholar]
- 27.Traber, P.G., D.L. Gumucio, and W. Wang. 1991. Isolation of intestinal epithelial cells for the study of differential gene expression along the crypt-villus axis. Am. J. Physiol. 260:G895–G903. [DOI] [PubMed] [Google Scholar]
- 28.Corazza, N., S. Eichenberger, H.P. Eugster, and C. Mueller. 1999. Nonlymphocyte-derived tumor necrosis factor is required for induction of colitis in recombination activating gene (RAG)2(−/−) mice upon transfer of CD4(+)CD45RB(hi) T cells. J. Exp. Med. 190:1479–1492. [DOI] [PMC free article] [PubMed] [Google Scholar]
- 29.Laurent, V., A. Kimble, B. Peng, P. Zhu, J.E. Pintar, D.F. Steiner, and I. Lindberg. 2002. Mortality in 7B2 null mice can be rescued by adrenalectomy: involvement of dopamine in ACTH hypersecretion. Proc. Natl. Acad. Sci. USA. 99:3087–3092. [DOI] [PMC free article] [PubMed] [Google Scholar]
- 30.de Quervain, D.J., B. Roozendaal, and J.L. McGaugh. 1998. Stress and glucocorticoids impair retrieval of long-term spatial memory. Nature. 394:787–790. [DOI] [PubMed] [Google Scholar]
- 31.Brunner, T., D. Arnold, C. Wasem, S. Herren, and C. Frutschi. 2001. Regulation of cell death and survival in intestinal intraepithelial lymphocytes. Cell Death Differ. 8:706–714. [DOI] [PubMed] [Google Scholar]
- 32.Wasem, C., D. Arnold, L. Saurer, N. Corazza, S. Jakob, S. Herren, C. Vallan, C. Mueller, and T. Brunner. 2003. Sensitizing antigen-specific CD8+ T cells for accelerated suicide causes immune incompetence. J. Clin. Invest. 111:1191–1199. [DOI] [PMC free article] [PubMed] [Google Scholar]
- 33.Schaaf, M.J., and J.A. Cidlowski. 2003. Molecular determinants of glucocorticoid receptor mobility in living cells: the importance of ligand affinity. Mol. Cell. Biol. 23:1922–1934. [DOI] [PMC free article] [PubMed] [Google Scholar]
- 34.Wiegers, G.J., J.M. Reul, F. Holsboer, and E.R. de Kloet. 1994. Enhancement of rat splenic lymphocyte mitogenesis after short term preexposure to corticosteroids in vitro. Endocrinology. 135:2351–2357. [DOI] [PubMed] [Google Scholar]
- 35.Roozendaal, B., B. Bohus, and J.L. McGaugh. 1996. Dose-dependent suppression of adrenocortical activity with metyrapone: effects on emotion and memory. Psychoneuroendocrinology. 21:681–693. [DOI] [PubMed] [Google Scholar]
- 36.Nambiar, M.P., E.J. Enyedy, C.U. Fisher, V.G. Warke, and G.C. Tsokos. 2001. High dose of dexamethasone upregulates TCR/CD3-induced calcium response independent of TCR zeta chain expression in human T lymphocytes. J. Cell. Biochem. 83:401–413. [DOI] [PubMed] [Google Scholar]
- 37.Losel, R., and M. Wehling. 2003. Nongenomic actions of steroid hormones. Nat. Rev. Mol. Cell Biol. 4:46–56. [DOI] [PubMed] [Google Scholar]
- 38.Lechner, O., G.J. Wiegers, A.J. Oliveira-Dos-Santos, H. Dietrich, H. Recheis, M. Waterman, R. Boyd, and G. Wick. 2000. Glucocorticoid production in the murine thymus. Eur. J. Immunol. 30:337–346. [DOI] [PubMed] [Google Scholar]
- 39.Pazirandeh, A., Y. Xue, I. Rafter, J. Sjovall, M. Jondal, and S. Okret. 1999. Paracrine glucocorticoid activity produced by mouse thymic epithelial cells. FASEB J. 13:893–901. [DOI] [PubMed] [Google Scholar]
- 40.Vacchio, M.S., J.Y. Lee, and J.D. Ashwell. 1999. Thymus-derived glucocorticoids set the thresholds for thymocyte selection by inhibiting TCR-mediated thymocyte activation. J. Immunol. 163:1327–1333. [PubMed] [Google Scholar]
- 41.Davies, E., and S.M. MacKenzie. 2003. Extra-adrenal production of corticosteroids. Clin. Exp. Pharmacol. Physiol. 30:437–445. [DOI] [PubMed] [Google Scholar]
- 42.Gramzinski, R.A., E. Adams, J.A. Gross, T.G. Goodman, J.P. Allison, and L. Lefrancois. 1993. T cell receptor-triggered activation of intraepithelial lymphocytes in vitro. Int. Immunol. 5:145–153. [DOI] [PubMed] [Google Scholar]
- 43.Beagley, K.W., and A.J. Husband. 1998. Intraepithelial lymphocytes: origins, distribution, and function. Crit. Rev. Immunol. 18:237–254. [DOI] [PubMed] [Google Scholar]
- 44.Ebert, E.C. 1989. Proliferative responses of human intraepithelial lymphocytes to various T-cell stimuli. Gastroenterology. 97:1372–1381. [DOI] [PubMed] [Google Scholar]
- 45.Mosley, R.L., M. Whetsell, and J.R. Klein. 1991. Proliferative properties of murine intestinal intraepithelial lymphocytes (IEL): IEL expressing TCR alpha beta or TCR tau delta are largely unresponsive to proliferative signals mediated via conventional stimulation of the CD3-TCR complex. Int. Immunol. 3:563–569. [DOI] [PubMed] [Google Scholar]


