Abstract
Alternative mRNA splicing patterns are determined by the combinatorial control of regulator proteins and their target RNA sequences. We have recently characterized human hnRNP L as a global regulator of alternative splicing, binding to diverse C/A-rich elements. To systematically identify hnRNP L target genes on a genome-wide level, we have combined splice-sensitive microarray analysis and an RNAi-knockdown approach. As a result, we describe 11 target genes of hnRNP L that were validated by RT-PCR and that represent several new modes of hnRNP L-dependent splicing regulation, involving both activator and repressor functions: first, intron retention; second, inclusion or skipping of cassette-type exons; third, suppression of multiple exons; and fourth, alternative poly(A) site selection. In sum, this approach revealed a surprising diversity of splicing-regulatory processes as well as poly(A) site selection in which hnRNP L is involved.
Keywords: splicing; alternative splicing, hnRNP; polyadenylation; microarray
INTRODUCTION
Alternative mRNA splicing in the human system is relevant for at least three-quarters of the protein-coding genes and contributes to generating complex proteomes from the relatively low number of human genes (Modrek and Lee 2002; Black 2003; Ast 2004). How are tissue and cell-type specificity, developmental control, and specificity on the level of exons and introns achieved? It is generally believed that combinatorial control acts on several levels, integrating the signals of multiple splicing regulators that bind to their cognate recognition sites on the pre-mRNA: Splicing regulators can function either as activators or repressors, typical representatives being members of the SR and hnRNP protein families, respectively; regulatory sequence elements can be either exonic or intronic, and function either as enhancers or silencers. Splicing-regulatory complexes, that are often assembled from several protein factors on clustered, composite sequence elements, communicate with the general splicing machinery, modulating its ability to activate or repress specific splice sites.
Here we focus on hnRNP L, an abundant nuclear protein (Piñol-Roma et al. 1989), which we have recently identified as a global regulator on the level of mRNA splicing (Hui et al. 2003a, 2005); in addition, roles in mRNA export of intronless genes (Liu and Mertz 1995; Guang et al. 2005), IRES-mediated translation (Hahm et al. 1998a), and mRNA stability (Shih and Claffey 1999; Hui et al. 2003b) are documented. As a common characteristic of all these diverse functions, we had uncovered hnRNP L's RNA binding specificity, based on a SELEX analysis (Hui et al. 2005): Not only CA-repeat motifs, but also certain C/A-rich elements determine high-affinity binding of hnRNP L, often occur in clusters, and are valuable in predicting hnRNP L binding. Interestingly, these targets of hnRNP L reside in intronic or exonic sequences.
Examples for intronic hnRNP L binding sites are known for the human eNOS gene (Hui et al. 2003a), several other target genes (Hui et al. 2005), and the mouse ITGA gene (Cheli and Kunicki 2006). From intronic positions, hnRNP L can activate or repress upstream alternative exons, probably depending on the 5′ splice site proximity (Hui et al. 2005). Alternatively, based on recent studies on the variable exons in the CD45 gene, exonic sequences can be targeted by hnRNP L, leading to exon repression (Rothrock et al. 2005; House and Lynch 2006).
An initial genome-wide search for alternative splicing targets of hnRNP L, based on its binding specificity and available EST data, yielded only few target genes that were validated (Hui et al. 2005). CA-repetitive sequences, however, occur in the human genome at a frequency of 19.4 CA repeats per megabase, representing the most common simple sequence repeat motif (Waterston et al. 2002). Considering the wide abundance of CA-repeat and C/A-rich sequences as well as the high abundance of hnRNP L protein, it seemed likely there are many more targets in the human genome. How can we effectively identify more hnRNP L targets, which are regulated in their alternative splicing pattern?
In this study, we have combined an exon-specific microarray platform and RNAi-mediated knockdown to search for alternative splicing changes in response to hnRNP L depletion. In addition, we describe a paralog of hnRNP L, the hnRNP L-like protein (also called hnRNP LL in the following), which is closely related to the classical hnRNP L. We compare effects of RNAi knockdowns of hnRNP L, LL, and both of them. As a result, 11 hnRNP L-regulated alternative splicing events were discovered and experimentally confirmed, including novel modes of how hnRNP L regulates splice site choice as well as poly(A) site selection.
RESULTS
RNAi-mediated knockdown of hnRNP L and LL, two closely related RNA-binding proteins
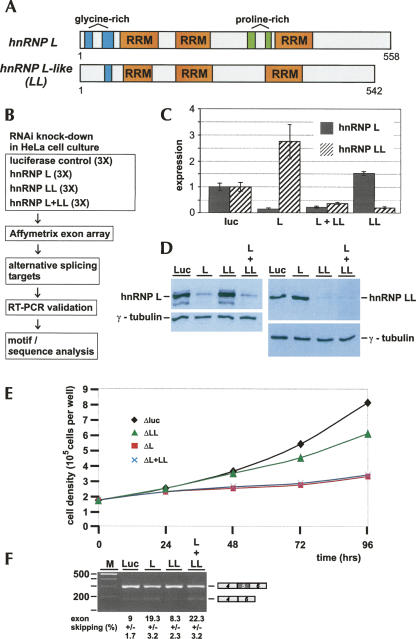
In addition to hnRNP L (P14866), the NCBI database lists a closely related gene now annotated as hnRNP L-like (hnRNP LL; Q53T80). These two proteins of 58% overall amino acid identity are very similar in size (558 versus 542 amino acids) and share their domain organization, in particular three classical RNA-recognition motifs (RRMs) (Fig. 1A). The N-terminal Gly-rich regions of hnRNP L are less pronounced in the LL paralog, and the Pro-rich regions between RRMs 2 and 3 of hnRNP L are absent in LL.
FIGURE 1.
Genome-wide search for hnRNP L-regulated alternative splicing targets: combined microarray/RNAi strategy. (A) hnRNP L and LL, two closely related RNA-binding proteins. The domain structures of hnRNP L (P14866; 558 amino acids) and LL (Q53T80; 542 amino acids) are schematically represented (three canonical RRM motifs as orange boxes; glycine- and proline-rich regions in blue and green, respectively). (B) Outline of microarray/RNAi strategy. (C,D) RNAi knockdown of hnRNP L and LL: validation by (C) quantitative RT-PCR and (D) Western blotting. HeLa cells were treated with siRNA oligonucleotides specific for hnRNP L, LL, both L and LL, or as a control, luciferase mRNAs. (C) Relative mRNA levels are diagrammed (filled bars, hnRNP L; striped bars, hnRNP LL), normalized to luciferase. (D) Lysates were prepared after knockdowns (as indicated above the lanes), and hnRNP L (left panel), hnRNP LL (right panel), and as internal standard, γ-tubulin (lower panels) were detected by Western blotting. (E) Growth curves of HeLa cell cultures after RNAi knockdown of hnRNP L, LL, and L/LL double knockdown. HeLa cell cultures were treated with siRNA oligonucleotides specific for hnRNP L (ΔL; red squares), hnRNP LL (ΔLL; green triangles), or both L and LL (ΔL + ΔLL; blue crosses); luciferase knockdown served as a control (Δluc; black diamonds). After 24, 48, 72, and 96 h, cell densities were measured. (F) Alternative splicing of endogenous GSTZ1 mRNA. Total RNA was prepared after knockdown in HeLa cells (as indicated above the lanes), and alternative splicing of endogenous GSTZ1 mRNA (exon 5 skipping, as schematically shown on the right) was assayed by semiquantitative RT-PCR; exon skipping is quantitated as a percentage below. (M) DNA size markers (DNA ladder mix; Fermentas).
Figure 1B illustrates our general strategy of searching for alternative splicing targets of hnRNP L and LL: Either hnRNP L, LL, or both in combination were down-regulated in HeLa cell culture by specific double-stranded siRNAs, with luciferase knockdown serving as a control; each of these RNAi knockdown reactions was carried out in three biological replicates. RNA was prepared and processed through the Affymetrix Human Exon Array, followed by data analysis (for details, see the next section and Materials and Methods). Candidate targets were validated by gene-specific RT-PCR assays, using total RNA after knockdown in HeLa cells. Finally, we analyzed hnRNP L binding sites in target regions by a motif search program.
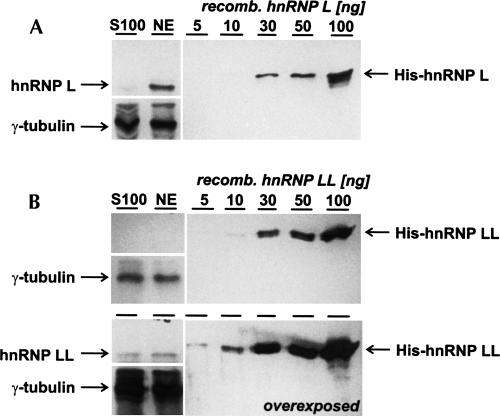
First, efficient RNAi conditions were established in HeLa cell culture that allowed the selective down-regulation of hnRNP L and LL, as assayed both by qRT-PCR for mRNA and Western blotting for protein expression (Fig. 1C,D, respectively). For quantitating mRNA expression, levels were normalized with the mRNA levels in the luciferase control: HnRNP L mRNA was down-regulated to 17% and hnRNP LL to 21%. Interestingly, in both knockdown reactions of the individual hnRNP proteins, the mRNA of the respective other factor was up-regulated: Specifically, in the knockdown of hnRNP L, the mRNA levels for hnRNP LL were increased almost threefold, and in the LL knockdown, the mRNA for hnRNP L 1.5-fold. Silencing both factors simultaneously reduced mRNA levels of hnRNP L and LL to 23% and 39%, respectively (Fig. 1C). Very efficient and paralog-selective reductions of protein levels were also observed by Western blot analysis, using γ-tubulin as an internal reference protein (Fig. 1D) and confirmed the reciprocal regulation of hnRNP L and LL. Specifically, we measured, in a separate experiment by serial dilution and Western blot analysis, that hnRNP L knockdown resulted in an increase of LL protein levels by 47% (±24%), and hnRNP LL knockdown in an increase of hnRNP L protein levels by 55% (±8%) (data not shown). In addition, growth curves were determined after luciferase control, hnRNP L, hnRNP LL, and L/LL double knockdown: We observed a severe growth defect for both hnRNP L and L/LL double knockdown, indicating an essential role of hnRNP L, whereas hnRNP LL knockdown resulted only in a moderate effect on cell growth (Fig. 1E). Off-target effects were ruled out, as we observed the same alterations in alternative splicing patterns with two different hnRNP L-specific siRNAs (data not shown). In interpreting RNAi results, we have to consider that absolute hnRNP L protein levels in HeLa nuclear extracts are approximately 10-fold higher than those of hnRNP LL, as quantitated by Western blotting (4 μg of hnRNP L and 0.4 μg of hnRNP LL per milligram of total protein in HeLa nuclear extract); in addition, hnRNP L could be recovered predominantly from nuclear extract, in contrast to hnRNP LL, which was detected in similar amounts in cytoplasmic and nuclear extracts (Fig. 2).
FIGURE 2.
Quantitation of hnRNP L and LL protein levels. (A,B) Cytoplasmic (lanes S100) and nuclear (lanes NE) extracts were prepared from HeLa cells (Lee et al. 1988), and 12.5 μg of total protein from each extract was subjected to Western blot analysis, with γ-tubulin Western signals serving as an internal standard. Signals were quantitated by comparing with Western signals obtained with recombinant His-tagged hnRNP L/LL proteins (5, 10, 30, 50, or 100 ng of either protein, as indicated above the lanes). (A) hnRNP L was detected by monoclonal antibody 4D11, (B) hnRNP LL by our own antibody (see Materials and Methods). To visualize the less abundant hnRNP LL in B, two different exposures are shown (overexposure at the bottom). The electrophoretic positions of His-tagged hnRNP L, -LL, and of γ-tubulin are marked on the sides.
As an initial test for whether hnRNP L down-regulation affects alternative splicing, we assayed splicing of an endogenous gene, GSTZ1; we had recently demonstrated by minigene analysis that GSTZ1 exon 5 inclusion critically depends on an intronic, C/A-rich enhancer element that binds hnRNP L and is located near the 5′-splice site of exon 5 (Hui et al. 2005). Here we assayed alternative splicing of the endogenous GSTZ1 gene, following hnRNP L and LL knockdown (Fig. 1F): Exon 5 skipping was significantly increased after down-regulating hnRNP L or both L and L-like (19% and 22% skipping, respectively, compared with 9% in the control knockdown), whereas down-regulation of hnRNP LL alone had no significant effect. This result provided initial evidence that our combined RNAi/exon array approach in principle should be able to reveal new hnRNP L targets.
Alternative splicing targets detected by microarray/RNAi approach: General strategy
Our data analysis is based on the mathematical model that the ratio of mRNA concentration between two sample groups [knockdown (kn) versus luciferase (luc) control] is close to the ratio of expression signals (R_EXP), as detected by microarray. Expression signals (EXP) are determined by three factors: mRNA concentration (CON), probe affinity factor (AF), and signal background (bg). Based on this, we can calculate the R_EXP value of the probe as follows:
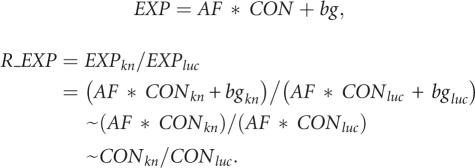 |
The higher AF * CON is relative to the bg value, the better the R_EXP value reflects the ratio of mRNA concentrations (CONkn/CONluc), and the better the information is that this probe yields. In contrast, if the bg value is higher than the AF * CON value, the R_EXP value is close to 1, and this probe yields no information. For easier calculation and graphic presentation, we use the log2 value of R_EXP (called dR; see also Materials and Methods). A dR value close to zero (a R_EXP value close to 1) indicates that either there is no significant change of mRNA concentration between the two samples or the probe yields no information. If there is one probe set or a group of probe sets with significantly lower or higher dR values, compared to the rest of the probe sets within that gene, this indicates that the ratio of mRNA concentration measured in different exons varies and suggests that there is an alternative splicing event. We first selected genes containing such significant probe sets, performed the filtering process (as described in Materials and Methods), and generated a target gene list. The second step was to predict the possible alternative splicing event by examining the distribution of the probe-set dR values within that gene (described in detail in Figs. 3–6). Third, predicted alternative splicing events had to be experimentally validated by semiquantitative RT-PCR assays.
FIGURE 3.
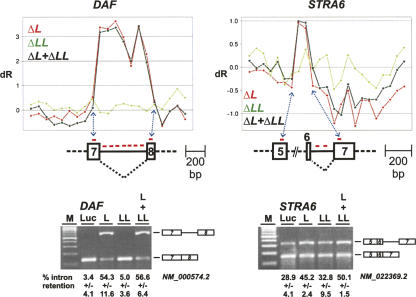
Combined microarray/RNAi approach: Detection and validation of intron retention cases. Detection of intron retention targets (upper panels). The diagrams show log2 ratios of probe-set signal intensities from the microarray data across the DAF gene, each relative to the luciferase control values. For each probe set (X-axis), three values are given (Y-axis: ΔL, knockdown of hnRNP L, in red; ΔLL, knockdown of hnRNP LL, in green; ΔL + ΔLL, knockdown of both hnRNP L and LL, in black). Probe-set positions in the retained intron and flanking regions are shown below. RT-PCR validation of intron retention in DAF (NM_000574.2) and STRA6 (NM_022369.2) genes (lower panels). Total RNA was prepared after knockdown in HeLa cells (as indicated above the lanes), and alternative splicing of endogenous DAF and STRA6 mRNAs was measured by RT-PCR. The percentages of intron retention are listed with standard deviations (n = 3) below the corresponding lanes. (M) DNA size markers (DNA ladder mix; Fermentas).
FIGURE 6.
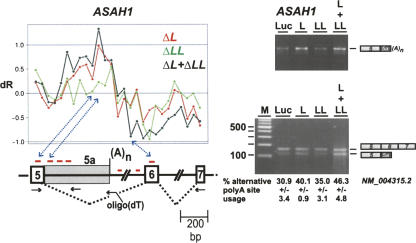
Alternative poly(A) site selection. Target detection of alternative polyadenylation in ASAH1 (NM_004315.2) (left panel; legends for X- and Y-axes as in Fig. 3). Probe-set positions in exon 5, intron 6, and exon 6 region of ASAH1 mRNA are shown below, together with positions and directions of the primers used [three gene-specific primers by arrows; oligo(dT) primer]. RT-PCR validation (right panels). Total RNA was prepared after knockdown in HeLa cells (as indicated above the lanes), and splicing/alternative polyadenylation of endogenous ASAH1 mRNA was assayed by RT-PCR. (Upper gel photo) oligo(dT) primer combined with exon 5 forward primer, reflecting use of internal poly(A) site. (Lower gel photo) Combination of three gene-specific primers as shown on the left, resulting in two products that reflect spliced mRNA and internally polyadenylated mRNA (as indicated on the side). The percentages of internal polyadenylation are given below the corresponding lanes (signal of lower band compared to the sum of both bands; with standard deviations, n = 3; since different reverse primers are used, these values do not yield absolute numbers on the mRNA variants but allow the comparison between the control and knockdown samples). (M) DNA size markers (DNA ladder mix; Fermentas).
As described in detail below, we were able to validate alternative splicing in 11 target gene regions by semiquantitative RT-PCR, using RNA prepared from at least three independent RNAi experiments. In Figures 3–6, the dR values of each probe set (knockdown of hnRNP L, LL, or both L/LL relative to the luciferase control; called ΔL, ΔLL, ΔL + ΔLL in the following) were plotted on the Y-axis, corresponding to their 5′-to-3′ position in the particular gene region (X-axis). Probe sets in the intron region of refSeq mRNA were included only if they had significant dR values. The schematic exon-intron structure of the alternatively spliced region including probe-set locations is shown below each plot.
Detection of intron retention
In the first example, DAF (=CD55) (Fig. 3), all seven probe sets in intron 7 (510 nucleotides [nt]) have significantly higher dR values in ΔL and ΔL + ΔLL compared with all other probe sets. This suggests an increase of intron retention after hnRNP L and L/LL double knockdown, but not after the LL knockdown. RT-PCR assays confirmed this (panel DAF): Intron retention increased from background levels in the control sample (lane Luc) to >50% when hnRNP L was down-regulated (lanes L and L + LL).
Another example of intron retention was discovered in STRA6, where two probe sets in intron 6 (183 nt) have higher dR values in ΔL and ΔL + ΔLL compared with all other probe sets. This indicated that splicing or retention of intron 6 was affected by knockdown of hnRNP L and by the double knockdown; again, hnRNP LL knockdown produced no significant effect (panel STRA6). Here intron retention levels increased from 29% (lane Luc) to 45% and 50% (lanes L and L + LL, respectively). Genomic DNA contamination was ruled out for both DAF and STRA6 by carrying out control reactions in the absence of reverse transcription (data not shown). We conclude that in both cases of intron retention, DAF intron 7 and STRA6 intron 6, hnRNP L acts as a splicing activator, promoting the efficient removal of a specific intron.
Exon skipping and inclusion
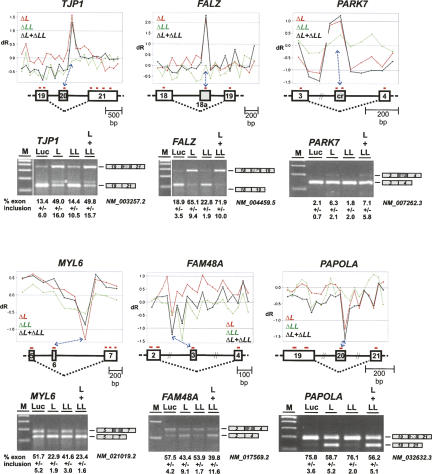
Next we describe a set of alternative splicing targets where hnRNP L knockdown affected exon skipping (Fig. 4).
FIGURE 4.
Exon skipping and inclusion. Target detection in TJP1 (NM_003257.2), FALZ (NM_004459.5), PARK7 (NM_007262.3), MYL6 (NM_021019.2), FAM48A (NM_017569.2), and PAPOLA (NM_032632.3) mRNAs (upper panels; legends for X- and Y-axes as in Fig. 3). For each gene, probe-set positions in the cassette exon and its flanking regions are shown below. In case of FAM48A, the other probe set with a significant low dR value was filtered out, because its P-value was too high. (Lower panels) RT-PCR validation. Total RNA was prepared after knockdown in HeLa cells (as indicated above the lanes), and alternative splicing of the six endogenous genes assayed by RT-PCR. Note that for TJP1 the additional minor band (asterisk) above the lower band represents an RT-PCR product due to mispriming within exon 20 (data not shown). The percentages of exon inclusion are listed with standard deviations (n = 3) below the corresponding lanes. (M) DNA size markers (DNA ladder mix; Fermentas).
The case of TJP1 shows that a single probe set located in exon 20 of TJP1 exhibited higher dR values in ΔL and ΔL + ΔLL (panel TJP1), indicating an increase in exon inclusion upon hnRNP L and L/LL double knockdown. This was confirmed by RT-PCR assays (Fig. 4, panel TJP1: increase from 13% to 49%–50%; cf. lanes Luc, L, and L + LL). In addition to TJP1, two more candidate gene regions showed the same behavior: FALZ (exon 18a within intron 18 [nucleotides 358–519]), where one probe set gave higher dR values for ΔL and ΔL + ΔLL, and PARK7 (alternative exon 3a within intron 3 [nucleotides 3660–3723]), where two probe sets had higher dR values for ΔL and ΔL + ΔLL (panels FALZ and PARK). Similarly as seen for TJP1, this effect was very strong for FALZ (increase of exon inclusion from 19% to 65%/72%), for PARK7 comparatively weak (from 2% to 6%/7%). Additional quantitations for the FALZ and PARK7 alternative splicing effects, using real-time PCR and primers specific for the regulated exons, confirmed that strong up-regulation was observed in case of the hnRNP L and double knockdowns, but not after hnRNP LL knockdown (data not shown).
An example for the reverse case, exon skipping upon hnRNP L knockdown, is provided by MYL6: The single probe set in exon 6 showed a lower dR value for ΔL and ΔL + ΔLL, indicating increased exon 6 skipping in response to the L and L/LL double knockdown (panel MYL6). RT-PCR assays clearly confirmed this, with the level of exon inclusion decreasing from 52% (control, lane Luc) to 23% (lanes L and L + LL). Only for this gene we found also an effect, although less severe, when hnRNP LL was down-regulated (exon inclusion decreasing to 42%). In addition, we were able to validate two further cases of this type of hnRNP L regulation, FAM48A and PAPOLA, in which hnRNP L knockdown resulted in enhanced exon skipping (FAM48A exon 3 inclusion decreasing from 58% to 43%/40%; PAPOLA exon 20 from 76% to 59%/56%) (panels FAM48A and PAPOLA).
In sum, we conclude that in these six cases of regulated cassette exons, hnRNP L can function either as a repressor (TJP1, FALZ, PARK7) or as an activator (MYL6, FAM48A, PAPOLA) of exon usage.
Suppression of multiple exons
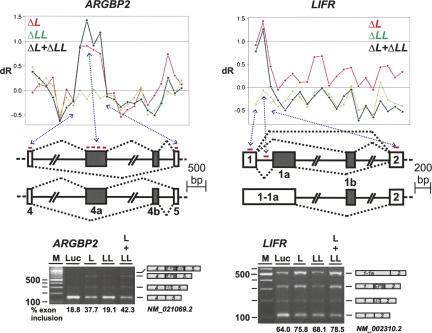
In addition to intron retention and exon skipping/inclusion, our analysis also yielded evidence for cases, where the inclusion of more than one exon was affected by hnRNP L. Figure 5 illustrates two specific examples, ARGBP2 and LIFR. For ARGBP2, this concerns intron 4 of 16.2 kb. Microarray data indicated there are four probe sets in intron 4 with higher dR for ΔL and ΔL + ΔLL. RT-PCR assays revealed three additional products larger than the product that reflects correctly spliced exons 4 and 5. After hnRNP L as well as L/LL double knockdown, these additional products became much more prominent than in the control, representing 38% and 42%, respectively, of the total spliced products compared with 19% in the control. As in previous cases, hnRNP LL down-regulation showed no significant difference from the control reaction. Cloning and sequence analysis established that these larger products represent the inclusion of two exons located in intron 4, within 4 kb from the 3′-splice site (called exons 4a [nucleotides 12,217–12,690] and 4b [nucleotides 15,704–15,872]) (see Fig. 5, panel ARGBP2).
FIGURE 5.
Suppression of multiple exons. Target detection in ARGBP2 (NM_021069.2) and LIFR mRNAs (NM_002310.2) (upper panels; legends for X- and Y-axes as in Fig. 3). Probe-set positions in the long intron and its flanking regions, as well alternative splicing patterns of ARGBP2 and LIFR mRNAs are shown below. (Lower panels) RT-PCR validation. Total RNA was prepared after knockdown in HeLa cells (as indicated above the lanes), and alternative splicing of endogenous ARGBP2 and LIFR mRNAs was assayed by RT-PCR. The identities of the RT-PCR products (as determined by sequence analysis) are diagrammed on the right. In each case, the percentages of exon inclusion (all internal exons combined) are listed below the corresponding lanes. (M) DNA size markers (DNA ladder mix; Fermentas).
In another case, LIFR, where one probe set in intron 1 had a higher dR value for ΔL and ΔL + ΔLL, three RT-PCR products appeared in addition to the exon 1–2 spliced product after hnRNP L and L/LL double knockdown that were more abundant than in the control (combining all three inclusion products, 76% and 79%, respectively, compared with 64% in the control). Again, down-regulating hnRNP LL alone showed no significant difference from the control. Sequence analysis of these RT-PCR products revealed that within the 64.6-kb-long intron 1 of LIFR, two additional, mutually exclusive internal exons became activated, which we called exons 1a and 1b (nucleotides 207–432 and 51,020–51,110, respectively); in addition, the short intron between exons 1 and 1a can also be retained, resulting in splicing of an extended first exon (called 1–1a) to exon 2 (Fig. 5, panel LIFR).
In summary, in these two cases, ARGBP2 and LIFR, hnRNP L represses the recognition of multiple exons within long introns. In addition, these examples show that on the basis of exon array data, new splice variants can be discovered.
Alternative poly(A) site selection
Another interesting and unexpected regulatory function of hnRNP L originated from the exon array analysis: alternative poly(A) site selection, which could be documented in the case of ASAH1 (Fig. 6). Three probe sets downstream from exon 5 (called 5a) showed higher dR values for ΔL and ΔL + ΔLL, and all downstream probe sets (exon 6–14) lower dR values. These data suggested that alternative polyadenylation might have produced an mRNA missing exon 6 and the following downstream exons, terminating in intron 5. Initial RT-PCR assays with oligo(dT) and an exon 5-specific primer supported this (Fig. 6, upper gel photograph). Direct evidence for the alternative polyadenylation site came from sequencing this RT-PCR product (data not shown). Then semiquantitative RT-PCR assays were done with a combination of three gene-specific primers (the exon 5–6 pair and an additional reverse primer specific for the intronic 5a region): Both after hnRNP L and L/LL double knockdown, use of this internal poly(A) site (reflected by the lower band) increased from 31% (luc control) to 40% and 46% (knockdown of L and L/LL, respectively), whereas the effect of hnRNP LL knockdown (35%) deviated only little from the control (lower gel photograph). In sum, this describes a new case of alternative poly(A) site selection, which is negatively regulated by hnRNP L.
Analysis of hnRNP L-binding motifs in target genes
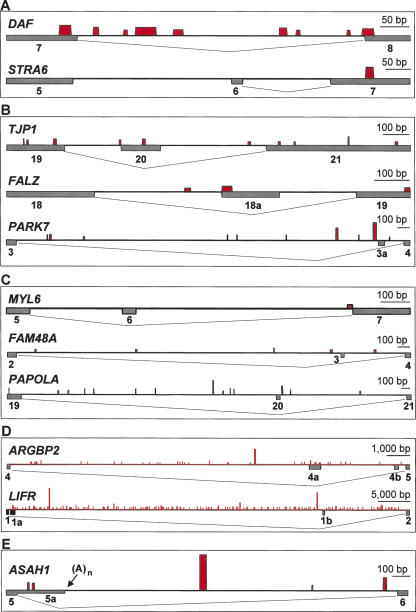
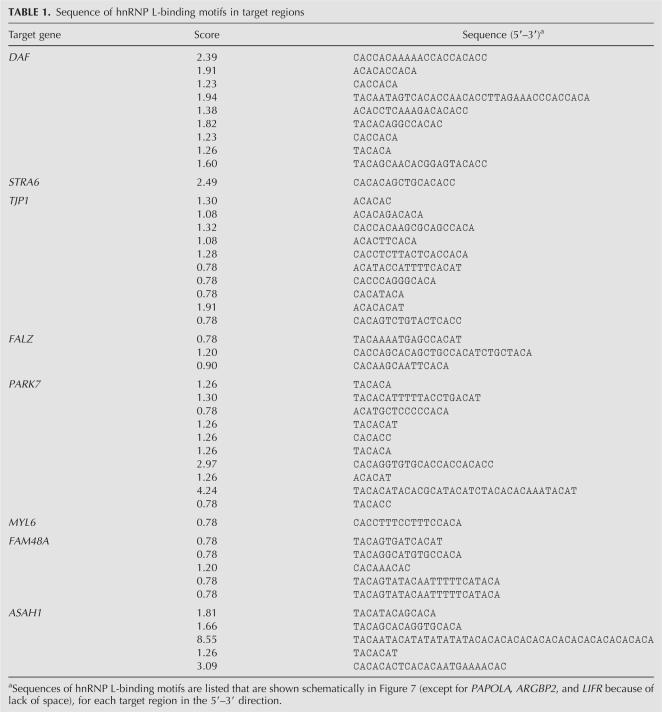
Based on the RNA-binding specificity of hnRNP L (Hui et al. 2005), we have systematically searched for hnRNP L-binding motifs in the validated target regions (Fig. 7). A scoring system was developed (see Materials and Methods for details) that takes into account the tetranucleotide frequency found in SELEX-derived hnRNP L-binding sequences (Hui et al. 2005). Potential hnRNP L-binding sites are graphically represented by red bars or lines, with their height indicating motif scores and their width reflecting the position and length of the motifs (see Table 1 for individual scores and sequences). In most cases, we found diversely positioned binding motifs, both intronic and exonic, some of them in close proximity to splice sites.
FIGURE 7.
Map of hnRNP L-binding motifs in the target regions. For each gene, the exon/intron structure is represented by lines and gray boxes below the lines; the red bars above the lines indicate positions of hnRNP L-binding motifs (the width of the bar corresponding to the length of the motifs, the height to their scores; for a description how scores were derived, see Materials and Methods; for sequences of binding motifs, see Table 1). Note that the scale differs for the various gene regions (as indicated). (A) DAF and STRA6, where hnRNP L functions as an activator and is required for efficient intron splicing. (B) TJP1, FALZ, and PARK7, where hnRNP L represses a regulated exon. (C) MYL6, FAM48A, and PAPOLA, where hnRNP L activates a regulated exon. (D) ARGBP2 and LIFR, where hnRNP L represses use of multiple exons. (E) ASAH1, where hnRNP L regulates selection of an internal poly(A) site (position indicated by arrow).
TABLE 1.
Sequence of hnRNP L-binding motifs in target regions
For the two cases of hnRNP L-dependent intron retention, where hnRNP L acts as an activator, the most striking cluster of high-score motifs occurs in DAF intron 7; in contrast, in STRA6, no motif in the regulated intron 6 and only a single motif in the downstream exon 7 were found (Fig. 7A). This correlates with our result that the effect of hnRNP L on intron retention in DAF was very strong, in fact, yielding the strongest and most robust signals in our exon array analysis (see Fig. 3).
For TJP1, FALZ, and PARK7, where hnRNP L represses exon inclusion, multiple hnRNP L-binding motifs are present in the regulated regions (Fig. 7B). One of those resides directly at the 3′-splice site of the regulated exon, either on the intronic (TJP1; PARK7) or exonic side (FALZ). On the other hand, in the cases in which hnRNP L activates exon inclusion, we found no striking similarity in the distribution of hnRNP L-binding motifs: in MYL6, a single site at the 3′-splice site of the downstream exon, in FAM48A multiple intronic motifs, and in PAPOLA, among multiple intronic motifs, one close to the 5′-splice site of the regulated exon (Fig. 7C). In ARGBP2 and LIFR, there are many potential binding sites spread over the long introns, which contain multiple hnRNP L-dependent internal exons (Fig. 7D): 54 motifs in the ARGBP2 intron 4 of ∼16 kb; 135 motifs in the LIFR intron 1 of ∼64.6 kb. Finally, several motifs were identified in ASAH1, where hnRNP L regulates internal polyadenylation (Fig. 7E).
DISCUSSION
Detecting by an unbiased microarray approach as many splice variants as possible and discovering novel ones is currently a major challenge in the field of mRNA splicing. Only a few studies have been published that applied splicing-sensitive arrays, using oligonucleotide probes in exons and/or across spliced junctions (Pan et al. 2004; Blanchette et al. 2005; Ule et al. 2005; Blencowe 2006; Gardina et al. 2006; Pan et al. 2006; Sugnet et al. 2006; Clark et al. 2007; Ip et al. 2007; Ni et al. 2007). With its capacity of 6.4 million probes on one chip, the recently available Affymetrix Human Exon Array provides the first opportunity to investigate alternative splicing of all annotated human genes in a single array. Since the probes are placed only in exons (based on expression data from all available mRNA, cDNA, and EST sequences), but not in spliced junctions, the data analysis for alternative splicing target prediction remains a major challenge.
How many alternative splicing targets do we expect for hnRNP L on a genome-wide level? Considering the high frequency of potential binding sites, both in exonic and intronic gene regions (see Introduction), one would certainly expect numbers higher than the 11 validated alternative splice events we report here. In fact, we have initially examined 50 candidate genes, based on exon array data analyses performed under different selection and filtering stringencies. This screen by RT-PCR assays with primer pairs flanking the candidate region gave alternative splicing evidence for 28 of them. Using semiquantitative RT-PCR as described in the Results section, we were able to visualize reproducible differences for 11 genes. Some of the other 17 targets with subtle effects could probably be further evaluated by improving quantitation, for example, by using isoform-specific primers and real-time PCR. Most likely there are more targets of hnRNP L and LL to be discovered. Rather than lowering the selection and filtering stringencies (at the cost of increasing the false-positive rate), it might help to extend the approach to other cell lines or to develop a combined exon/junction array.
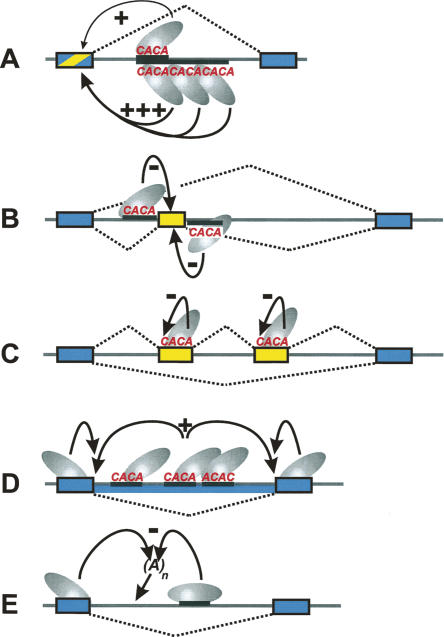
However, already with the relatively low number of 11 validated targets, our study has greatly expanded the range of splicing-regulatory activities that depend on hnRNP L. Figure 8 summarizes what we currently know about the diverse splicing-regulatory roles of hnRNP L. Initial evidence for a direct role of hnRNP L in splicing regulation came from the human eNOS gene, where a polymorphic CA-repeat region in intron 13 determines—in a CA-repeat length dependent manner—the splicing efficiency (Fig. 8A; Bilbao and Valcarcel 2003; Hui et al. 2003a; Hui and Bindereif 2005). Only subsequent studies including this one found hnRNP L to be directly involved in alternative splicing (Hui et al. 2005; Rothrock et al. 2005).
FIGURE 8.
Summary of hnRNP L activities in regulation of alternative splicing. The following regulatory activities of hnRNP L are schematically represented, with hnRNP L functioning as an activator (+) or repressor (−), and using intronic or exonic C/A-rich elements (constitutive exons as blue boxes, regulated exons in yellow). Examples for each of these models were found in this study; additional examples are cited. (D,E) Some of these mechanisms are hypothetical, in particular, whether intronic and/or exonic elements are involved in intron retention and internal polyadenylation (see Discussion for details). (A) Determining splicing efficiency of an intron or activating inclusion of an alternative exon (hnRNP L as activator; intronic C/A-rich enhancer, sometimes in a length-dependent manner) (Hui et al. 2003a; Cheli and Kunicki 2006). (B) Skipping of cassette-type exons (hnRNP L repressor, in combination with intronic C/A-rich silencer sequences either downstream or upstream of the regulated exon) (Hui et al. 2005); (C) suppression of (multiple) alternative exons/regulation of variable exons (hnRNP L repressor; exonic silencer elements) (House and Lynch 2006); (D) intron retention (hnRNP L activator; intronic or exonic hnRNP L motifs may be involved). (E) Alternative internal polyadenylation (hnRNP L repressor; intronic or exonic hnRNP L motifs may be involved).
First, several cases have accumulated in which the use of cassette-type exons is regulated by intronic C/A-rich sequences upstream or downstream of the regulated exon, acting either as enhancers (+) or silencers (−) (Fig. 8A,B; Hui et al. 2005). It is likely that the same mechanism operates, whether a 5′-splice-site-associated CA element increases splicing efficiency or enhances the use of a regulated exon. As our previous study suggested, it may be the proximity of the C/A-rich element to the regulated 5′-splice site that determines whether it enhances or represses exon recognition. New additions in this category are MYL6, FAM48A, and PAPOLA, with hnRNP L acting as activator, as well as TJP1, FALZ, and PARK7, with hnRNP L as a repressor.
Second, this study yielded evidence for a novel role of hnRNP L in the suppression of multiple exons within long introns (Fig. 8C). Specific examples of endogenous genes in this category are ARGBP2 and LIFR, where we found multiple exons to be down-regulated by hnRNP L. There are several similar cases of alternative exon activation in the literature, often caused by intronic mutations that create or strengthen splice signals or that inactivate silencer elements (Sun and Chasin 2000; Pagani et al. 2002; Tuffery-Giraud et al. 2003; Sironi et al. 2004). Finally, the CD45 example of Lynch and coworkers also falls into this category. Here several variable exons are regulated by the repressor hnRNP L and exonic silencer elements (Rothrock et al. 2005; House and Lynch 2006).
Third, we have identified two cases of intron retention that depend on hnRNP L as an activator (DAF and STRA6) (Fig. 8D). We note that in contrast to STRA6, the regulated intron in DAF is extremely C/A-rich, which predicts multiple high-affinity binding of hnRNP L (Fig. 7A).
Fourth, our microarray study revealed another new mode of hnRNP L-mediated regulation, selection of an alternative poly(A) site, which was in the ASAH1 case mapped within an intron (Fig. 8E). Recent genome-wide studies concluded that regulated polyadenylation is more common than previously thought, and that alternative polyadenylation often occurs within intronic regions (Tian et al. 2005, 2007).
Regarding mechanistic principles, we now know three ways in which hnRNP L can interact with the general splicing machinery: first, activation or repression of a 5′-splice site positioned upstream of an intronic CA-element, apparently depending on its distance (Fig. 7A,B; see Hui et al. 2003a, 2005), although we do not yet know the hnRNP L-binding partner.
Second, a new mechanism seems to operate in the case of TJP1, where hnRNP L acts as a repressor; our recent mutational analysis provided evidence for hnRNP L binding directly to a silencer element adjacent to the 3′-splice site and possibly interfering with stable U2 snRNP association (Fig. 8B; data not shown). Similar 3′-splice-site-associated potential silencer elements may operate in the case of FALZ and PARK7; however, there are additional potential binding sites nearby, so that detailed mutational analysis and binding experiments will be required to clarify this.
Third, as shown for CD45, the use of variable exons can be regulated by hnRNP L and an exonic silencer element, with hnRNP L inhibiting assembly of an exon-definition-type spliceosome after the A complex stage (House and Lynch 2006). This type of mechanism may also apply to the suppression of multiple alternative exons (Fig. 8C). Very likely these hnRNP L activities are all mediated through direct RNA binding.
Why do we observe almost all effects—with the possible exception of MYL6 (see Fig. 4B)—only after knockdown of hnRNP L, but not of the closely related hnRNP LL? For this we have to consider that in HeLa cells the hnRNP L abundance appears to be approximately 10-fold higher than for hnRNP LL; furthermore, hnRNP L is almost exclusively in the nuclear extract fraction, whereas hnRNP LL was distributed in similar amounts in cytoplasmic and nuclear extracts (Fig. 2). In addition, the reciprocal regulation of LL and L (Fig. 1C,D) and redundancy of both factors may also explain the limited effect of hnRNP LL knockdown in HeLa cells. Finally, available expression data indicate that hnRNP LL shows a tissue-specific distribution, for example, relatively high levels in testes (e.g., see http://symatlas.gnf.org). This points to a possible tissue-specific role of hnRNP LL.
In this study, we have proven the combined exon array/RNAi approach is viable, revealing efficiently and in an unbiased way splice regulator targets. Importantly, the array analysis can not only assess annotated splice variants, but can also predict new splice variants. Examples are provided by DAF, ARGBP2, LIFR, and ASAH1 genes, for which no alternative splicing evidence had been available so far. Based on exon array data, we have also uncovered alternative poly(A) site selection as a new regulatory mechanism where hnRNP L is involved (ASAH1 example).
In conclusion, our microarray-based analysis of alternative splicing will contribute to develop a systematic and robust platform to genome-wide assessing splicing regulation. This constitutes only one of several layers of gene regulation (Blencowe 2006), to be ultimately integrated into a network concept, linking transcription, post-transcriptional RNA processing other than splicing, and protein modification. In the future, such approaches should be applied also to molecular descriptions of human disease states, patient samples, and for diagnostic and prognostic purposes. Considering the high abundance and functional flexibility of short C/A-rich clusters, as well as multiple protein interactions of hnRNP L (Hahm et al. 1998b; Kim et al. 2000), it seems likely that more surprises in the genome-wide relevance of hnRNP L-mediated splicing regulation will be discovered.
MATERIALS AND METHODS
siRNA knockdown, RNA isolation, RT-PCR analysis
One day before transfection, HeLa cells were seeded in six-well culture plates (1.5 × 10⁵cells per well) or 10-cm culture dishes (4.3 × 10⁵ cells per dish). siRNA duplex (at a final concentration in culture medium of 30 nM) was transfected with Lipofectamine 2000 (Invitrogen) according to the manufacturer's instructions. siRNA duplexes specific for human hnRNP L, human hnRNP LL, and luciferase GL2 were from MWG Biotech: human hnRNP L H1, 5′-GAAUGGAGUUCAGGCGAUGTT-3′; (alternative hnRNP L siRNA initially used: 5′-CUACGAUGACCCGCACAAATT-3′); human hnRNP LL, 5′-AGUGCAACGUAUUGUUAUATT-3′; and luciferase GL2, 5′-CGUACGCGGAAUACUUCGATT-3′.
Four days after siRNA transfection, total RNA was isolated using Trizol (Invitrogen) and RNeasy kit (QIAGEN). Total RNA (5 μg) was primed by oligo d(T)18 or random hexamer primer and reverse-transcribed by SuperScript III RNase-H− reverse transcriptase (Invitrogen) according to the manufacturer's instructions.
Real-time PCR assays for hnRNP L, LL, and β-actin mRNAs were performed in an iCycler (Bio-Rad), using SYBR Green Jumpstart Taq Readymix kit (Bio-Rad) and primer pairs hnRNP L fwd/rev, hnRNP LL fwd/rev, and β-actin 703/994. They generated no primer dimers according to the melting curve analysis and resulted in nearly 100% amplification efficiency. The following amplification program was applied: 3 min of denaturation at 95°C, and 40 cycles of amplification (30 sec at 95°C, 30 sec at 60°C, and 30 sec at 72°C). Electrophoresis of the products amplified by real-time PCR showed a single band. The relative expression levels of hnRNP L and hnRNP LL normalized to β-actin were determined using Gene Expression Macro (version 1.1; Bio-Rad) and presented as fold change in gene expression relative to the luciferase control.
The DNA oligonucleotides were
hnRNP L fwd, 5′-TTCTGCTTATATGGCAATGTGG-3′;
hnRNP L rev, 5′-GACTGACCAGGCATGATGG-3′;
hnRNP LL fwd, 5′-ACCATTCCTGGTACAGCACTG-3′;
hnRNP LL rev, 5′-TGGCCAGCACTTGTAAAGC-3′;
β-actin 703, 5′-TGGACTTCGAGCAAGAGATG-3′; and
β-actin 994, 5′-GTGATCTCCTTCTGCATCCTG-3′.
For other RT-PCR assays used in validations, conditions were optimized with respect to primer annealing temperatures, primer concentration, MgCl2 concentrations, and number of cycles. To be semiquantitative, all PCR reactions were performed in the linear amplification range and in triplicate. Ethidium bromide-stained bands were quantitated by TINA software, version 2.07d. Gene-specific primer sequences are available upon request.
Western blot analysis, recombinant proteins
Cells were lysed in WB100 buffer (20 mM HEPES at pH 7.5, 1 mM DTT, 10 mM MgCl2, 100 mM KCl, 1% NP-40) on ice for 10 min. For hnRNP LL, cell lysates were incubated with 20 μL of streptavidin beads (Sigma), to which 5′-biotinylated (CA)32 RNA oligonucleotide had been pre-bound (incubation for 1 h at 30°C) (Hui et al. 2003a). After washing with WB400 buffer (20 mM HEPES at pH 7.5, 1 mM DTT, 10 mM MgCl2, 400 mM KCl, 0.05% NP-40) once and with WB100 three times, SDS-PAGE loading buffer was added to the beads. Cell lysates (for hnRNP L) and (CA)32 RNA affinity-selected material (for hnRNP LL; see above) were separated on a 10% SDS polyacrylamide gel and transferred to Hybond ECL nitrocellulose membranes (Amersham). Anti-hnRNP L monoclonal antibody 4D11 (provided by Gideon Dreyfuss), anti-hnRNP LL polyclonal antibody (see below), and anti-γ tubulin monoclonal antibody GTU-88 (Sigma) were used as primary antibodies, and horseradish peroxidase-conjugated anti-mouse or rabbit IgG (Sigma) was used as the secondary antibody. The blots were developed with the ECL system.
Recombinant baculovirus-expressed hnRNP L has been described (Hui et al. 2003a). For recombinant hnRNP LL, a PCR fragment amplified from oligo (dT)18-primed cDNA (see above), using primers LL3 and LL4, was digested with EcoRI and SalI and inserted into pGEX-5X-2 (Amersham). From the resulting construct, pGEX-5X-2/LL, the hnRNP LL open reading frame was excised as an EcoRI-SalI fragment and ligated into pFASTBAC HTb (Bac-to-Bac expression system; Invitrogen), followed by expression and purification of His-tagged hnRNP LL on Ni-NTA agarose (QIAGEN) (Bell et al. 2002). For raising polyclonal anti-hnRNP LL antibodies (Biogenes), recombinant hnRNP LL was expressed in Escherichia coli BL21(DE3) pLysS, affinity-purified on glutathione Sepharose 4B (Amersham), and gel-purified.
The DNA oligonucleotides used were LL3, 5′-TTAAGAATTCCATCCTCCTCCTCTTCCTCC-3′ and LL4, 5′-TTAAGTCGACTTATAAATGGGATGATGTAGAAAA-3′.
Microarray analysis
Microarray processing
The GeneChip Human Exon 1.0 Array contains more than 5.5 million features (probes) grouped into ∼1.4 million probe sets, which interrogate more than 1 million exon clusters (http://www.affymetrix.com); this array was used to monitor the differences of exon expression signals between the sample groups. A total of 12 RNA samples (three biological replicates of each RNAi knockdown: luciferase control, hnRNP L, hnRNP LL, hnRNP L/LL) were processed according to Affymetrix's standard protocol [GeneChip Whole Transcript (WT) Sense Target Labeling Assay Manual; http://www.affymetrix.com/products/arrays/specific/exon.affx]. Arrays were scanned using the Affymetrix GCS 3000 7G and Gene-Chip Operating Software v. 1.4 to produce .CEL intensity files. Quality control was performed with the Affymetrix Expression Console software. The array raw data were submitted to GEO under the accession number GSE8945.
Array probe-set selection and annotation
Using the NCBI contig annotation for the human genome, the exon/intron sequences of 22,911 genes were assembled based on their corresponding mRNA reference sequences. A total of ∼600,000 probe sets were selected for further data analysis, where the alignment score of the probe-set sequence with the exon/intron sequence of the gene was >95%, and were annotated as exon or intron probe sets according to their mRNA reference sequence. An intron probe set as defined here indicates only that it is placed in the intron region of the NCBI-annotated mRNA reference sequence, but may beexonic, according to EST/cDNA/mRNA data.
Data normalization and preprocessing
The estimated probe signals of the selected 600,000 probe sets (approximately 2.4 million probes) were extracted from the 12 .CEL files and normalized separately, using the “vsn” and “rma” methods from the Bioconductor package (http://www.bioconductor.org). Thereafter, the “medianpolish” method was applied to generate expression levels of probe sets in log2 scale, which were then assigned to the annotated gene data (see above), creating 22,911 “gene data sets.”
Gene data filtering
Probe sets with low expression levels indicate low/no expression or are non-informative due to low affinity of their probes. They also can lead to unreliable expression level ratios between sample groups and contribute to a high false-positive rate in target selection. Here we define a probe to be “absent” if its expression level in all 12 samples is lower than the 50% quantile of the sample; otherwise it is “present.” Only those gene data sets were selected for further analysis for which at least 50% of the total exon probes are “present.” About 9000 gene data sets passed this filtering criterion.
Detection of alternative splicing targets
The difference of log2 expression levels (which is the log2 value of the ratio of expression signals detected by the array; called “dR” in the following and in all figures) of each probe set between sample groups (ΔL: hnRNP L knockdown vs. luciferase control; ΔLL: hnRNP LL knockdown vs. luciferase control; ΔL + ΔLL: hnRNP L/LL double knockdown vs. luciferase control) was calculated as well as the t-test P-value (3 + 3 pairwise comparison). A single probe set (or a group of probe sets next to each other) with significantly higher or lower dR value compared with the mean dR value of all the other probe sets in the gene data set indicates a possible alternative splicing event. Specifically, potential targets are selected by the following process:
First, intron probe sets are most likely non-informative and should be analyzed separately from the exon probe sets. Initially the difference between the dR value of each exon probe set and the mean dR of all the other exon probe sets (called diff_dR in the following) is calculated, then the difference between the dR value of each intron probe set and the mean dR value of all exon probe sets.
Second, a probe set with diff_dR values >1.0 (or >1.5, to set the selection more stringently) is selected for further analysis if (1) its P-value of the dR t-test is <0.05 (or < 0.01, to set the selection more stringently), (2) it contains more than three probes, and (3) it has no indication of cross-hybridization, according to Affymetrix's probe-set annotation.
Third, additional options were used to increase the stringency of the selection: (1) selecting target probe sets that occur both in the ΔL + ΔLL data as well as in the ΔL and/or ΔLL data; (2) in case of gene up-regulation/down-regulation, the majority of intron probe sets with nonspecific binding will have near zero dR values and high diff_dR values, since the mean dR value of the exons are much higher (up-regulated genes) or lower (down-regulated genes) than zero. Only those intron probe sets with a dR value of at least 1 are selected.
Fourth, gene data sets that contain the selected probe sets as described above are then plotted with the dR value (Y-axis) of all probe sets (X-axis). In combination with information from the Human Genome Browser (http://genome.ucsc.edu/cgi-bin/hgGateway), which includes the mRNA expression data as well as the array probe-set locations, potential alternative splicing processes are identified for experimental validation (for examples, see Figs. 3–6).
Calculation of hnRNP L-binding motif score
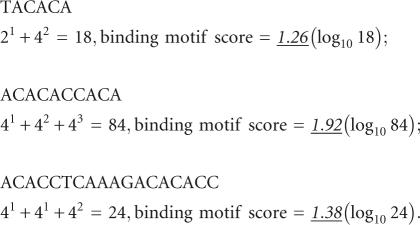
Based on our SELEX and GST pull-down experiments (Hui et al. 2005), the tetranucleotide elements ACAC or CACA represent high-score motifs, and TACA, ACAT, and CACC low-score motifs for RNA binding by hnRNP L. In addition, clustering of these motifs strongly contributes to the hnRNP L-binding affinity. To calculate scores, the sequence of the target region is first scanned for those five tetranucleotides; if tetranucleotides occur in proximity, with less than 10 nt spacing in between, this is defined as a cluster (also called a binding motif). The score of each binding motif is calculated as follows (for examples, see below):
Each high-score motif is entered with a value of 4, each low-score motif with a value of 2.
Contiguous tetranucleotides (shifted by two nucleotides [overlap] or four nucleotides [without overlap]) are entered as exponentiation (1, 2, 3, etc.).
The total score is calculated as the log10 value of the sum of individual numbers.
Examples:
 |
ACKNOWLEDGMENTS
We thank Tomi Ivacevic (Genomics Core Facility, EMBL, Heidelberg) for excellent technical assistance; Gideon Dreyfuss for gifts of anti-hnRNP L monoclonal antibody 4D11; Melissa Cline for discussions about statistical models for microarray data analysis; Gerrit Eichner for help in programming with R; Jan Medenbach for essential help in qPCR analysis; Karl Stangl for genomic DNA; and Oliver Rossbach, Marco Preussner, and other members of our group for discussions and comments on the manuscript. This work was supported by grants from the Deutsche Forschungsgemeinschaft (DFG grant Bi 316/10), the Federal Ministry for Education and Research (BMBF NGNF-2 program), the European-Commission-funded Network of Excellence EURASNET, and the Fonds der Chemischen Industrie.
Footnotes
Article published online ahead of print. Article and publication date are at http://www.rnajournal.org/cgi/doi/10.1261/rna.725208.
REFERENCES
- Ast, G. How did alternative splicing evolve? Nat. Rev. Genet. 2004;5:773–782. doi: 10.1038/nrg1451. [DOI] [PubMed] [Google Scholar]
- Bell, M., Schreiner, S., Damianov, A., Reddy, R., Bindereif, A. p110, a novel human U6 snRNP protein and U4/U6 snRNP recycling factor. EMBO J. 2002;21:2724–2735. doi: 10.1093/emboj/21.11.2724. [DOI] [PMC free article] [PubMed] [Google Scholar]
- Bilbao, D., Valcarcel, J. Getting to the heart of a splicing enhancer. Nat. Struct. Biol. 2003;10:6–7. doi: 10.1038/nsb0103-6. [DOI] [PubMed] [Google Scholar]
- Black, D.L. Mechanisms of alternative pre-messenger RNA splicing. Annu. Rev. Biochem. 2003;72:291–336. doi: 10.1146/annurev.biochem.72.121801.161720. [DOI] [PubMed] [Google Scholar]
- Blanchette, M., Green, R.E., Brenner, S.E., Rio, D.C. Global analysis of positive and negative pre-mRNA splicing regulators in Drosophila . Genes & Dev. 2005;19:1306–1314. doi: 10.1101/gad.1314205. [DOI] [PMC free article] [PubMed] [Google Scholar]
- Blencowe, B.J. Alternative splicing: New insights from global analyses. Cell. 2006;126:37–47. doi: 10.1016/j.cell.2006.06.023. [DOI] [PubMed] [Google Scholar]
- Cheli, Y., Kunicki, T.J. hnRNP L regulates differences in expression of mouse integrin α2β1. Blood. 2006;107:4391–4398. doi: 10.1182/blood-2005-12-4822. [DOI] [PMC free article] [PubMed] [Google Scholar]
- Clark, T.A., Schweitzer, A.C., Chen, T.X., Staples, M.K., Lu, G., Wang, H., Williams, A., Blume, J.E. Discovery of tissue-specific exons using comprehensive human exon microarrays. Genome Biol. 2007;8:R64. doi: 10.1186/gb-2007-8-4-r64. [DOI] [PMC free article] [PubMed] [Google Scholar]
- Gardina, P.J., Clark, T.A., Shimada, B., Staples, M.K., Yang, Q., Veitch, J., Schweitzer, A., Awad, T., Sugnet, C., Dee, S., et al. Alternative splicing and differential gene expression in colon cancer detected by a whole genome exon array. BMC Genomics. 2006;7:325. doi: 10.1186/1471-2164-7-325. [DOI] [PMC free article] [PubMed] [Google Scholar]
- Guang, S., Felthauser, A.M., Mertz, J.E. Binding of hnRNP L to the pre-mRNA processing enhancer of the herpes simplex virus thymidine kinase gene enhances both polyadenylation and nucleocytoplasmic export of intronless mRNAs. Mol. Cell. Biol. 2005;25:6303–6313. doi: 10.1128/MCB.25.15.6303-6313.2005. [DOI] [PMC free article] [PubMed] [Google Scholar]
- Hahm, B., Kim, Y.K., Kim, J.H., Kim, T.Y., Jang, S.K. Heterogeneous nuclear ribonucleoprotein L interacts with the 3′ border of the internal ribosomal entry site of hepatitis C virus. J. Virol. 1998a;72:8782–8788. doi: 10.1128/jvi.72.11.8782-8788.1998. [DOI] [PMC free article] [PubMed] [Google Scholar]
- Hahm, B., Cho, O.H., Kim, J.E., Kim, Y.K., Kim, J.H., Oh, Y.L., Jang, S.K. Polypyrimidine tract-binding protein interacts with hnRNP L. FEBS Lett. 1998b;425:401–406. doi: 10.1016/s0014-5793(98)00269-5. [DOI] [PubMed] [Google Scholar]
- House, A.E., Lynch, K.W. An exonic splicing silencer represses spliceosome assembly after ATP-dependent exon recognition. Nat. Struct. Mol. Biol. 2006;13:937–944. doi: 10.1038/nsmb1149. [DOI] [PubMed] [Google Scholar]
- Hui, J., Bindereif, A. Alternative pre-mRNA splicing in the human system: Unexpected role of repetitive sequences as regulatory elements. Biol. Chem. 2005;386:1265–1271. doi: 10.1515/BC.2005.143. [DOI] [PubMed] [Google Scholar]
- Hui, J., Stangl, K., Lane, W.L., Bindereif, A. HnRNP L stimulates splicing of the eNOS gene by binding to variable-length CA repeats. Nat. Struct. Biol. 2003a;10:33–37. doi: 10.1038/nsb875. [DOI] [PubMed] [Google Scholar]
- Hui, J., Reither, G., Bindereif, A. Novel functional role of CA repeats and hnRNP L in RNA stability. RNA. 2003b;9:931–936. doi: 10.1261/rna.5660803. [DOI] [PMC free article] [PubMed] [Google Scholar]
- Hui, J., Hung, L.H., Heiner, M., Schreiner, S., Neumüller, N., Reither, G., Haas, S.A., Bindereif, A. Intronic CA-repeat and CA-rich elements: A new class of regulators of mammalian alternative splicing. EMBO J. 2005;24:1988–1998. doi: 10.1038/sj.emboj.7600677. [DOI] [PMC free article] [PubMed] [Google Scholar]
- Ip, J.Y., Tong, A., Pan, Q., Topp, J.D., Blencowe, B.J., Lynch, K.W. Global analysis of alternative splicing during T-cell activation. RNA. 2007;13:563–572. doi: 10.1261/rna.457207. [DOI] [PMC free article] [PubMed] [Google Scholar]
- Kim, J.H., Hahm, B., Kim, Y.K., Choi, M., Jang, S.K. Protein–protein interaction among hnRNPs shuttling between nucleus and cytoplasm. J. Mol. Biol. 2000;298:395–405. doi: 10.1006/jmbi.2000.3687. [DOI] [PubMed] [Google Scholar]
- Lee, K.A., Bindereif, A., Green, M.R. A small-scale procedure for preparation of nuclear extracts that support efficient transcription and pre-mRNA splicing. Gene Anal. Tech. 1988;5:22–31. doi: 10.1016/0735-0651(88)90023-4. [DOI] [PubMed] [Google Scholar]
- Liu, X., Mertz, J.E. HnRNP L binds a cis-acting RNA sequence element that enables intron-independent gene expression. Genes & Dev. 1995;9:1766–1780. doi: 10.1101/gad.9.14.1766. [DOI] [PubMed] [Google Scholar]
- Modrek, B., Lee, C. A genomic view of alternative splicing. Nat. Genet. 2002;30:13–19. doi: 10.1038/ng0102-13. [DOI] [PubMed] [Google Scholar]
- Ni, J.Z., Grate, L., Donohue, J.P., Preston, C., Nobida, N., O'Brien, G., Shiue, L., Clark, T.A., Blume, J.E., Ares M., Jr Ultraconserved elements are associated with homeostatic control of splicing regulators by alternative splicing and nonsense-mediated decay. Genes & Dev. 2007;21:708–718. doi: 10.1101/gad.1525507. [DOI] [PMC free article] [PubMed] [Google Scholar]
- Pagani, F., Buratti, E., Stuani, C., Bendix, R., Dork, T., Baralle, F.E. A new type of mutation causes a splicing defect in ATM. Nat. Genet. 2002;30:426–429. doi: 10.1038/ng858. [DOI] [PubMed] [Google Scholar]
- Pan, Q., Shai, O., Misquitta, C., Zhang, W., Saltzman, A.L., Mohammad, N., Babak, T., Siu, H., Hughes, T.R., Morris, Q.D., et al. Revealing global regulatory features of mammalian alternative splicing using a quantitative microarray platform. Mol. Cell. 2004;16:929–941. doi: 10.1016/j.molcel.2004.12.004. [DOI] [PubMed] [Google Scholar]
- Pan, Q., Saltzman, A.L., Kim, Y.K., Misquitta, C., Shai, O., Maquat, L.E., Frey, B.J., Blencowe, B.J. Quantitative microarray profiling provides evidence against widespread coupling of alternative splicing with nonsense-mediated mRNA decay to control gene expression. Genes & Dev. 2006;20:153–158. doi: 10.1101/gad.1382806. [DOI] [PMC free article] [PubMed] [Google Scholar]
- Piñol-Roma, S., Swanson, M.S., Gall, J.G., Dreyfuss, G. A novel heterogeneous nuclear RNP protein with a unique distribution on nascent transcripts. J. Cell Biol. 1989;109:2575–2587. doi: 10.1083/jcb.109.6.2575. [DOI] [PMC free article] [PubMed] [Google Scholar]
- Rothrock, C.R., House, A.E., Lynch, K.W. HnRNP L represses exon splicing via a regulated exonic splicing silencer. EMBO J. 2005;24:2792–2802. doi: 10.1038/sj.emboj.7600745. [DOI] [PMC free article] [PubMed] [Google Scholar]
- Shih, S.C., Claffey, K.P. Regulation of human vascular endothelial growth factor mRNA stability in hypoxia by heterogeneous nuclear ribonucleoprotein L. J. Biol. Chem. 1999;274:1359–1365. doi: 10.1074/jbc.274.3.1359. [DOI] [PubMed] [Google Scholar]
- Sironi, M., Menozzi, G., Riva, L., Cagliani, R., Comi, G.P., Bresolin, N., Giorda, R., Pozzoli, U. Silencer elements as possible inhibitors of pseudoexon splicing. Nucleic Acids Res. 2004;32:1783–1791. doi: 10.1093/nar/gkh341. [DOI] [PMC free article] [PubMed] [Google Scholar]
- Sugnet, C.W., Srinivasan, K., Clark, T.A., O'Brien, G., Cline, M.S., Wang, H., Williams, A., Kulp, D., Blume, J.E., Haussler, D., et al. Unusual intron conservation near tissue-regulated exons found by splicing microarrays. PLoS Comput. Biol. 2006;2:e4. doi: 10.1371/journal.pcbi.0020004. [DOI] [PMC free article] [PubMed] [Google Scholar]
- Sun, H., Chasin, L.A. Multiple splicing defects in an intronic false exon. Mol. Cell. Biol. 2000;20:6414–6425. doi: 10.1128/mcb.20.17.6414-6425.2000. [DOI] [PMC free article] [PubMed] [Google Scholar]
- Tian, B., Hu, J., Zhang, H., Lutz, C.S. A large-scale analysis of mRNA polyadenylation of human and mouse genes. Nucleic Acids Res. 2005;33:201–212. doi: 10.1093/nar/gki158. [DOI] [PMC free article] [PubMed] [Google Scholar]
- Tian, B., Pan, Z., Lee, J.Y. Widespread mRNA polyadenylation events in introns indicate dynamic interplay between polyadenylation and splicing. Genome Res. 2007;17:156–165. doi: 10.1101/gr.5532707. [DOI] [PMC free article] [PubMed] [Google Scholar]
- Tuffery-Giraud, S., Saquet, C., Chambert, S., Claustres, M. Pseudoexon activation in the DMD gene as a novel mechanism for Becker muscular dystrophy. Hum. Mutat. 2003;21:608–614. doi: 10.1002/humu.10214. [DOI] [PubMed] [Google Scholar]
- Ule, J., Ule, A., Spencer, J., Williams, A., Hu, J.S., Cline, M., Wang, H., Clark, T., Fraser, C., Ruggiu, M., et al. Nova regulates brain-specific splicing to shape the synapse. Nat. Genet. 2005;37:844–852. doi: 10.1038/ng1610. [DOI] [PubMed] [Google Scholar]
- Waterston, R.H., Lindblad-Toh, K., Birney, E., Rogers, J., Abril, J.F., Agarwal, P., Agarwala, R., Ainscough, R., Alexandersson, M., An, P., et al. Initial sequencing and comparative analysis of the mouse genome. Nature. 2002;420:520–562. doi: 10.1038/nature01262. [DOI] [PubMed] [Google Scholar]


